
Automate anomaly detection and accelerate root cause analysis with AIOps
Consume and process large observability data sets at scale to quickly zero in on the most relevant information to the business. Elastic Observability utilizes context-aware generative AI and advanced machine learning to reduce labor-intensive troubleshooting and streamline triage activities so teams can focus on innovation and future transformation.
Why you need AIOps as part of your Observability practice
Watch nowElastic named a Strong Performer in The Forrester Wave™: AIOps, Q4 2022
Get the reportDISH Media accelerates root cause analysis with Elastic Observability and machine learning
Read the case studyEmpower SREs with AI-powered insights
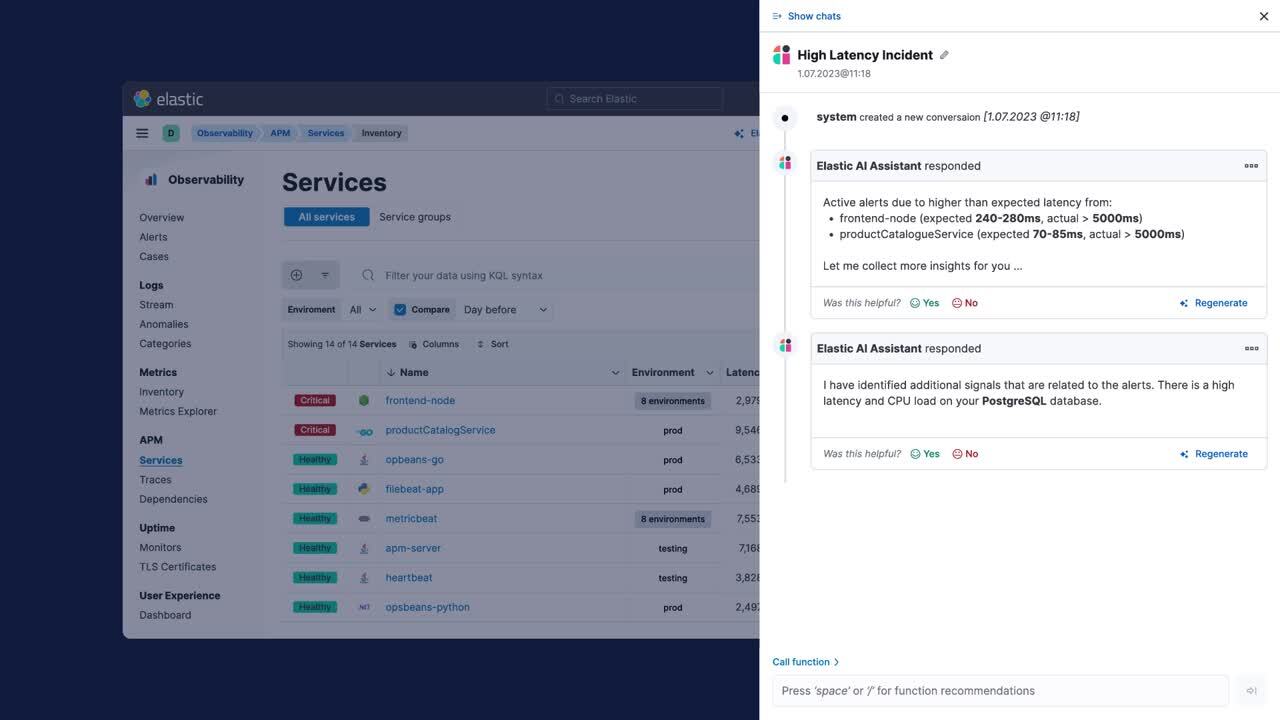
Combine generative AI with Elastic Observability and advanced machine learning for a context-aware interactive chat experience based on your proprietary data and runbooks. The Elastic AI Assistant can help you interpret log messages and errors, provide suggestions for optimal code efficiency, write reports, and even help identify and execute a runbook. Enable faster problem resolution, improve collaboration, unlock knowledge silos, and empower all users, allowing teams to focus on building better software.
Proactively detect outliers and trends
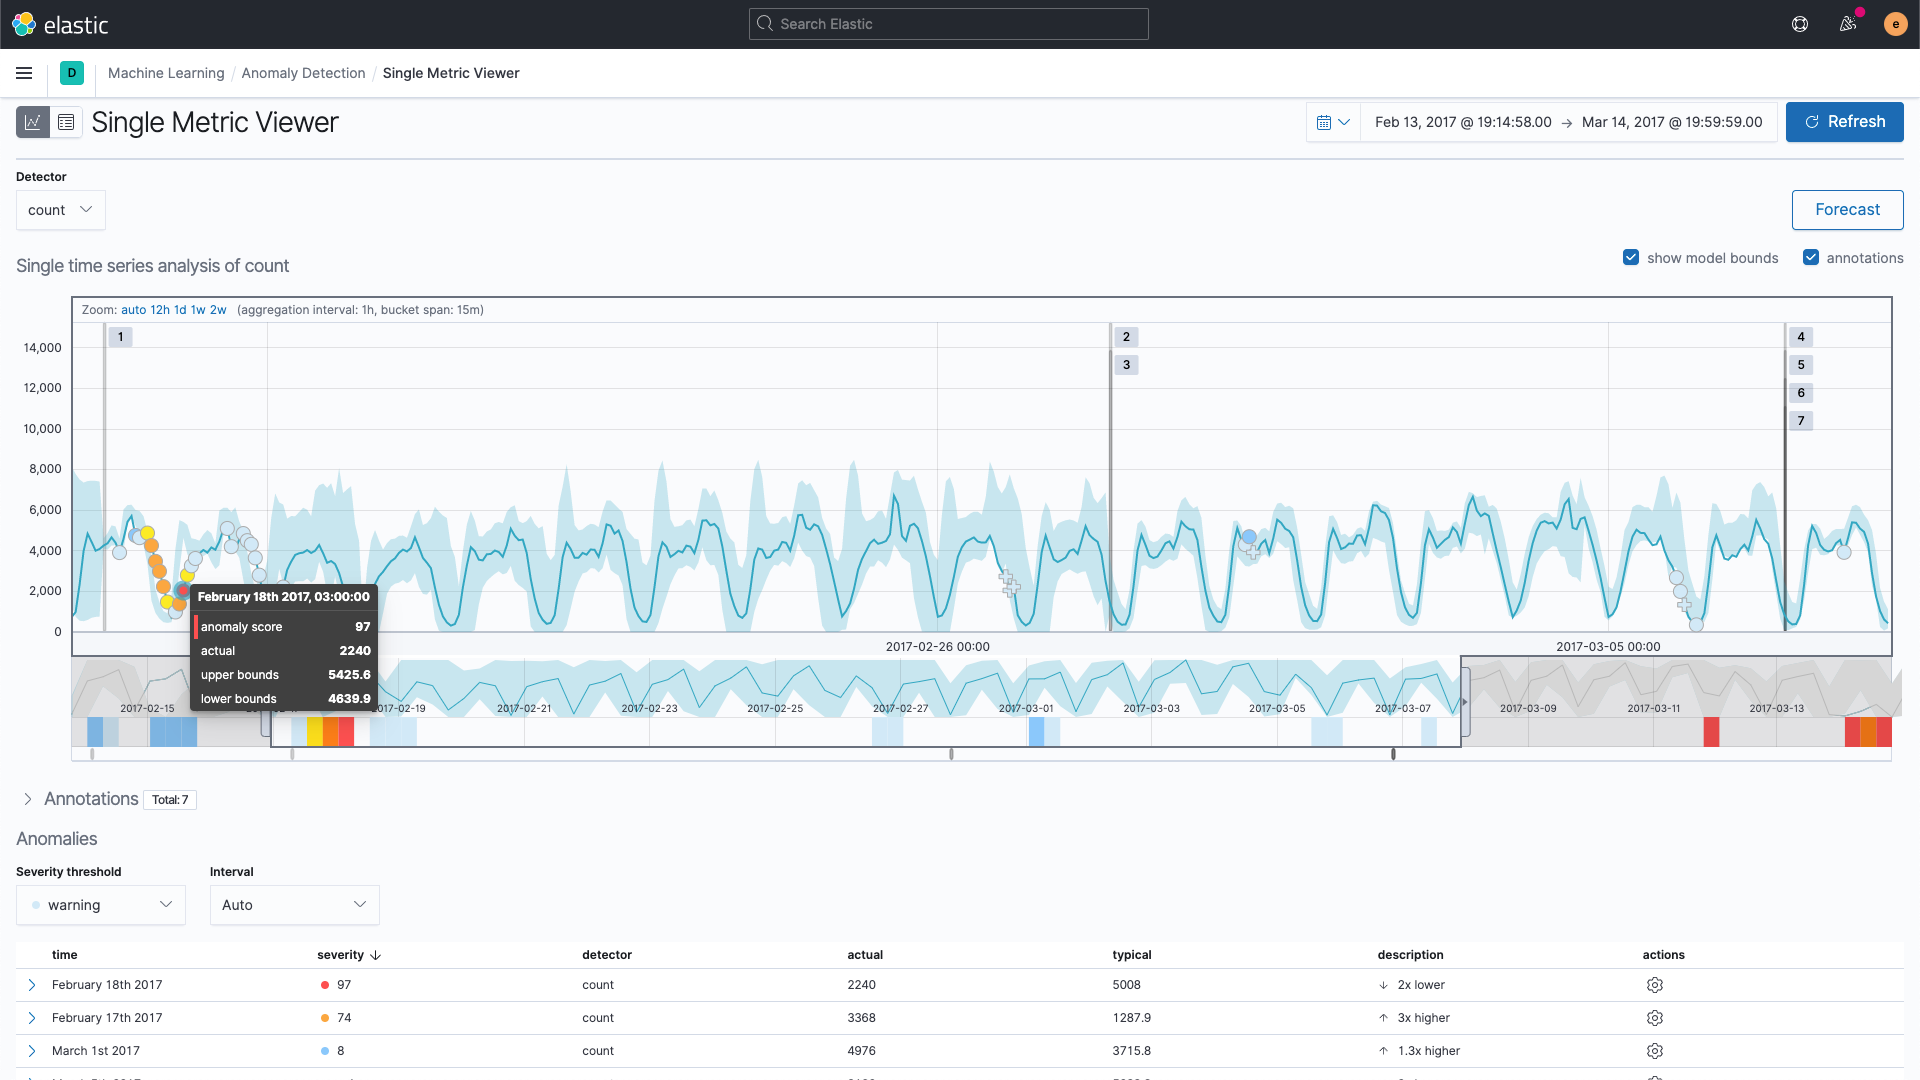
Apply supervised and unsupervised machine learning to any type of log, trace, event or metrics data, whether business or operational. Detect outliers and anomalies, forecast trends, discover patterns, categorize logs, and more, with domain-specific capabilities. Choose from an extensive open library of customizable out-of-the-box ML models or build, test, and deploy your own. Automatically surface regressions between releases and identify the downstream impact of changes to apps or infrastructure in rapidly shifting microservices-based cloud native environments.
Unlock the full power of your data
Extract answers from petabytes of observability data within minutes with a machine learning engine that is both performant and scalable. democratize ML and analytics for the non data scientists in your organization, such as SRE teams and business users, with 100+ pre-configured models for common use cases, easy-to-use wizard-based workflows to facilitate customization, and an integrated data exploration tool. Open ML models give sophisticated users the flexibility to see “underneath the hood” and customize as desired.
Accelerate problem resolution
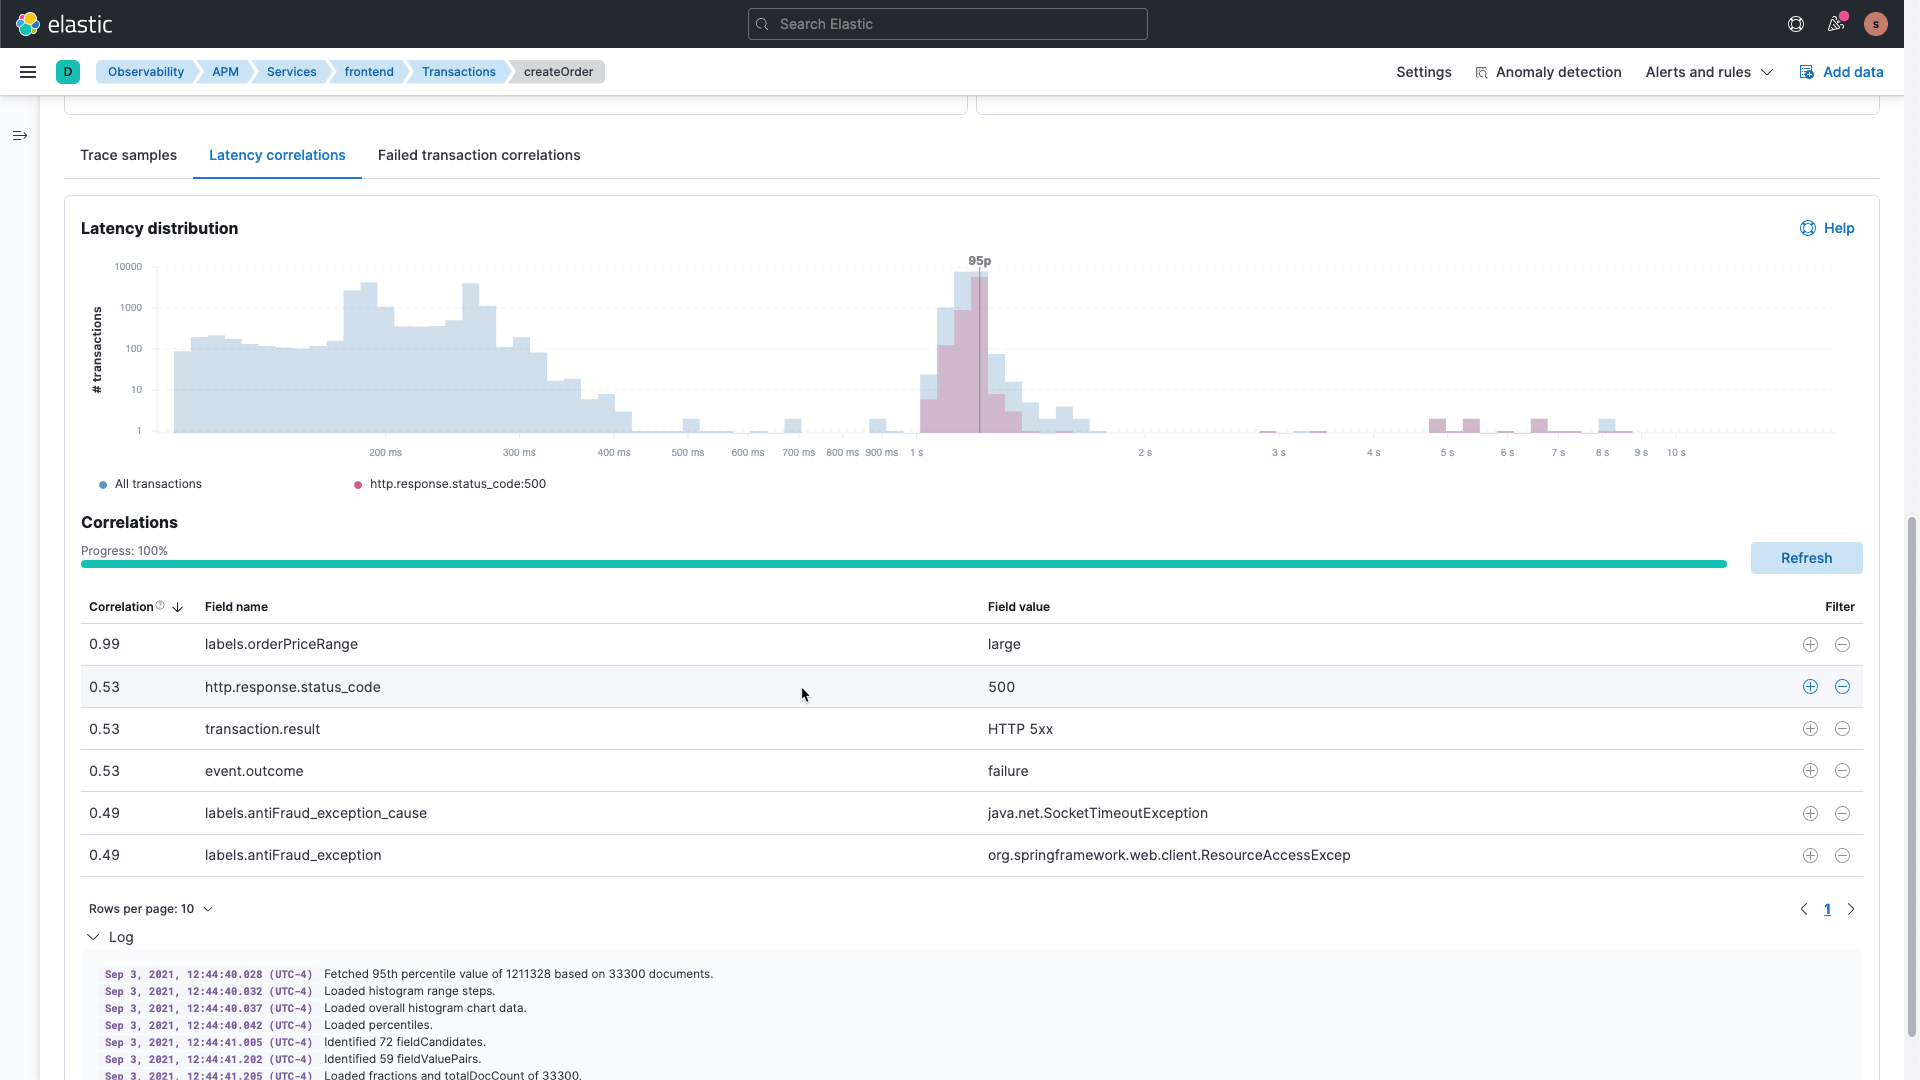
Automatically surface attributes of your application and infrastructure data set that are correlated with high-latency or erroneous transactions and have the most significant impact on overall service performance. Machine learning based correlations can pinpoint unknown unknowns in your observability data to help find root causes faster. Quickly analyze and take action on events by reducing millions of lines of unstructured log data into just a few categories with automatic log classification. Use automated anomaly detection to identify issues such as atypical patterns in logs, degraded services, log rate spikes, unusual transaction activity, or surges in resource utilization.
Streamline alerts with your workflows and incident management
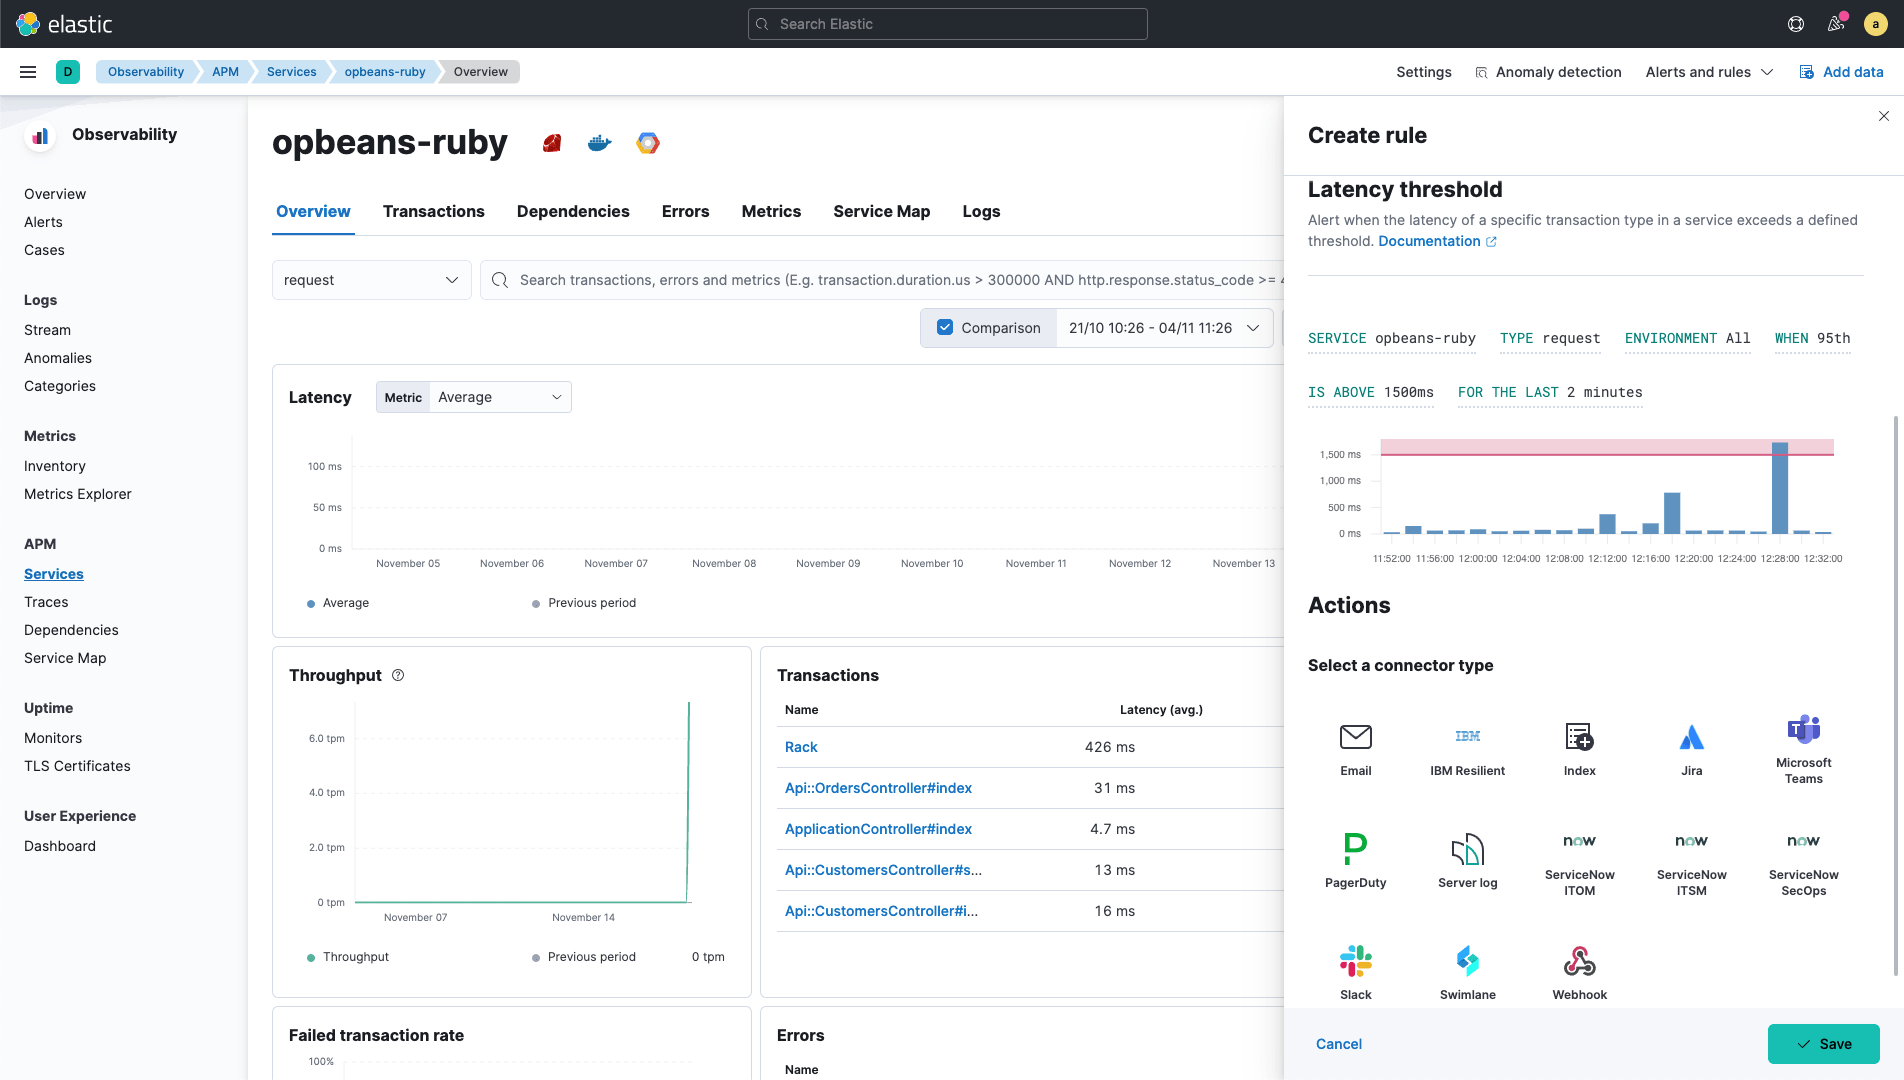
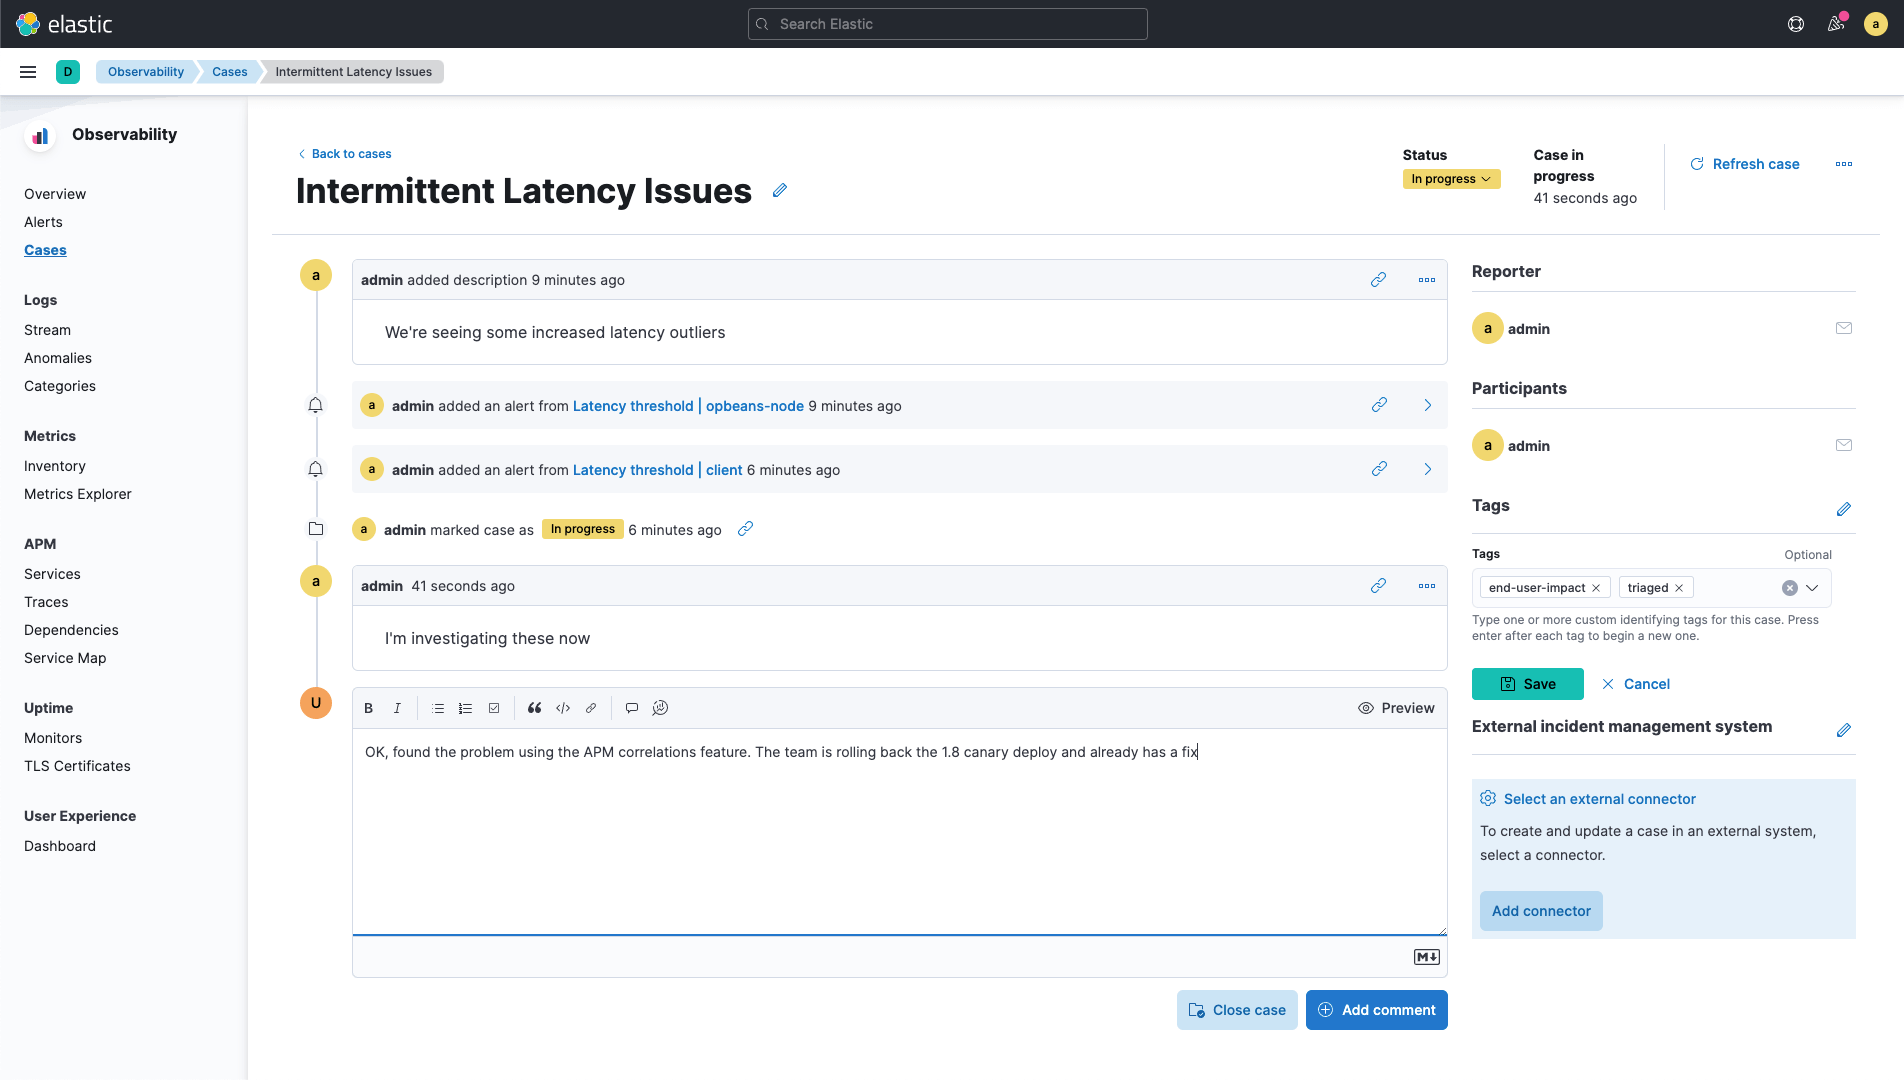
Receive contextual alert notifications when anomalies are detected that meet certain conditions. Initiate a case to begin the incident management process by opening and tracking service issues directly within Elastic Observability. Connect your alerts to actions by using built-in integrations for PagerDuty, ServiceNow, Jira, Microsoft Teams, Slack, and email. Leverage the powerful webhook output in Elastic Stack, letting you tie into additional third-party systems that matter to your organization and integrate with your team's workflows.
