About cookies on this site Our websites require some cookies to function properly (required). In addition, other cookies may be used with your consent to analyze site usage, improve the user experience and for advertising. For more information, please review your options. By visiting our website, you agree to our processing of information as described in IBM’sprivacy statement. To provide a smooth navigation, your cookie preferences will be shared across the IBM web domains listed here.
Tutorial
ESG forecasting with IBM Envizi and Planning Analytics
Learn how to integrate IBM Envizi with Planning Analytics AddOn to forecast, set targets, and enhance ESG planning
On this page
Organizations are adopting integrated planning approaches that include ESG (Environmental, Social, and Governance) metrics. This shift highlights the need for comprehensive planning solutions that address diverse requirements. Traditional planning and forecasting tools are not designed to manage ESG data models effectively. As ESG data management, planning, and reporting become integral to business processes, they must also adhere to stringent standards.
With expanding ESG reporting disclosure requirements and increased scrutiny on ESG performance, organizations require sophisticated, customized tools to support ESG planning and forecasting. These tools should facilitate integrated planning and help businesses navigate this evolving landscape.
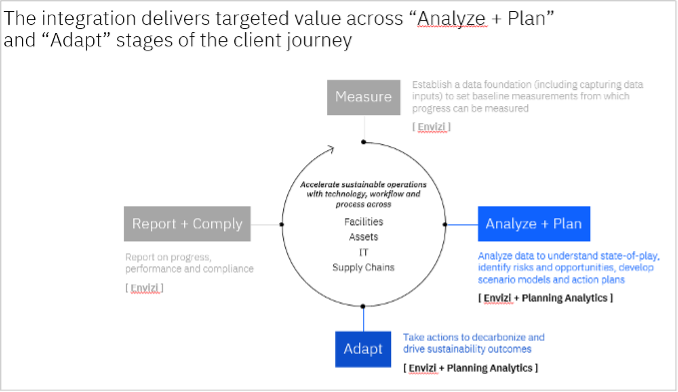
Bridging sustainability and planning
The intersection of sustainability and planning is where IBM Envizi ESG Suite and IBM Planning Analytics come together to provide a seamless solution. IBM Envizi ESG Suite focuses on managing historical and current ESG data for reporting and disclosure, ensuring compliance. IBM Planning Analytics supports ESG planning by enabling emissions reduction initiatives to meet KPIs and achieve net-zero targets.
IBM Planning Analytics (PA) for Envizi is an add-on solution that allows customers to leverage advanced forecasting and scenario modeling capabilities for their ESG data within the IBM Envizi ESG Suite.
In this tutorial:
- Learn how API-based file transfers facilitate secure, reliable, and automated data exchange between Envizi and PA.
- Understand how data cubes replicate Envizi’s data structure in the Planning Analytics environment, enabling tailored sustainability modeling and forecasting.
- Discover how Activity and Emissions Forecasting accelerates decarbonization planning, allowing organizations to set and track emissions reduction targets.
Getting started
This journey begins by launching the accelerator to explore templates and dashboards. From there, users can perform simple calculations on forecasts, develop actionable targets, and export them back into Envizi for ongoing performance monitoring.
Prerequisite
Access to an Envizi instance with the IBM Planning Analytics add-on enabled.
High-level architecture
An high-level architecture for integrating Envizi with the IBM Planning Analytics add-on follows:
Steps
1. Understanding the Envizi platform
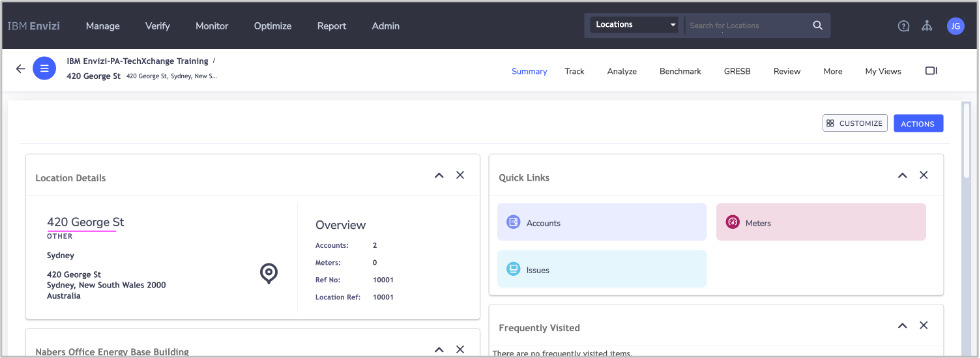
Consider the organizational hierarchy within the Envizi platform.
Click to expand the
420 George Stlocation.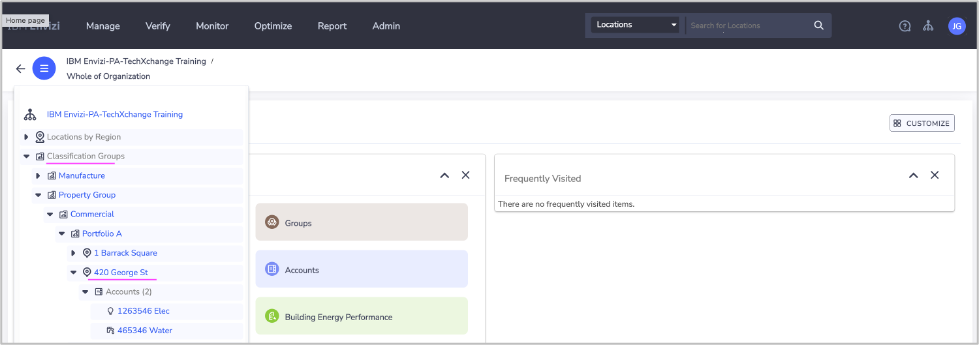
View the detailed information for the selected location.
2. Launch PA and the Envizi accelerator
Launch the IBM Planning Analytics (PA) platform using your IBM ID.
Click on the
Envizi Activity and Emissions Forecastingtile.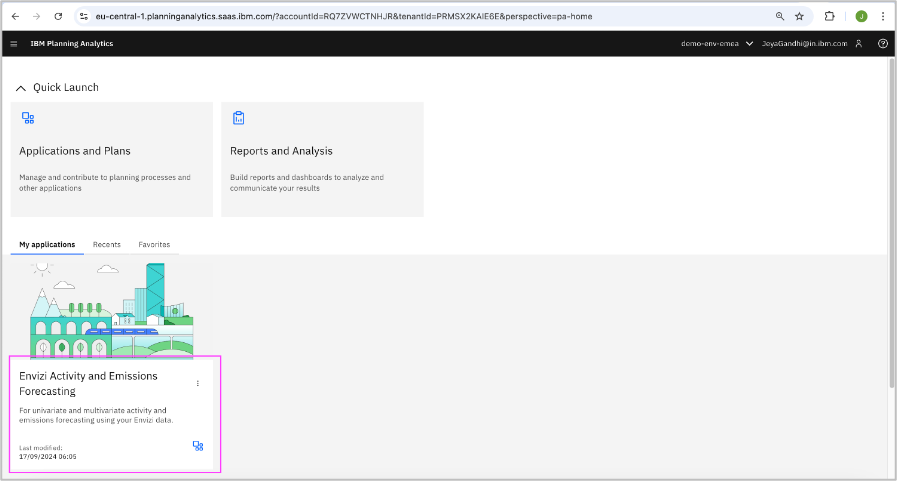
Ensure that
Accelerator 1 – Accountis displayed on the left side.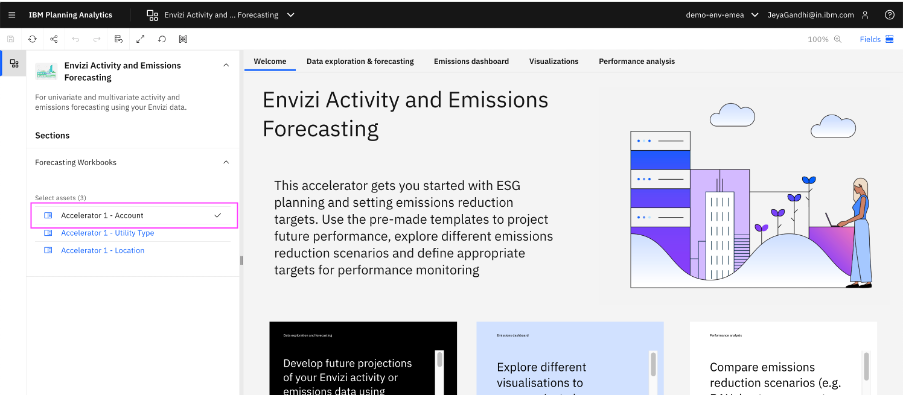
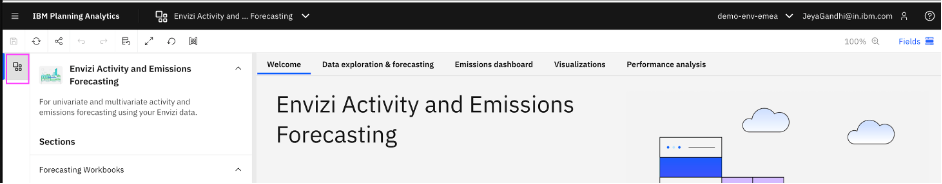
Close the side pane on the left side of the screen to focus on the relevant workbook and ignore other workbooks in the accelerator at this stage.
3. Explore templates and dashboards
The initial screen of the accelerator provides an overview of the available templates and dashboards. Each tab includes the following details:
- Purpose: The primary objective of the tab.
- Capabilities to Explore: Features and functionalities to utilize.
- Next Steps: Actions to proceed further.
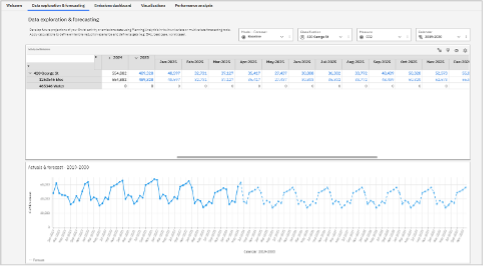
4. PA data exploration and forecasting
The Data Exploration & Forecasting tab provides tools to analyze and interact with Envizi data effectively.
Key features
Exploration Grid
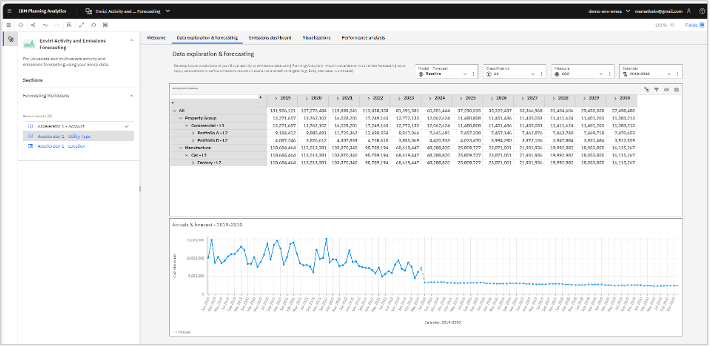
- Functions like a flexible pivot table.
- Allows you to add, edit, or remove objects (dimensions) in your workbench to customize how data is displayed and grouped.
- Envizi data is brought into Planning Analytics automatically through integration, eliminating the need for manual setup of cubes or dimensions.
- Data is updated daily, ensuring users always reference the latest figures.
Filter Widgets
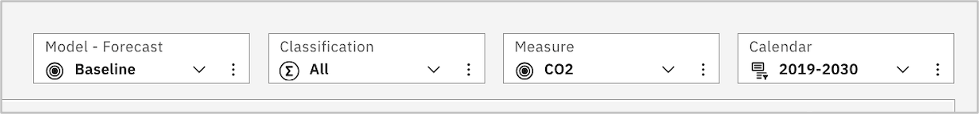
Located above the exploration grid, these widgets allow you to select or filter data based on specific dimension members.
Updating dashboard Filters
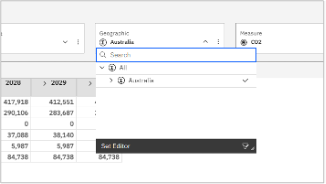
To modify the dashboard filters, select the Property Group member from the Classificationsfilter widget and drill down through the available members if necessary to locate the desired property.
5. Setting up forecasts
As a Sustainability Manager, your role might involve showcasing how the organization can meet future GHG reduction targets. This includes analyzing future projections of activities or emissions based on historical data and leveraging these insights to propose sustainability initiatives. For instance, investing in projects like installing automated lighting sensors to reduce emissions.
To begin forecasting emissions:
Step 1: Set the Measure Value
Set the Envizi Measure Value to
CO2e (kgCO2e).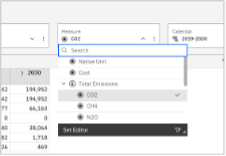
Step 2: Drill down to specific location
Suppose you are interested in emissions generated from electricity usage at a specific building, such as 420 George St. To focus on this location:
Open the
Classificationdropdown in the filter.Drill down through the hierarchy:
All > Property Group > Commercial - L1 > Portfolio A - L2 > 420 George St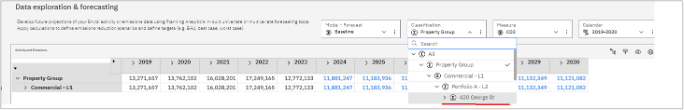
Alternatively, you can use the filter widgets at the top of the screen.
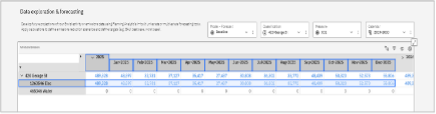
Step 3: Explore accounts under the location
Once you expand the building, the accounts associated with it will appear. In this case, there are two accounts:
- Electricity account
- Water account
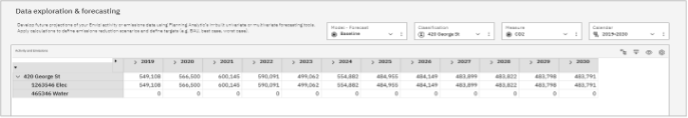
These accounts are named as per their designation in Envizi. Additional attributes such as account numbers or other details can also be displayed as needed.
6. Creating a sandbox
Creating a sandbox allows you to work in a private, isolated workspace for testing or analysis. Follow these steps to create one:
Click on the grid and highlight any row. For example, select the record for
420 George St.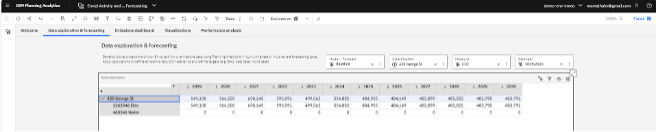
Click on the Base option in the menu bar to access the sandbox creation menu.
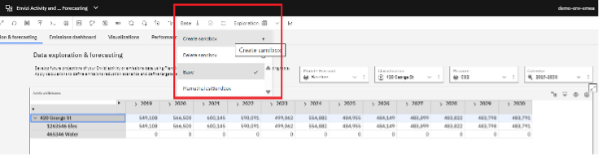
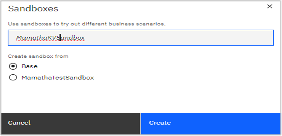
Provide a name for your sandbox in the designated field.
Select Create Sandbox from Base as shown in the options menu.
Click the Create button to finalize the sandbox creation.
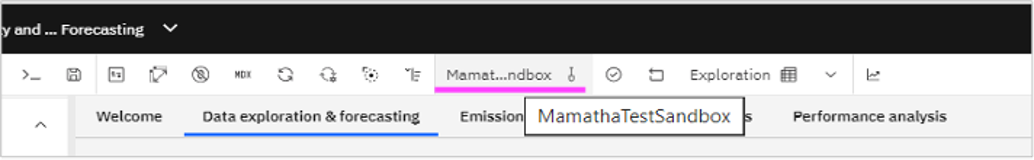
Verify the sandbox by checking the menu bar, where your sandbox name should now be displayed, as highlighted in the following example.
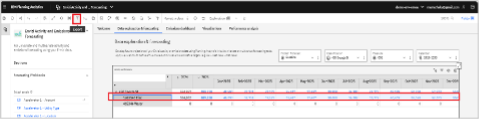
7. Univariate forecasting with AI
Let’s explore the AI-assisted forecasting functionality in Planning Analytics. You can generate univariate forecasts on actual data using Planning Analytics. For this example, we’ll use a dataset with actuals loaded up to June 2024. Planning Analytics uses artificial intelligence to analyze trends, seasonality, and other factors, then applies the most suitable mathematical forecasting model.
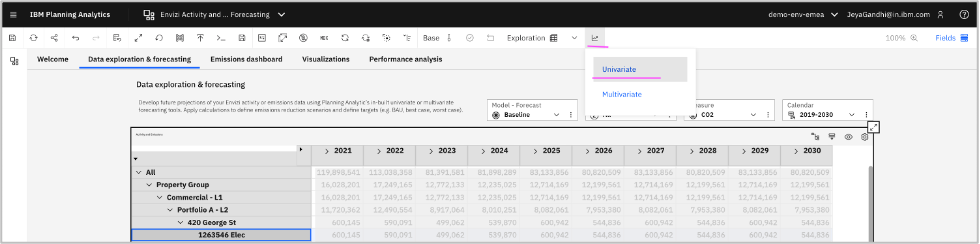
From the exploration grid, select the
1263546 Elec Account.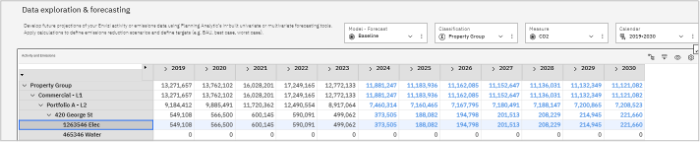
If needed, reset forecasted values for the years 2025–2030 to
0for the Electricity account.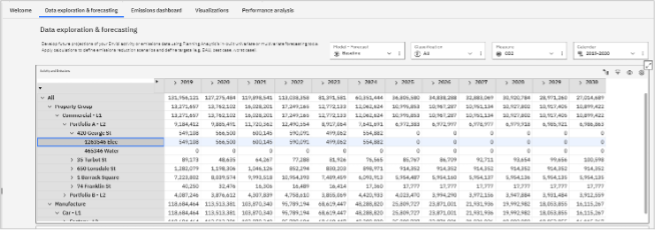
Navigate to Forecast in the menu and select Univariate Forecast.
Set up the forecast parameters:
- Forecast Period Start: Jul-2024
Forecast Period End: Dec-2030
Advanced options:
Seasonality Auto Detect: On
- Use Historical Data in the TM1 Cube: On
- Confidence Interval: 95%
- Adjust Outliers: On
- Ignore Historical Time Periods: None selected
Spread Forecast Values: Relative proportional (Seasonality)
Where to save predicted values:
Dimension: Model - Forecast
- Hierarchy: Model - Forecast
Member: Baseline
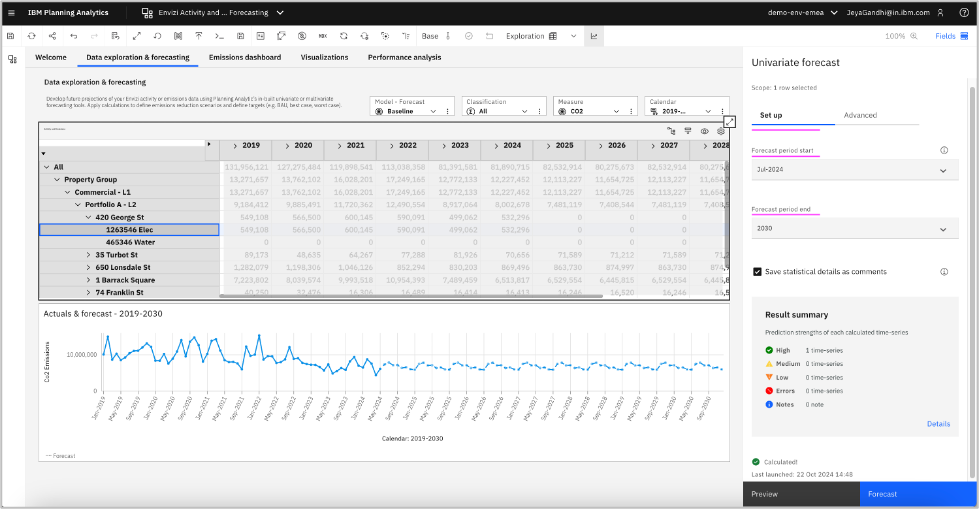
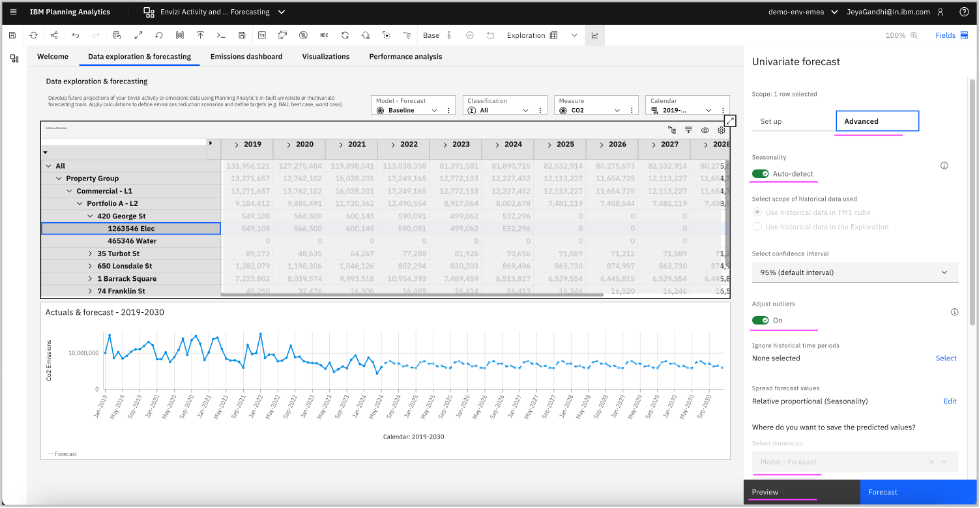
Select Preview to review the calculated forecast visually. The chart will display trends and seasonality patterns in the data.
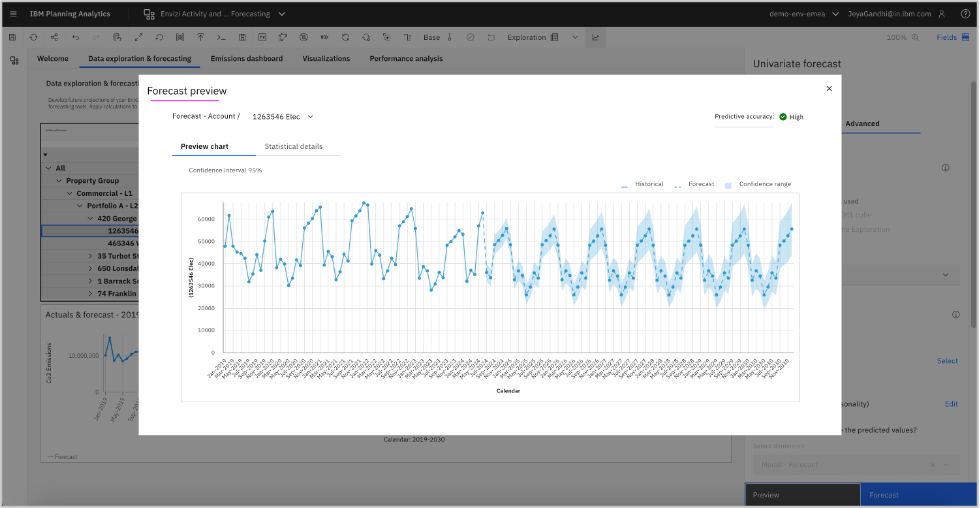
You can also review the statistical and mathematical details of the forecast by selecting Statistical Details.
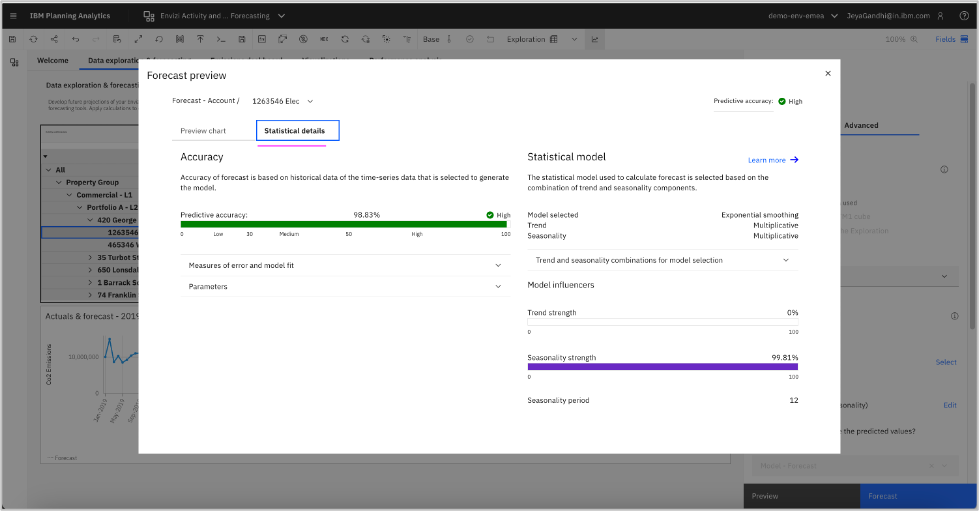
Once satisfied with the forecast, close the preview.
Select Forecast to calculate and save the forecast to the Planning Analytics database (this step is valid even if a forecast already exists for the selected account).

A confirmation popup will appear. Click Continue.
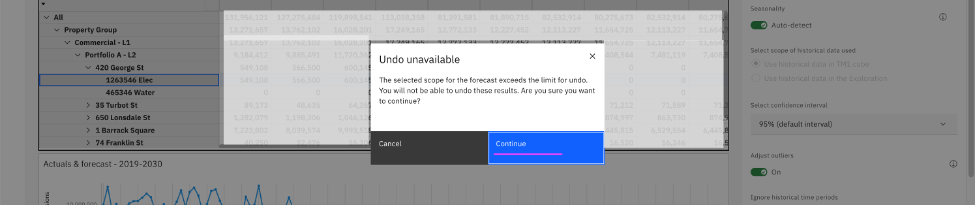
Review the forecasted values for the years 2025–2030 to ensure accuracy, as highlighted in the results.
8. Setting targets
Let’s adjust a forecast to set a basic target.
Scenario
As a Sustainability Manager, I aim to set specific emission reduction targets for office locations or sites, then re-import these targets into Envizi to monitor performance.
Performance calculation and data spreading
Planning Analytics offers:
- Various calculations for enhanced analysis.
- Data spreading capabilities to apply calculations across multiple cells.
- Text-based commands for quick data spreading calculations.
Objective
Set a target for 2024 by:
- Reducing emissions by 5% for the first half of the year (H1).
- Applying an additional 5% reduction for the second half (H2).
Then, apply a 5% reduction for 2025 values as the forecast baseline.
Steps to set the targets
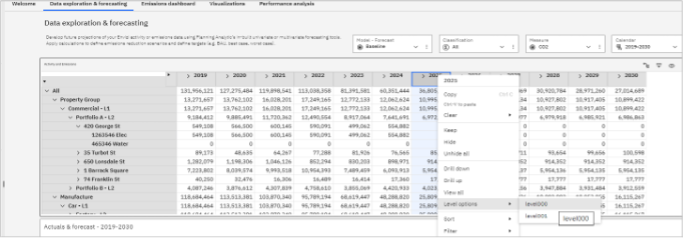
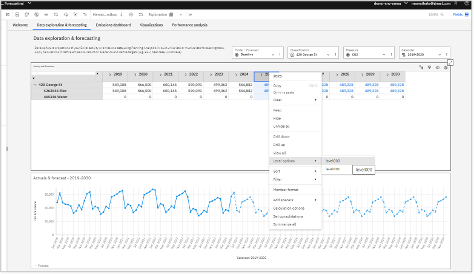
Step 1: Open the monthly view for 2025 forecast
Navigate to the 2025 column.
Right-click and select Level Options > Level000 to view the monthly breakdown.
Step 2: Spread data for 5% reduction in 2025
Right-click on the first cell for 2025-01-01 in the grid.
From the context menu, select Spread Data Options.
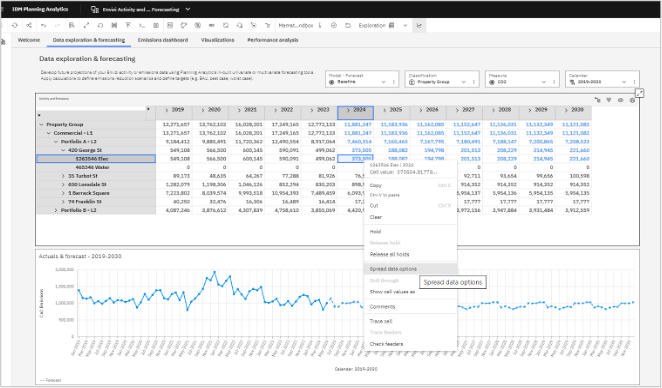
Step 3: Configure percent change
In the Spread Data dialog:
- Select Percent Change from the left-hand options.
- Enter 5 in the text field.
- Select Subtract as the update action.
- Choose Right and Down as the direction.
Click the Apply button to execute the change.
Adjust filters for specific locations
Update the filter to display data for 420 George St:
Select the column for 2025 on the top row.
Right-click and choose Level Options > Level000 to see the updated monthly values.
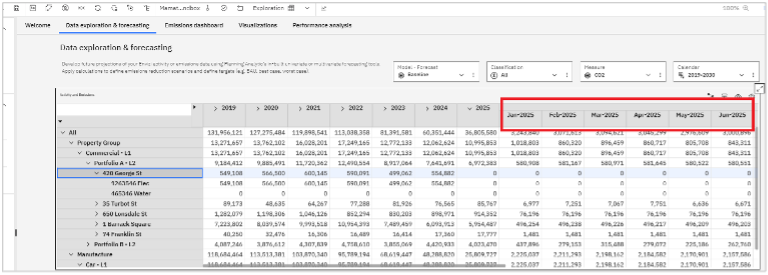
Step 4: Review and verify
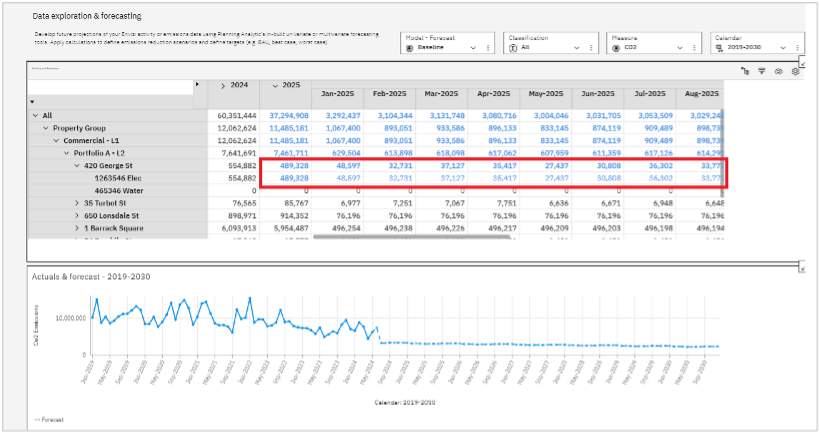
Check the updated grid to confirm that the 2025 forecasted values have been reduced appropriately.
The monthly forecast values for 420 George St should reflect the 5% reduction target for each month.
9. Exporting targets from PA to Envizi
Once you’ve developed your targets in Planning Analytics (PA), the next step is to populate them into Envizi as fixed targets.
Steps to export emissions targets
Use filters to narrow down the data to a specific location, such as 420 George St.
Ensure the relevant data for the desired location and time frame (e.g., 2025 values) is displayed on the exploration grid.
Highlight the rows or records in the grid that contain the target values you wish to export.
Click on the Export icon located in the menu bar.
If you are using the exploration grid to manually transfer data, copy the 2025 values directly into an Excel sheet.
10. Load populated targets template
Loading target data into Envizi involves uploading the pre-filled template with the targets you’ve created in Planning Analytics (PA).
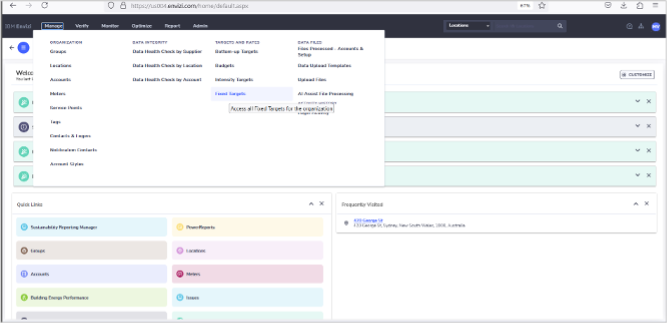
Launch Envizi in a new browser tab.
From the Main Menu, go to Manage > Targets and Rates > Fixed Targets.
Select the option to Upload the populated emissions targets data.
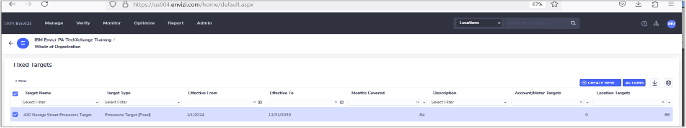
Locate and select the target name, e.g., 420 George Street Emissions Target, from the list.
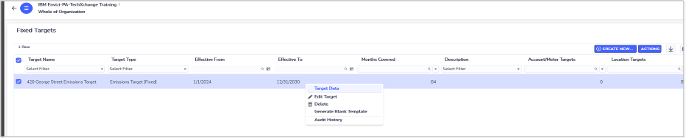
Right-click the target name 420 George Street Emissions Target.
Select Target Data to open the detailed view.
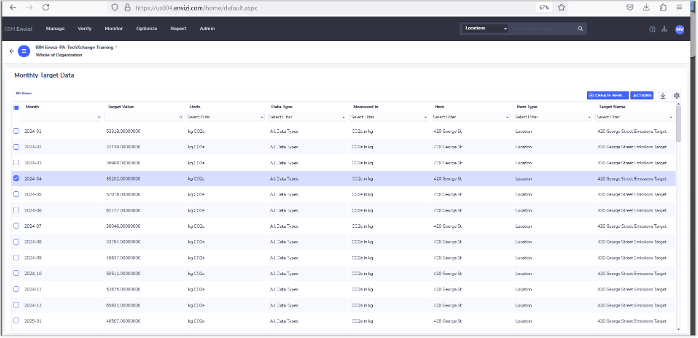
Review the monthly target data created in Envizi. You should see the target data populated from 2024 to 2030, based on the data exported from PA.
11. Viewing targets in reports
Now let’s view the targets for 420 George St in the context of Envizi reports.
In the Search bar, type Reports and enter 420 George.
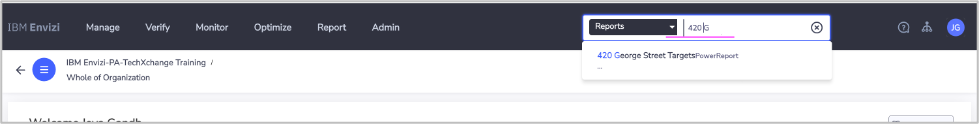
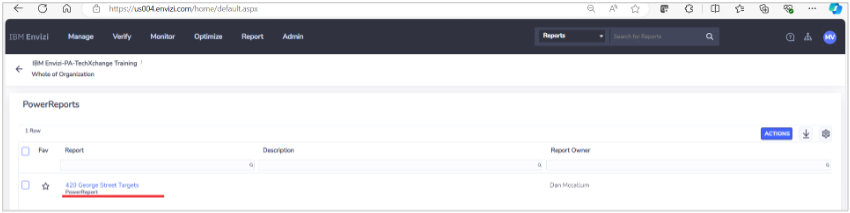
Click on the 420 George Street Targets PowerBI Report to open the detailed view.
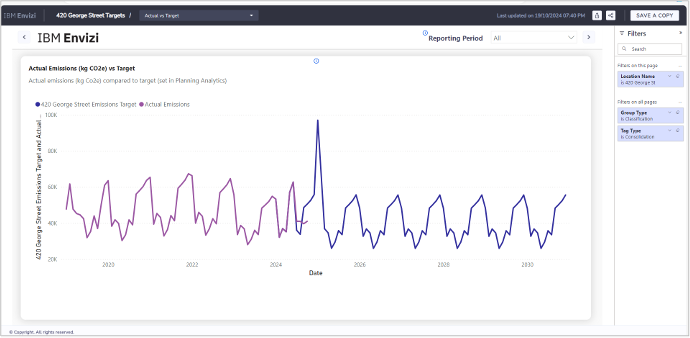
Understanding the report
Emissions and targets: The purple line on the chart represents the actual emissions data that is captured and managed in Envizi. The blue line represents the forecasted values created in Planning Analytics (PA), which are now configured as targets in Envizi.
Benefits of integration
Tracking progress:
- As the target now resides in Envizi, users can track actual emissions against the set targets over time.
- This allows for real-time insights to determine if the organization is on track to meet its goals.
Remodeling and updating targets:
- Targets can be reviewed and adjusted in PA at any time, for example, due to changes in business operations.
- Once updated, the target values in Envizi can be refreshed to reflect the new goals.
This seamless integration between PA and Envizi ensures that sustainability targets remain dynamic and actionable.
Conclusion and next steps
In this tutorial, we explored how the Envizi Add-On integrates with IBM Planning Analytics (PA) to create a seamless solution for informed carbon reduction target planning. You learned how to:
- Leverage data export from PA and ingest it into Envizi.
- Develop indicative forecasts.
- Utilize user-driven values and linear regression models to predict future performance trends effectively.
This integration allows organizations to set data-driven sustainability goals by combining Envizi’s ESG data management capabilities with Planning Analytics' advanced scenario modeling and forecasting.
The Add-On capability provides partners and customers with a robust foundation to build custom solutions tailored to specific planning requirements, enabling flexibility and scalability beyond general market needs.
To get more information about IBM Envizi or to try it out yourself, start your 14-day IBM Envizi ESG Suite trial. You can also request a personalized IBM Envizi demo.