About cookies on this site Our websites require some cookies to function properly (required). In addition, other cookies may be used with your consent to analyze site usage, improve the user experience and for advertising. For more information, please review your options. By visiting our website, you agree to our processing of information as described in IBM’sprivacy statement. To provide a smooth navigation, your cookie preferences will be shared across the IBM web domains listed here.
Tutorial
Managing emission data in travel and transportation with Envizi
Learn how to track, manage, and reduce emissions in the travel and transportation sector
On this page
This tutorial explores how IBM Envizi ESG Suite helps the Travel and Transportation industry manage sustainability data effectively.
The transportation sector is a major contributor to global greenhouse gas emissions. Over the past decade, governments and businesses have worked together to develop more sustainable infrastructure for transporting people and goods.
Royal Horizon Travel has committed to achieving carbon neutrality by 2040.
Business needs
Royal Horizon Travel aims to:
- Improve visibility, tracking, and monitoring of ESG data
- Reduce manual efforts in data collection and processing
- Lower carbon emissions to meet net-zero targets
- Reduce fuel consumption and waste
- Ensure seamless reporting for regulatory compliance
Key stakeholders
- Executives: CEO, CFO, Chief Sustainability Officer, Chief Procurement Officer
- Operations and quality: VP/Director of Quality, Head of Operations
- IT leaders: CIO, CTO, IT Manager, IT Director
Solution overview
IBM Envizi simplifies the consolidation, analysis, and management of sustainability data. It helps organizations:
- Automate data collection and processing
- Track greenhouse gas emissions across operations, vendors, and contractors
- Generate reports aligned with regulations and standards
- Support decarbonization initiatives across the value chain
- Enable sustainability-led decision-making for CSOs
Business impact
- Centralized ESG tracking
- Reduced greenhouse gas emissions
- Simplified data capture and benchmarking
- Improved ESG reporting aligned with regulatory frameworks
Demonstration video
Watch the following demonstration video about the solution:
Video will open in new tab or window
Prerequisites
To follow this tutorial, ensure you have:
- Access to an Envizi instance
- System Administrator role
Account Style Wizardenabled
Steps
1. Data model
Royal Horizon Travel manages various sustainability data.
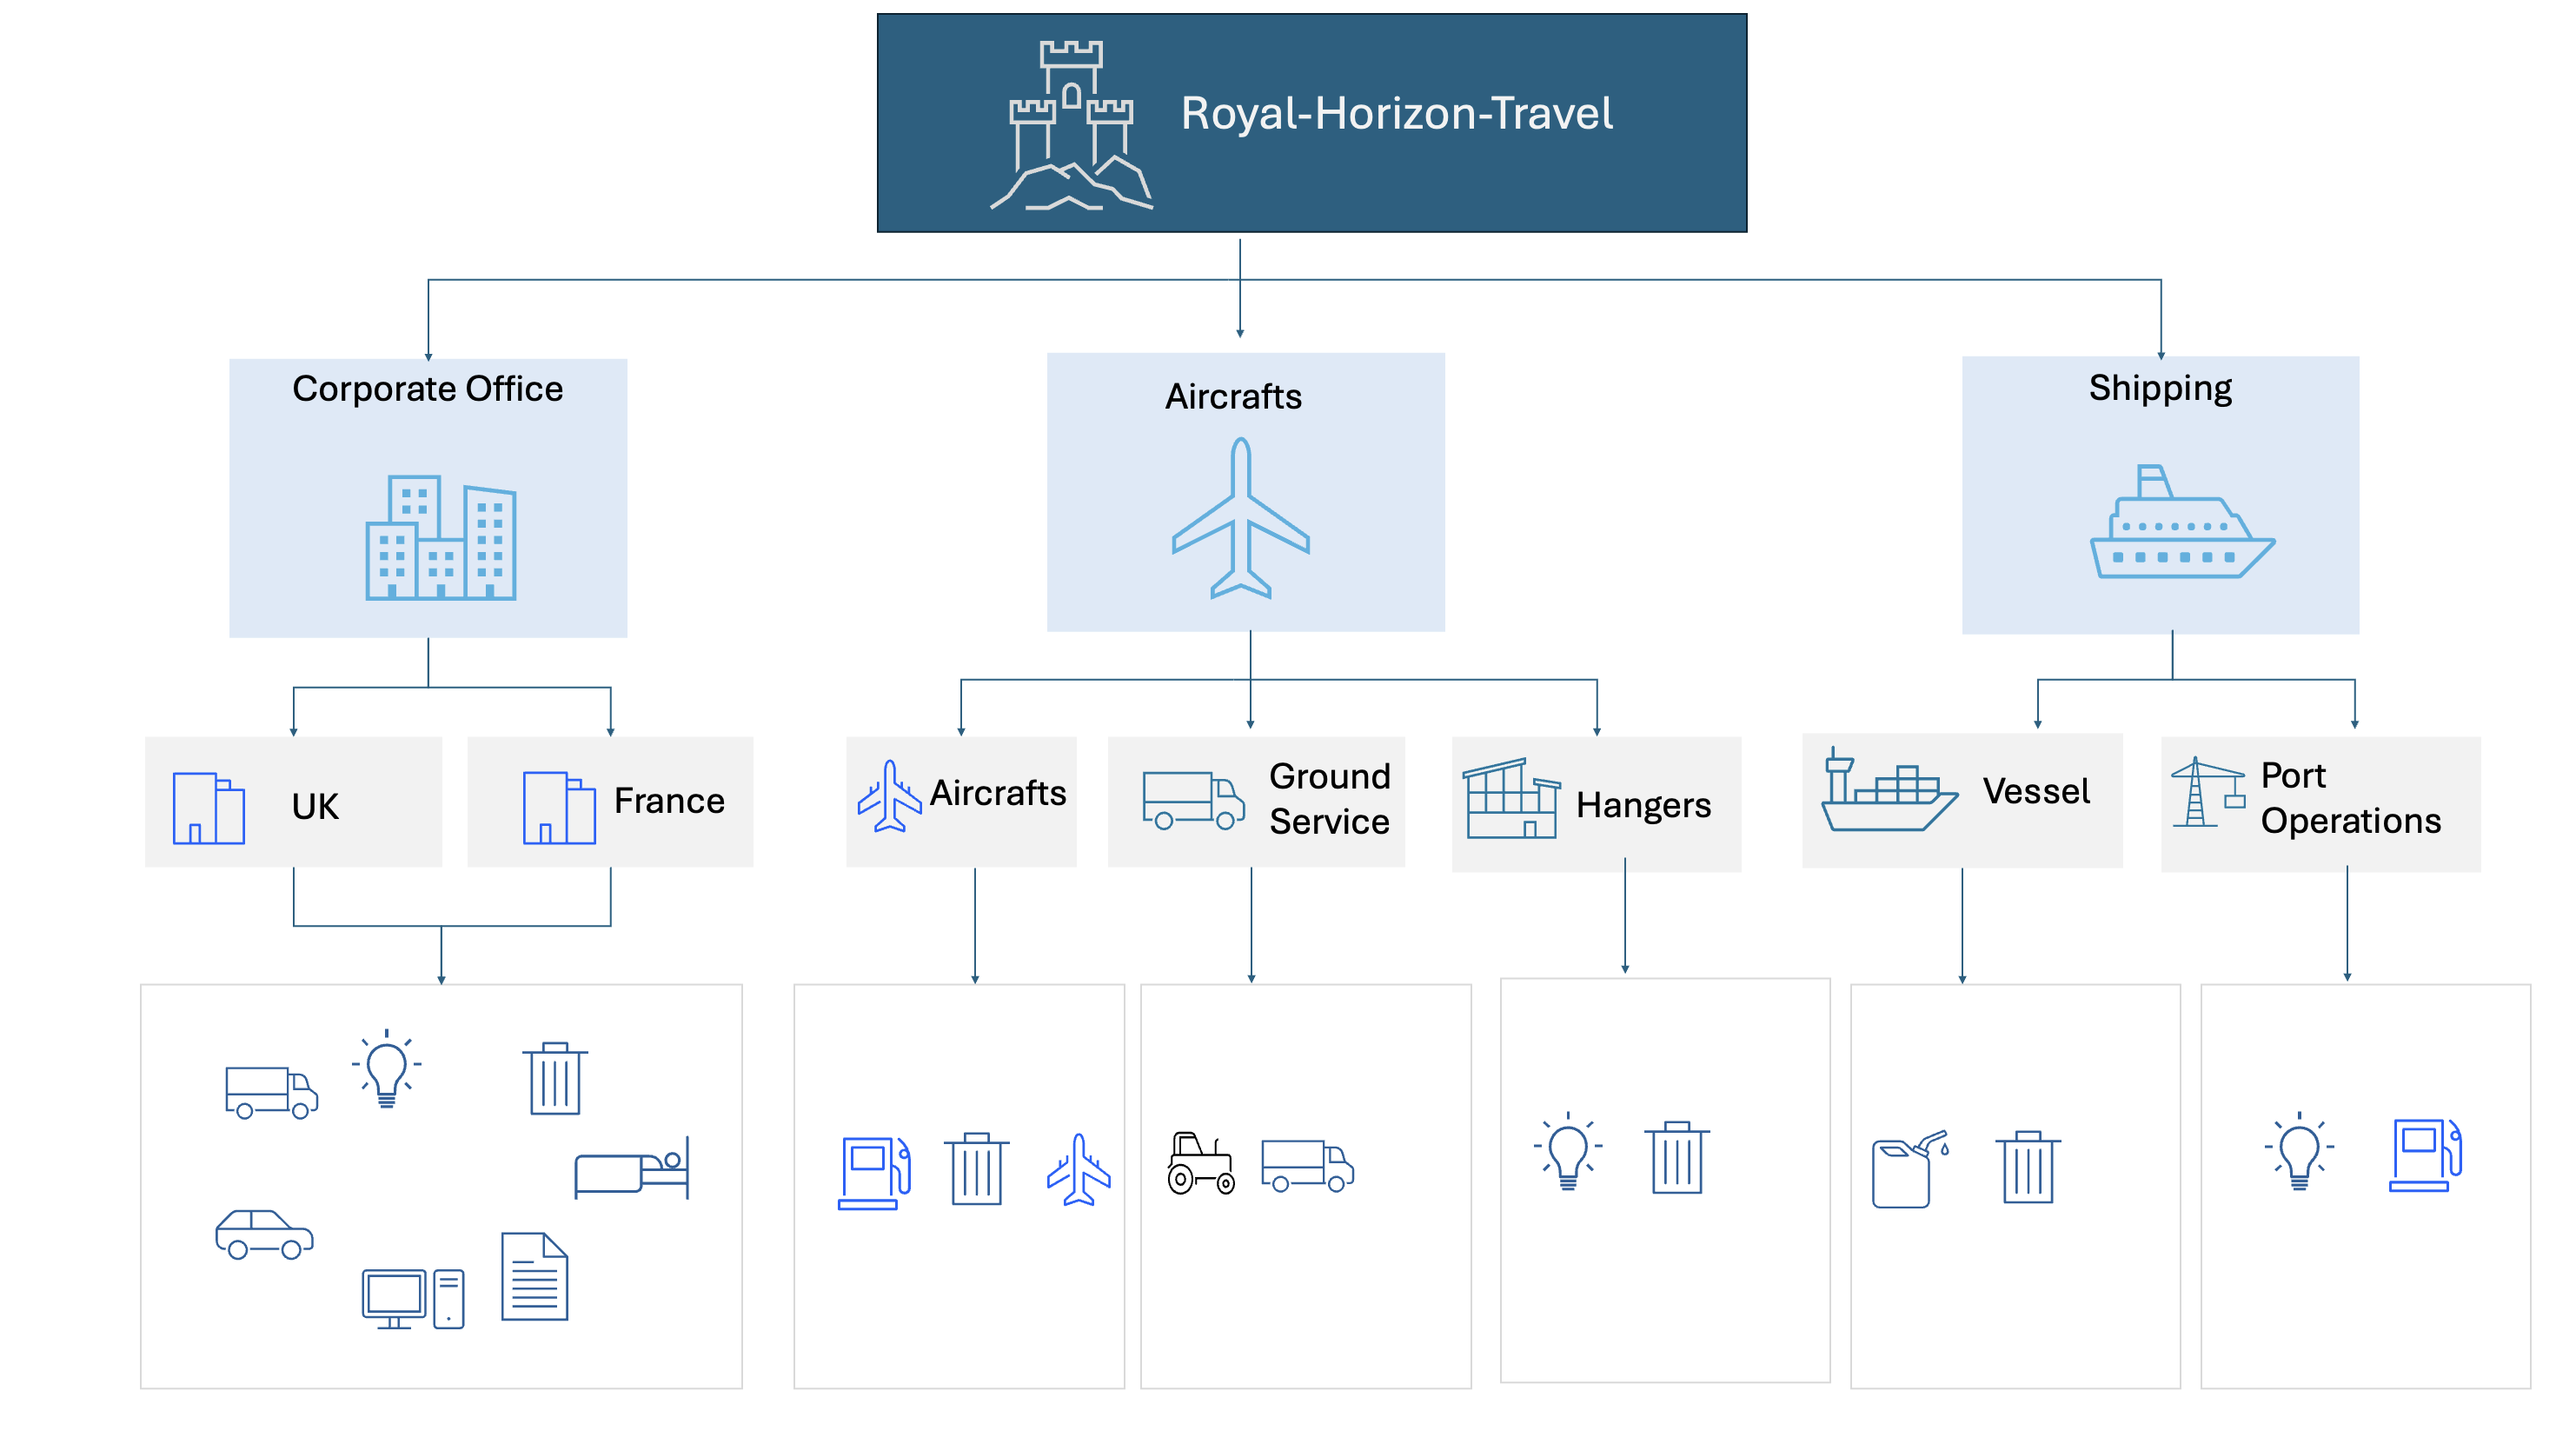
We will create a data model to structure this information.
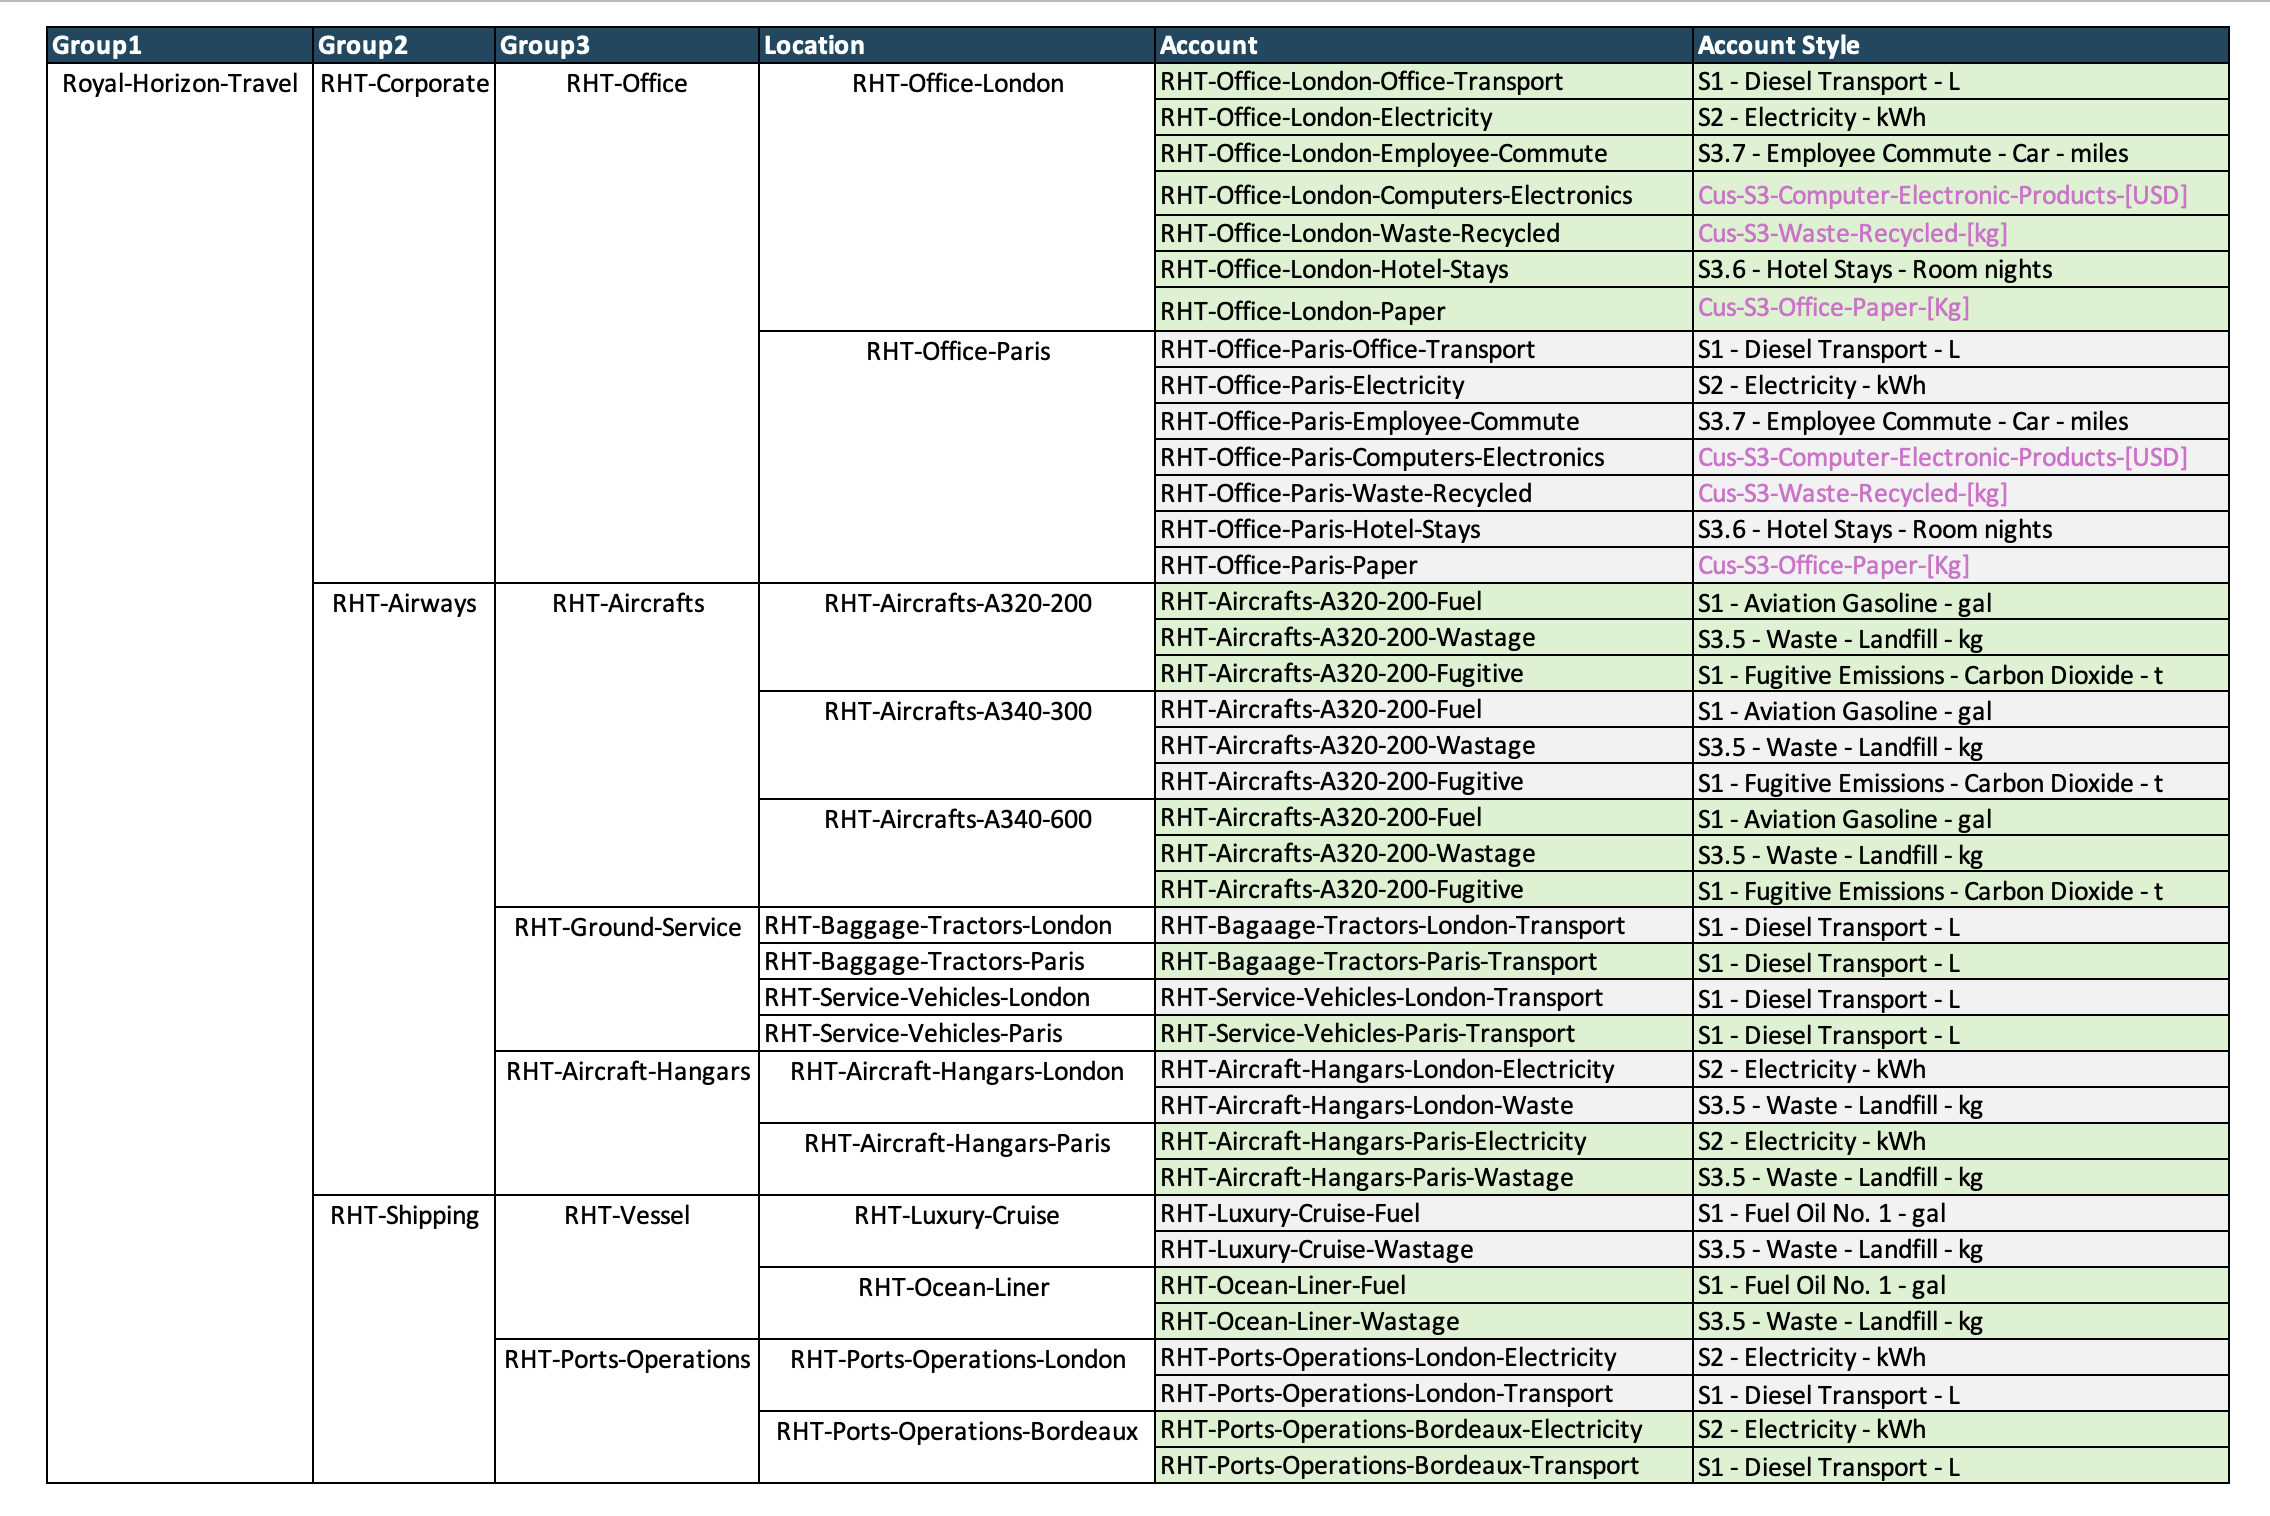
2. Creating account styles, groups, locations, accounts, and data
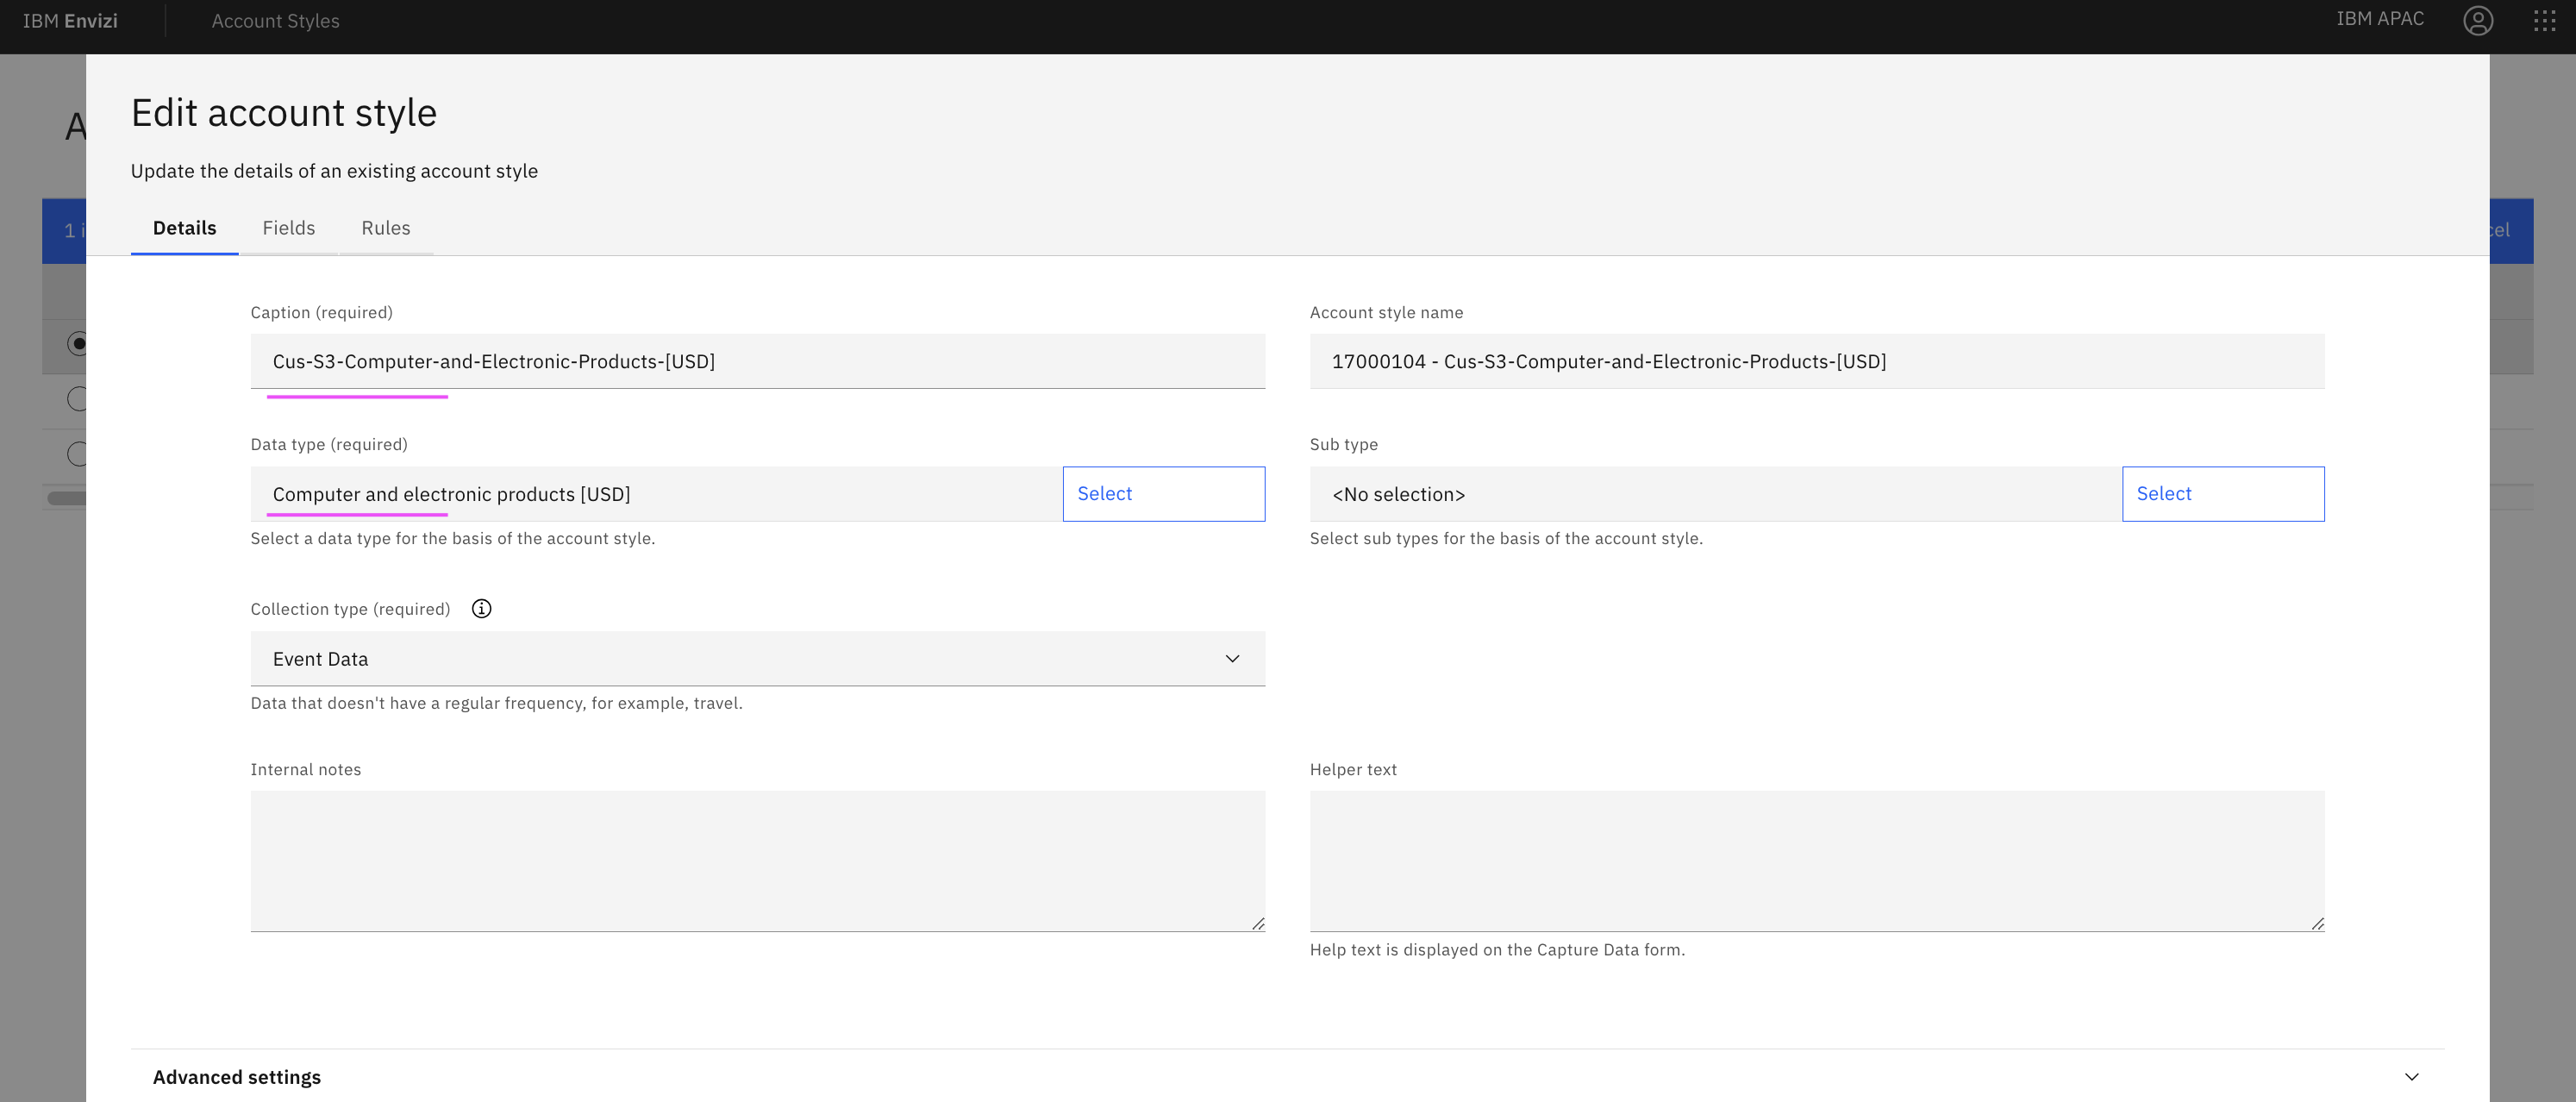
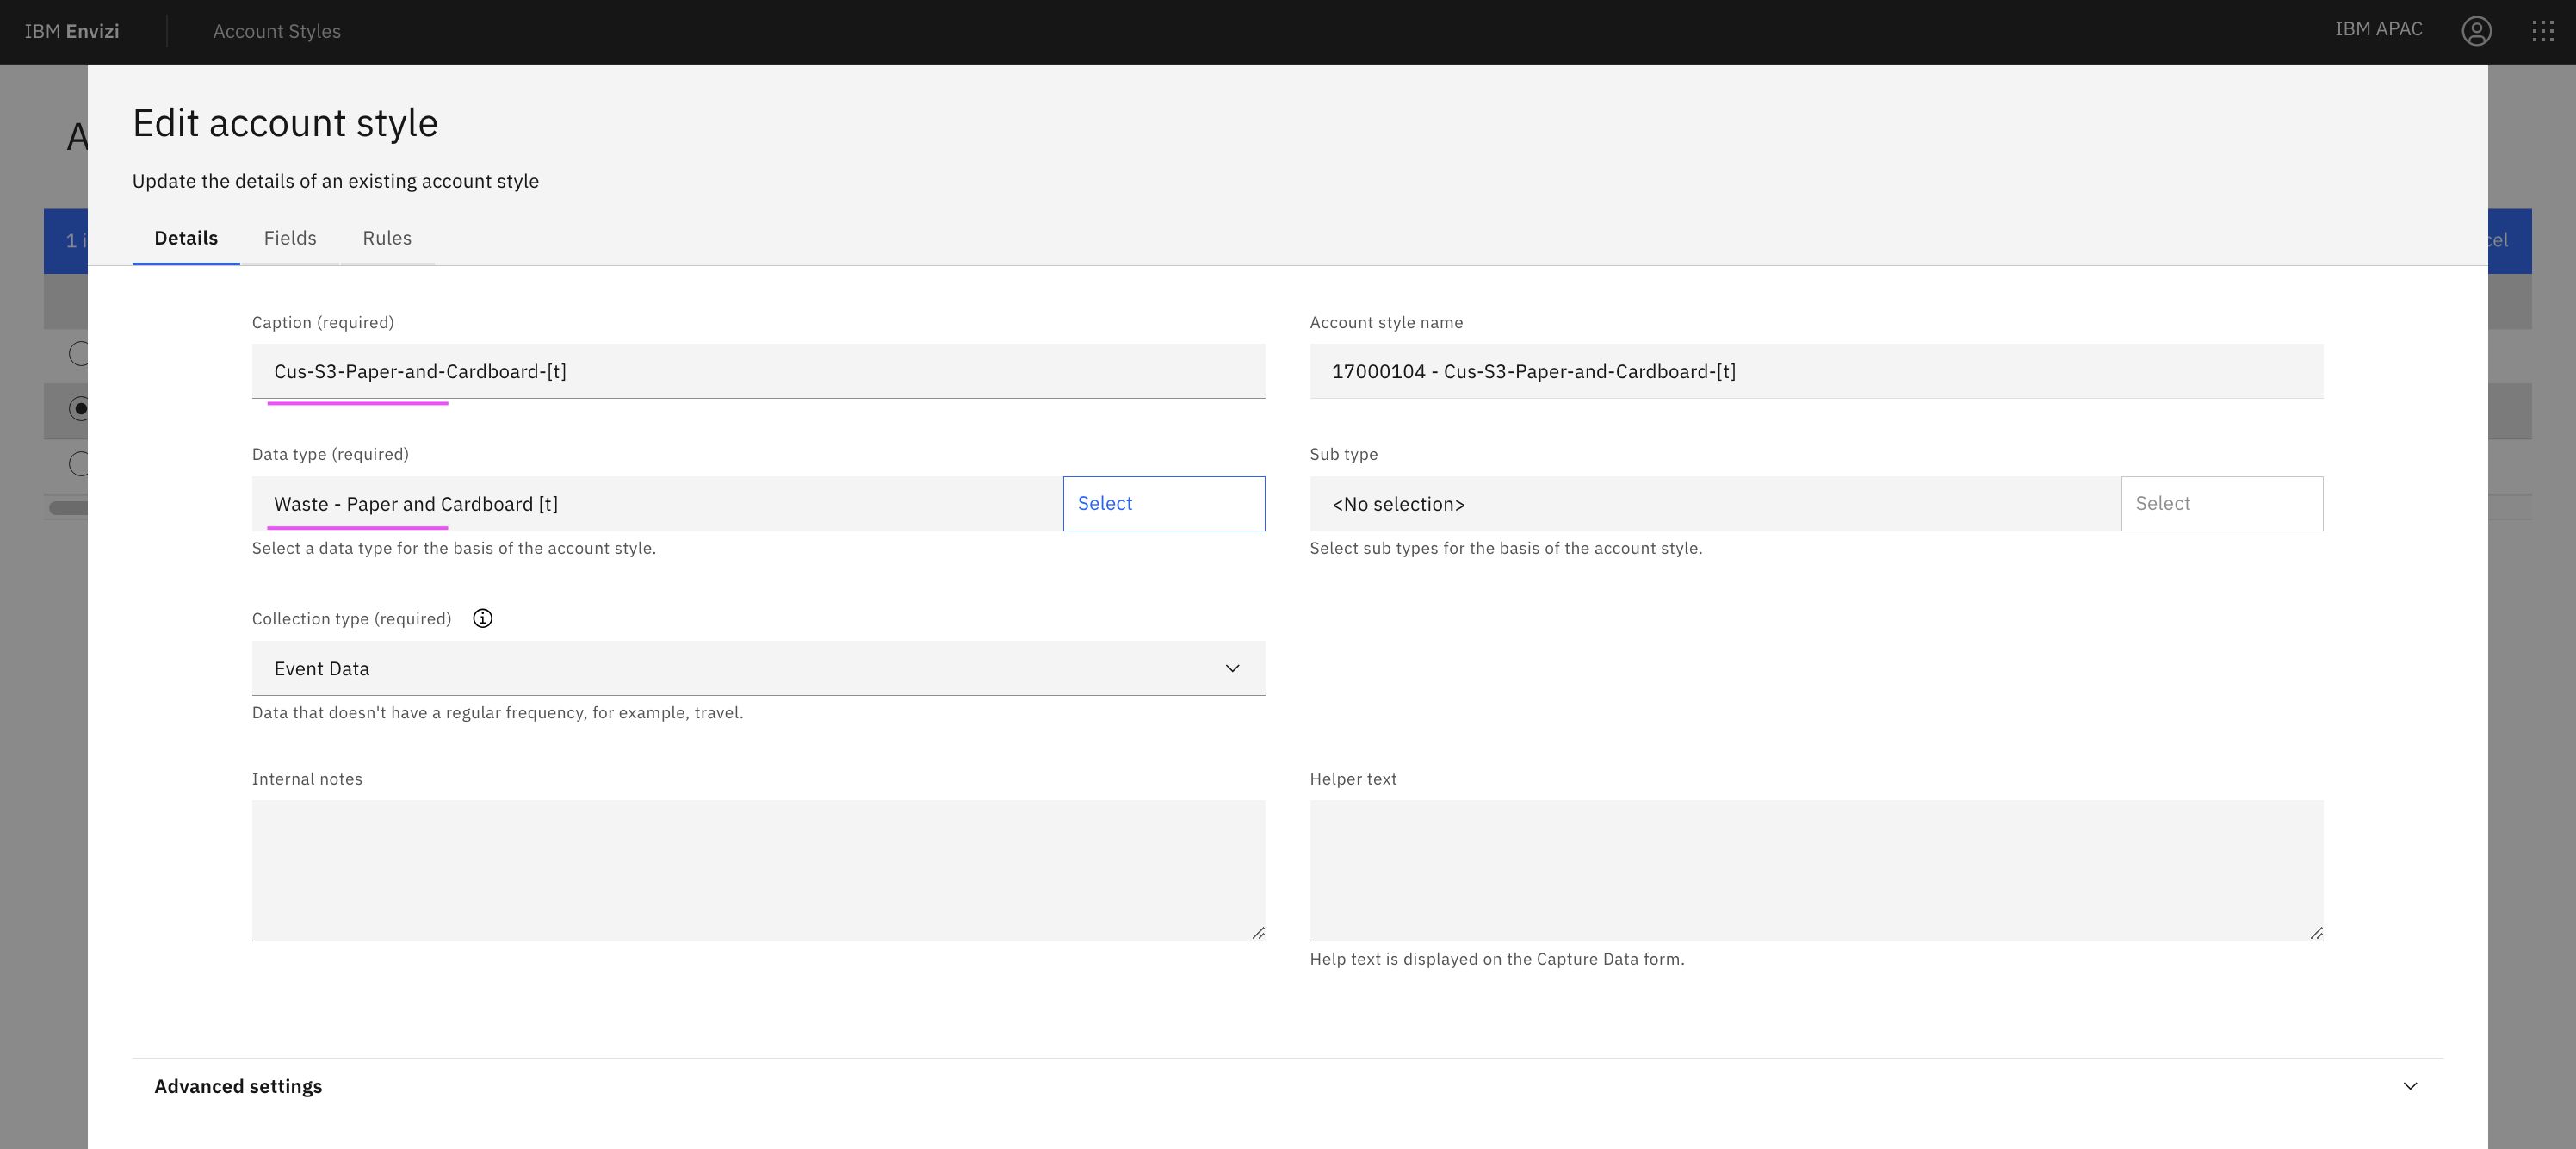
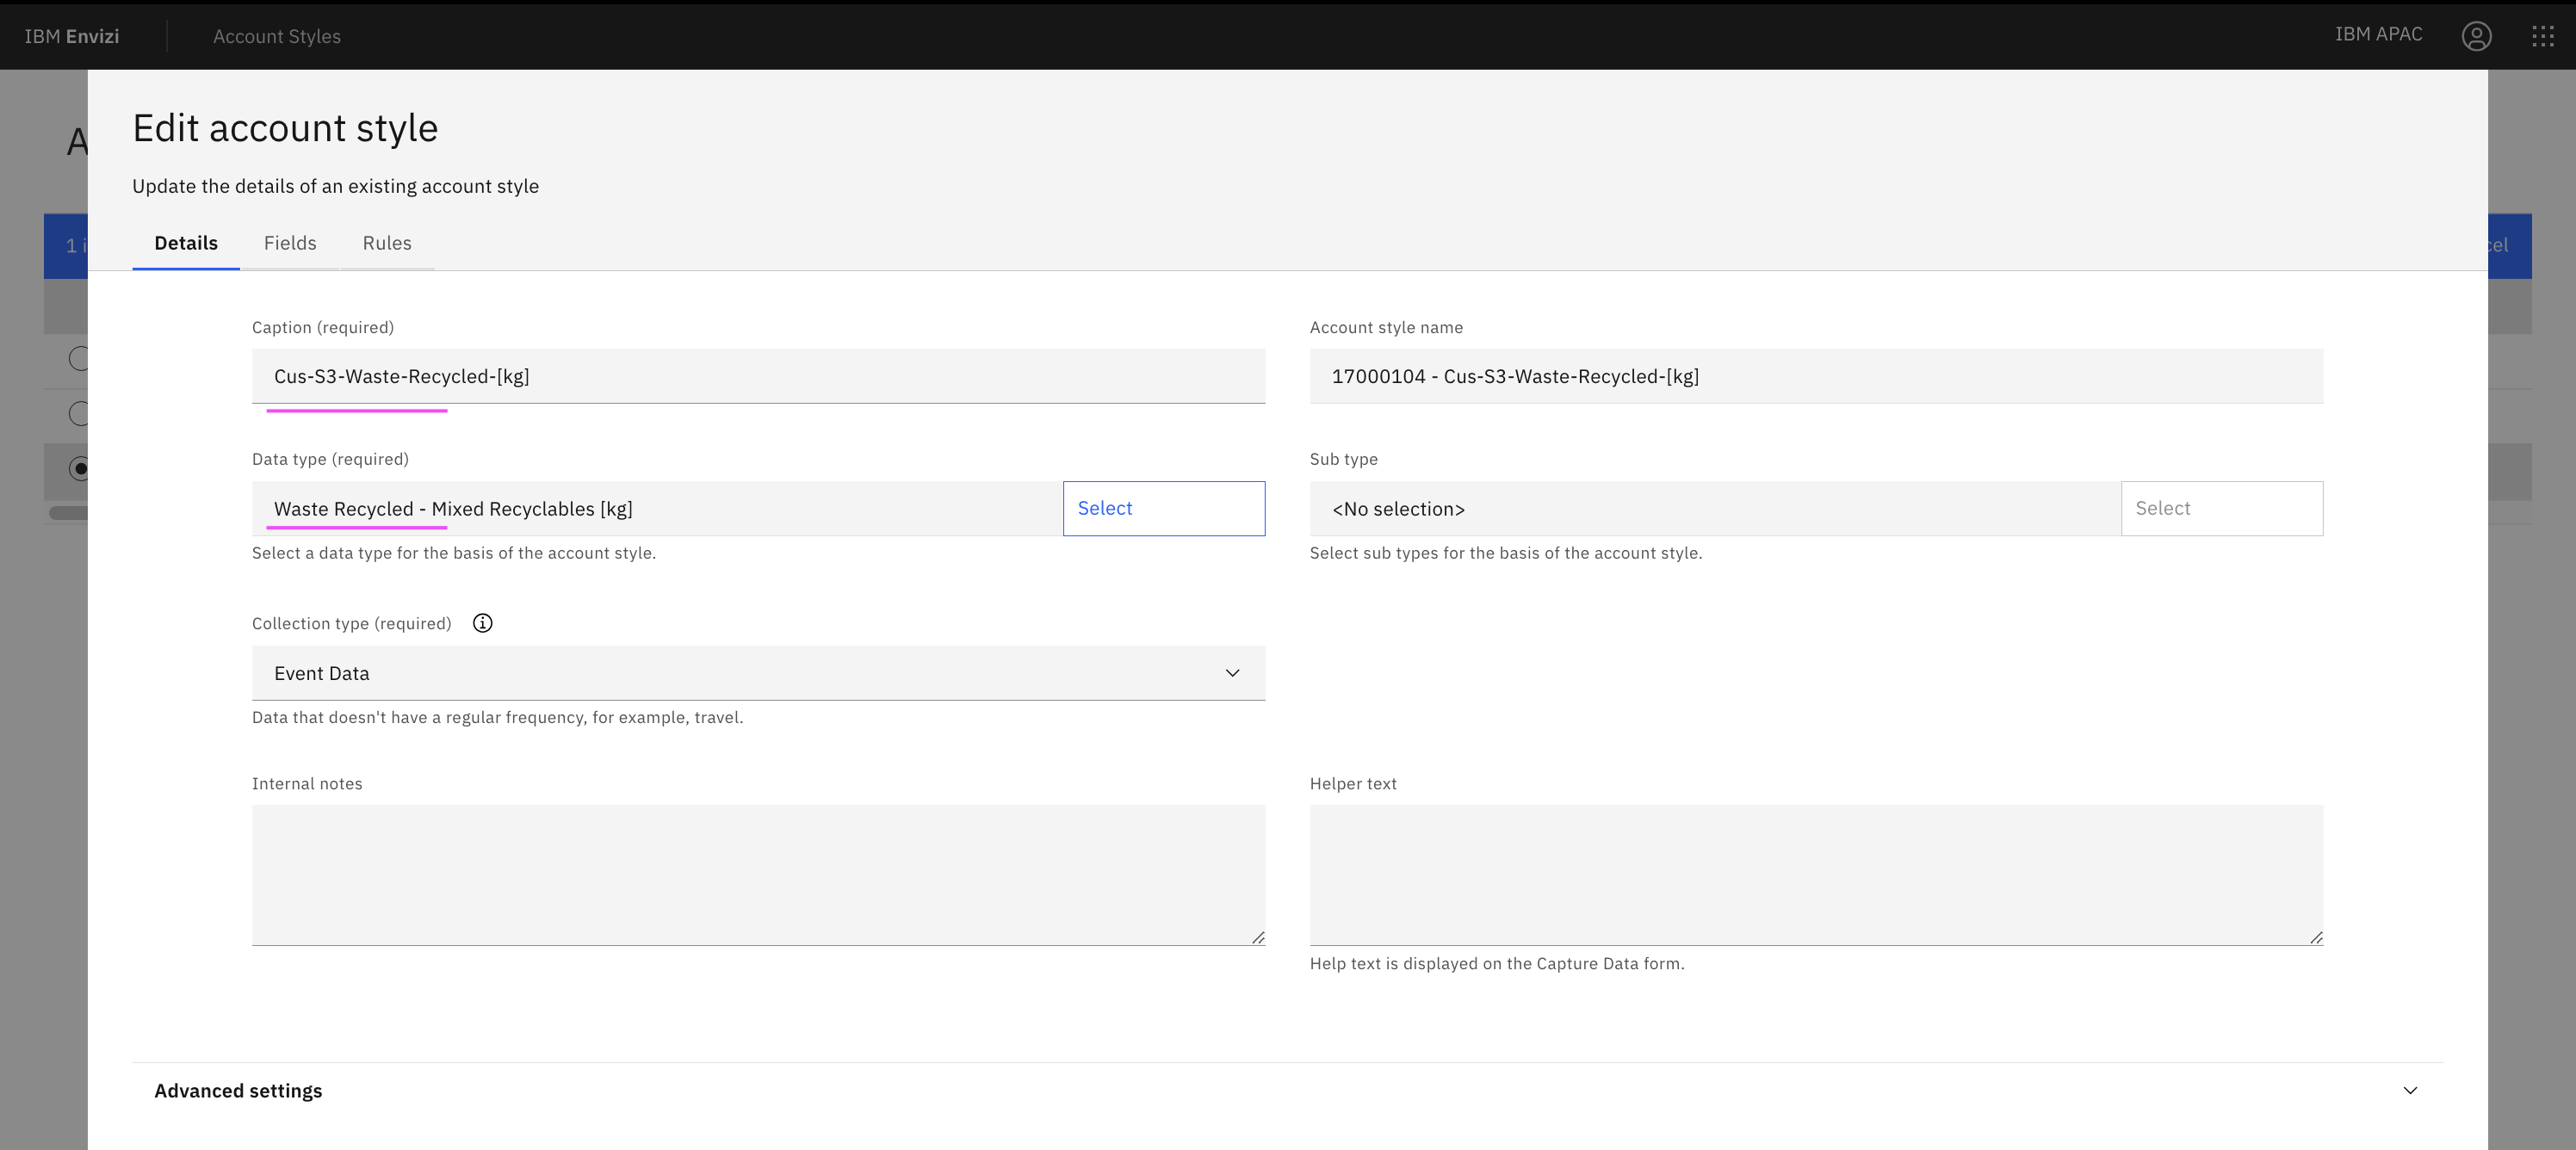
2.1 Create account styles
Envizi includes various account styles with different scopes and data types.
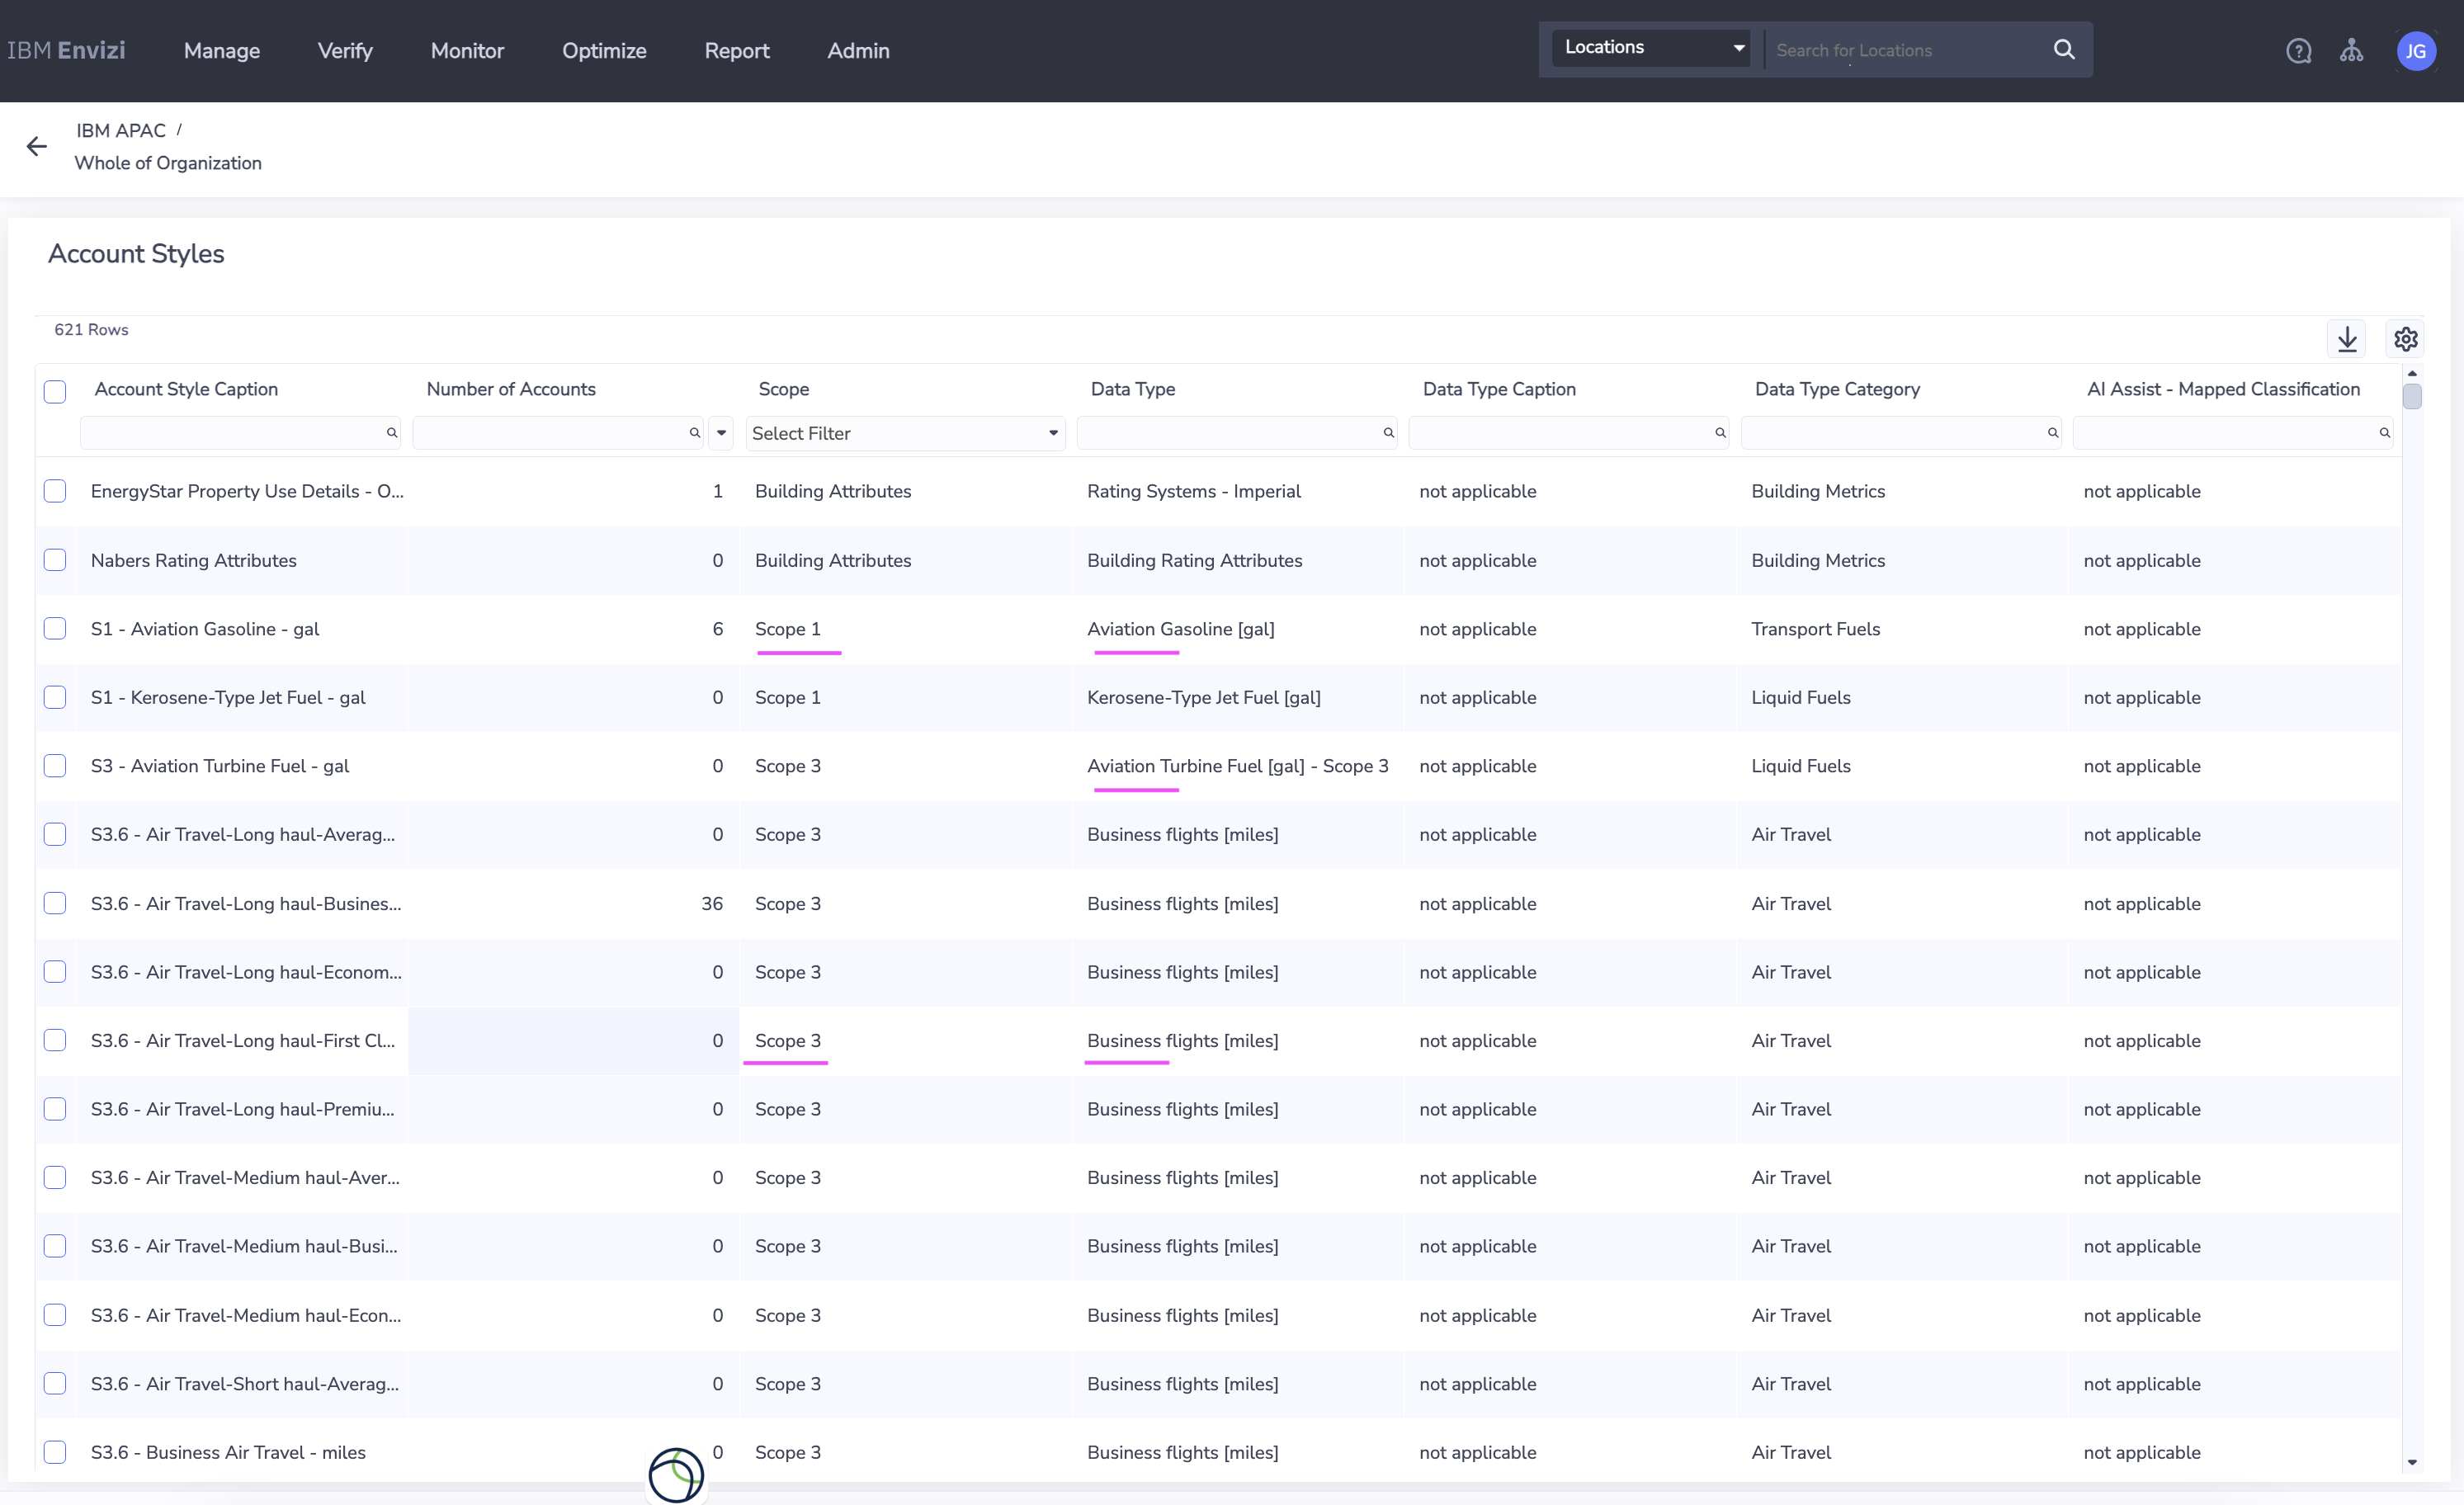
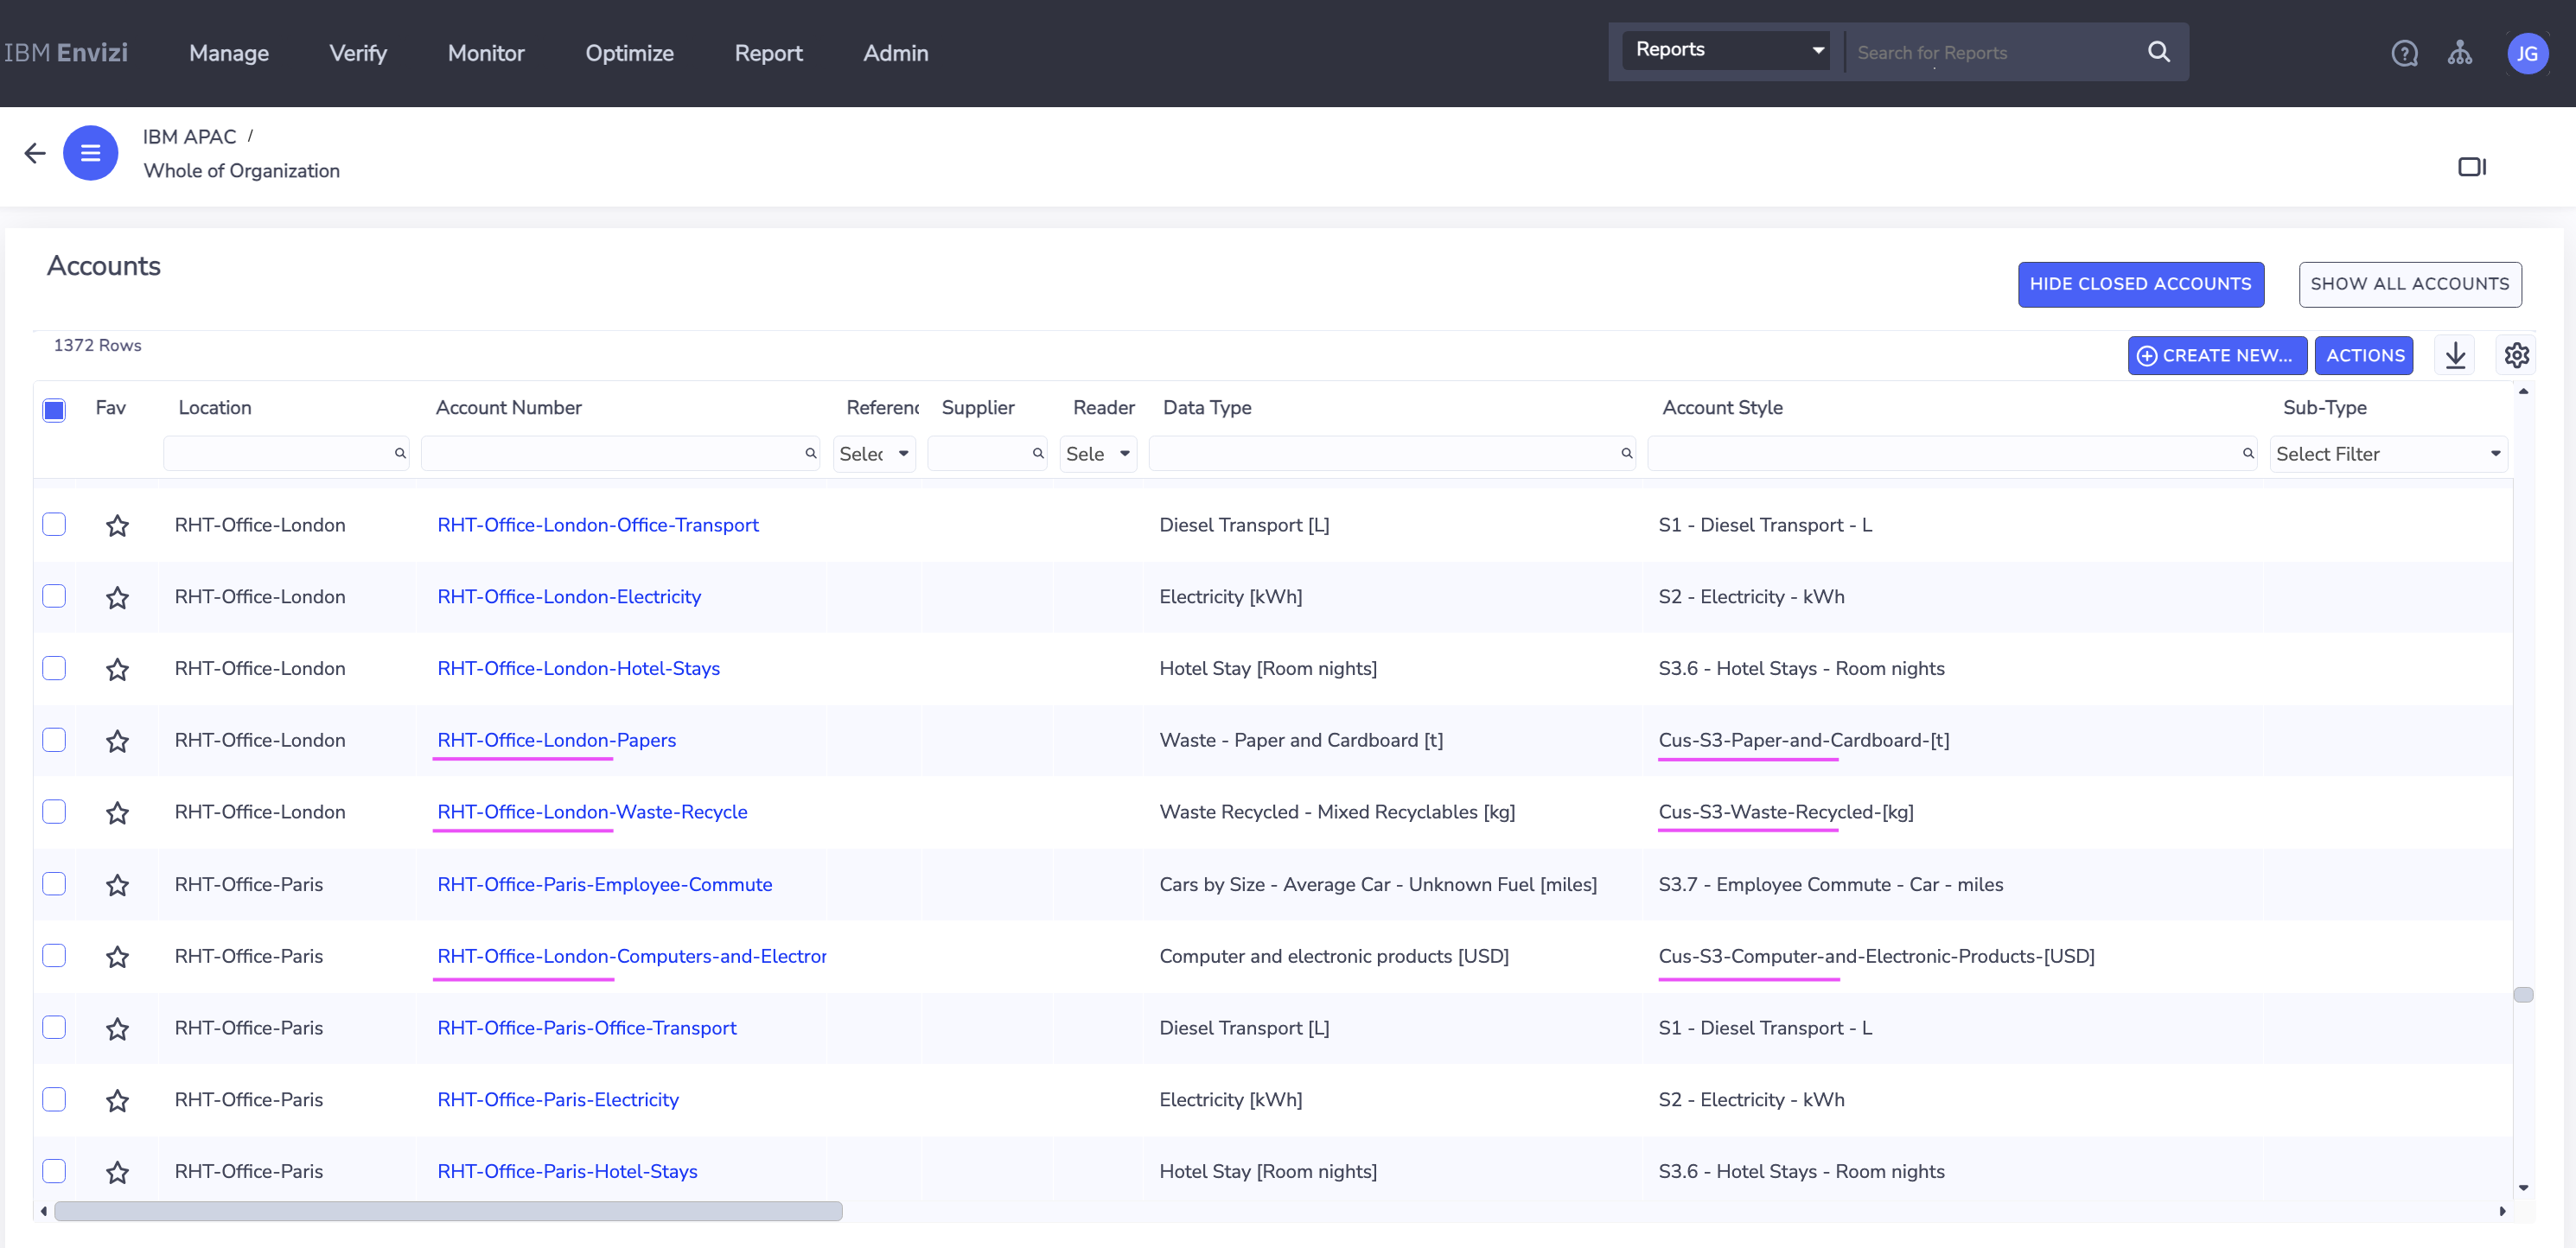
Create the following custom account styles:
- Cus-S3-Computer-and-Electronic-Products-[USD] – Computer and electronic products [USD]
- Cus-S3-Paper-and-Cardboard-[t] – Waste - Paper and Cardboard [t]
Cus-S3-Waste-Recycled-[kg] – Waste Recycled - Mixed Recyclables [kg]
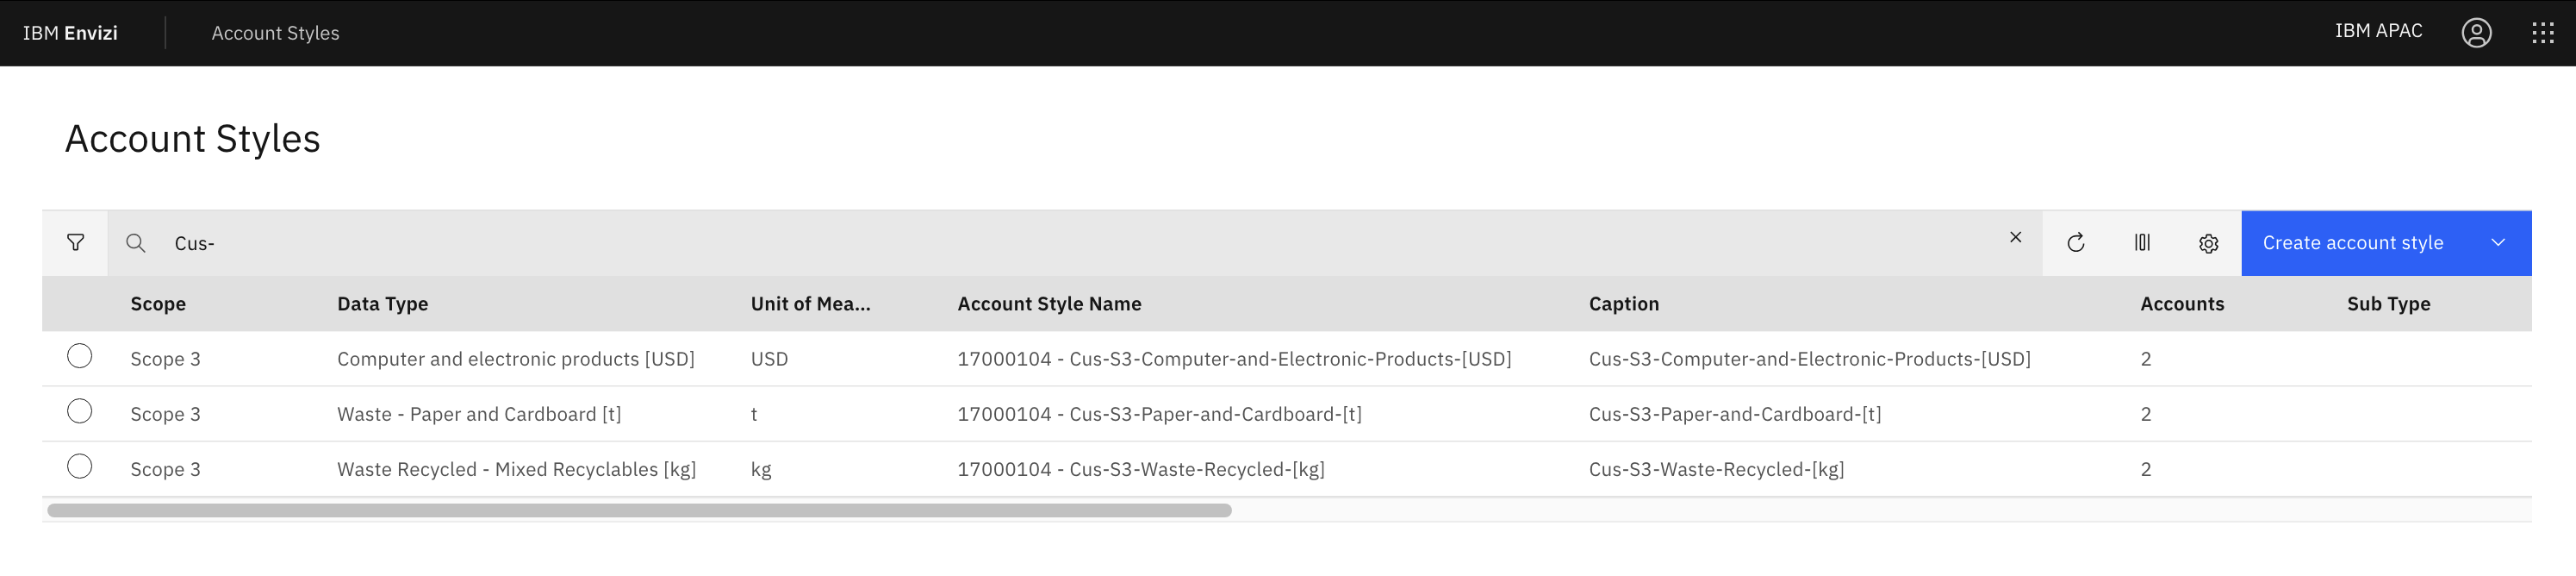
The account styles will be displayed as follows:
2.2 Create groups and locations
Update the Organization columns in Envizi_SetupConfig_RHT.xlsx based on your environment.
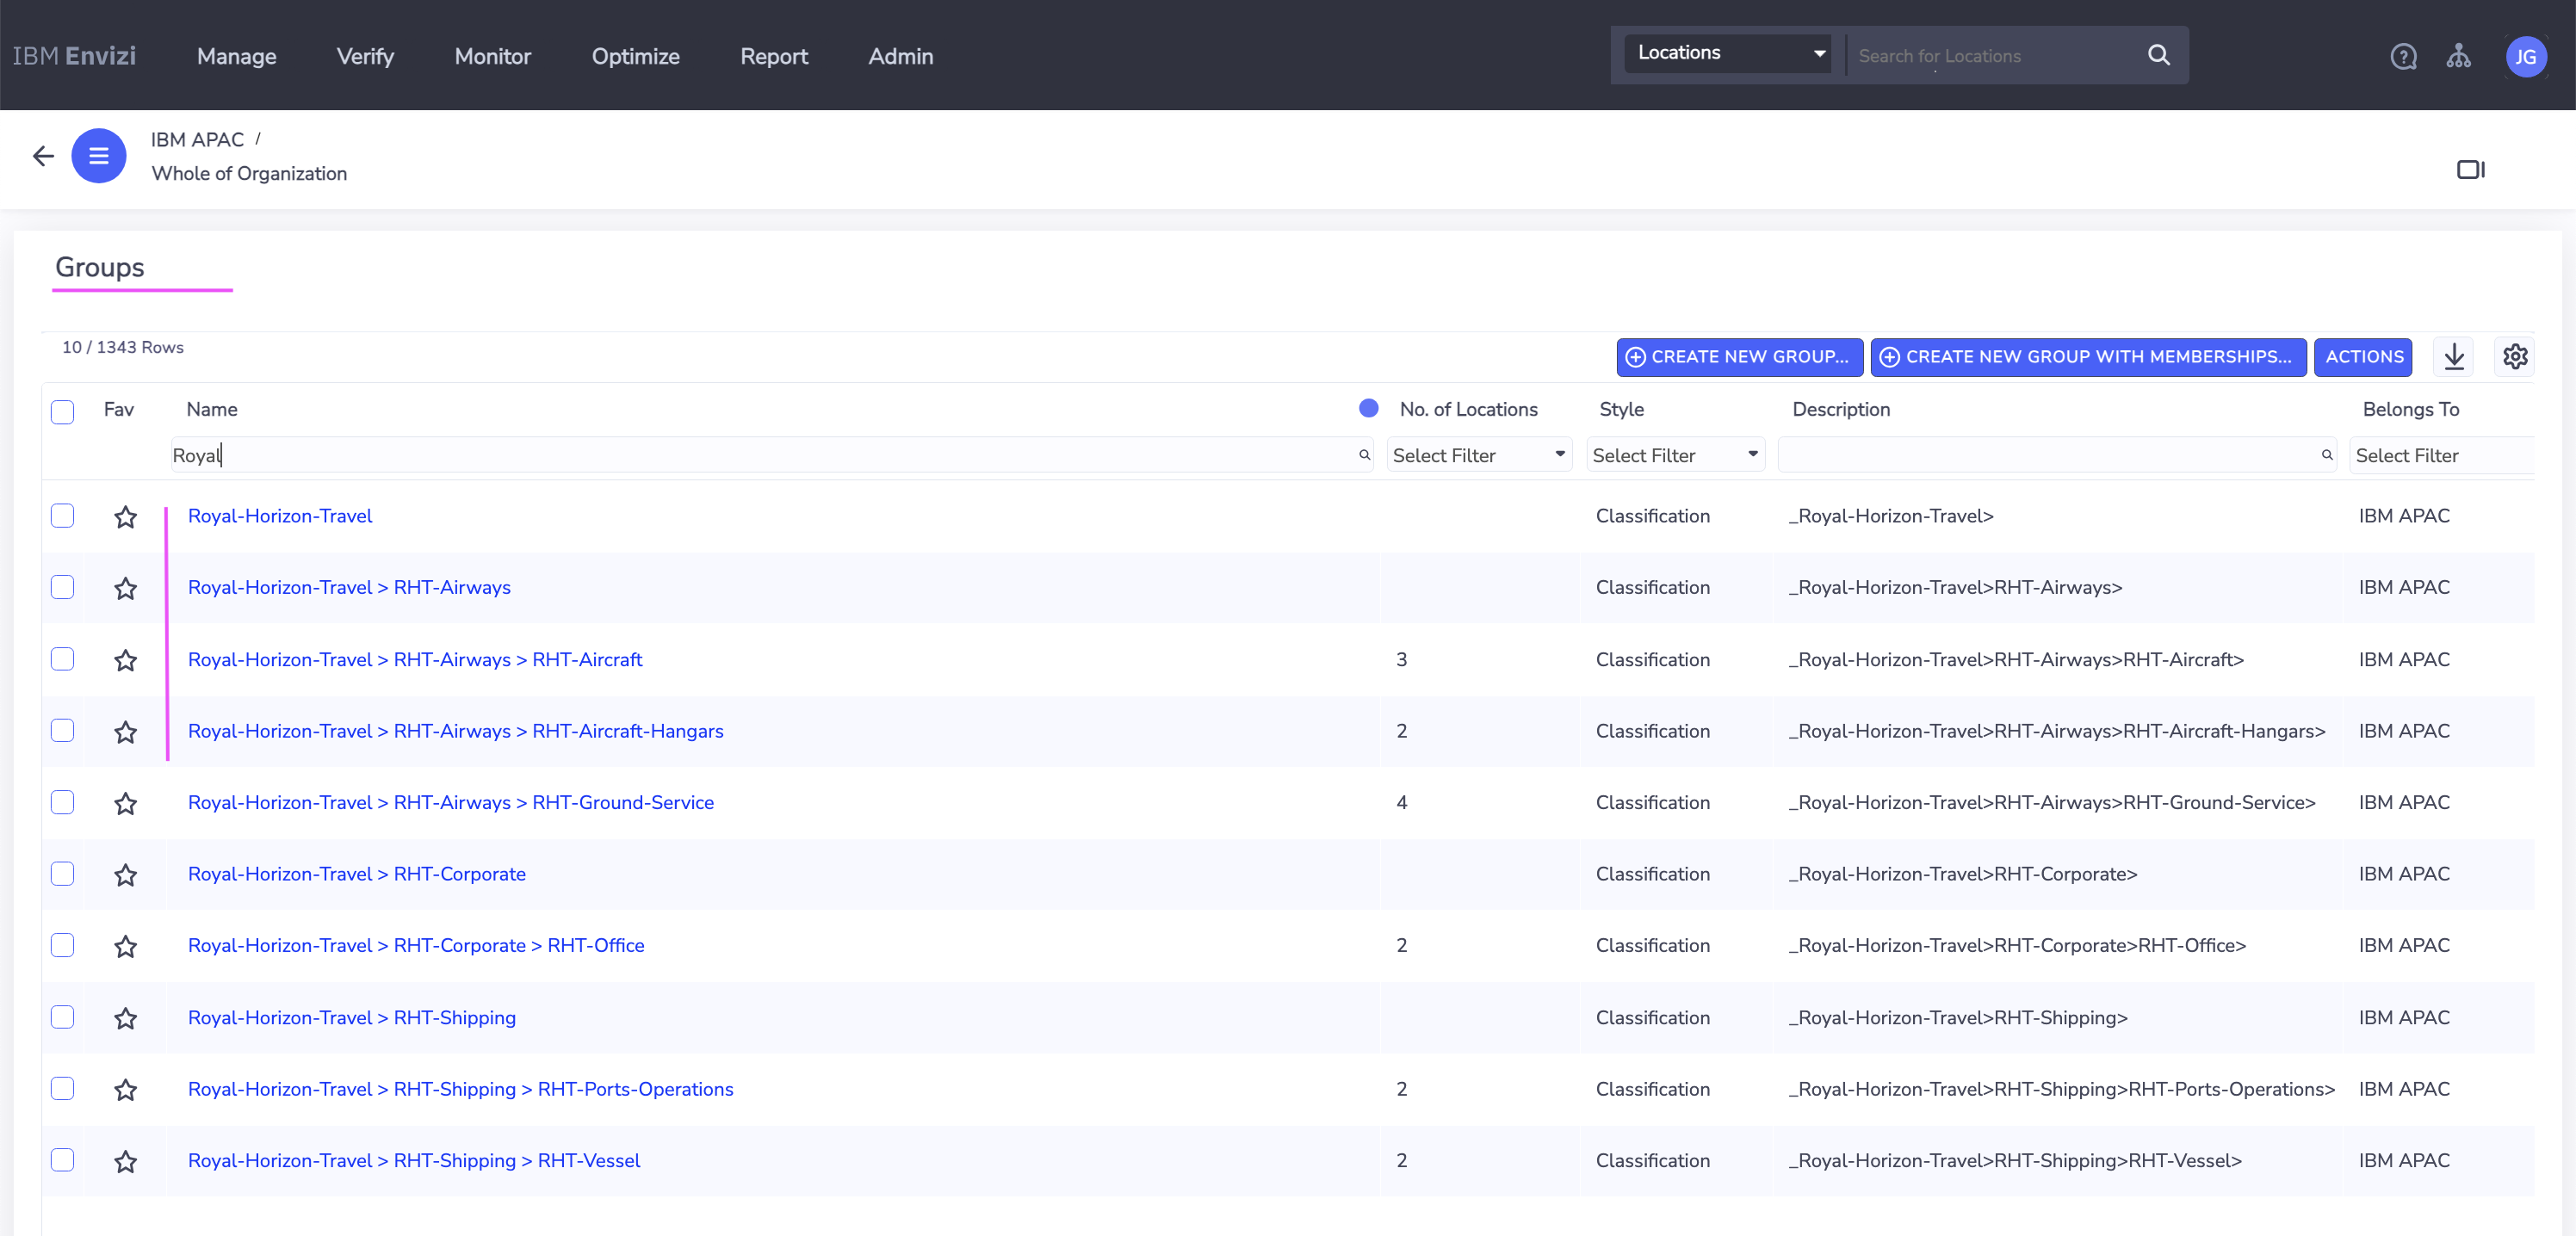
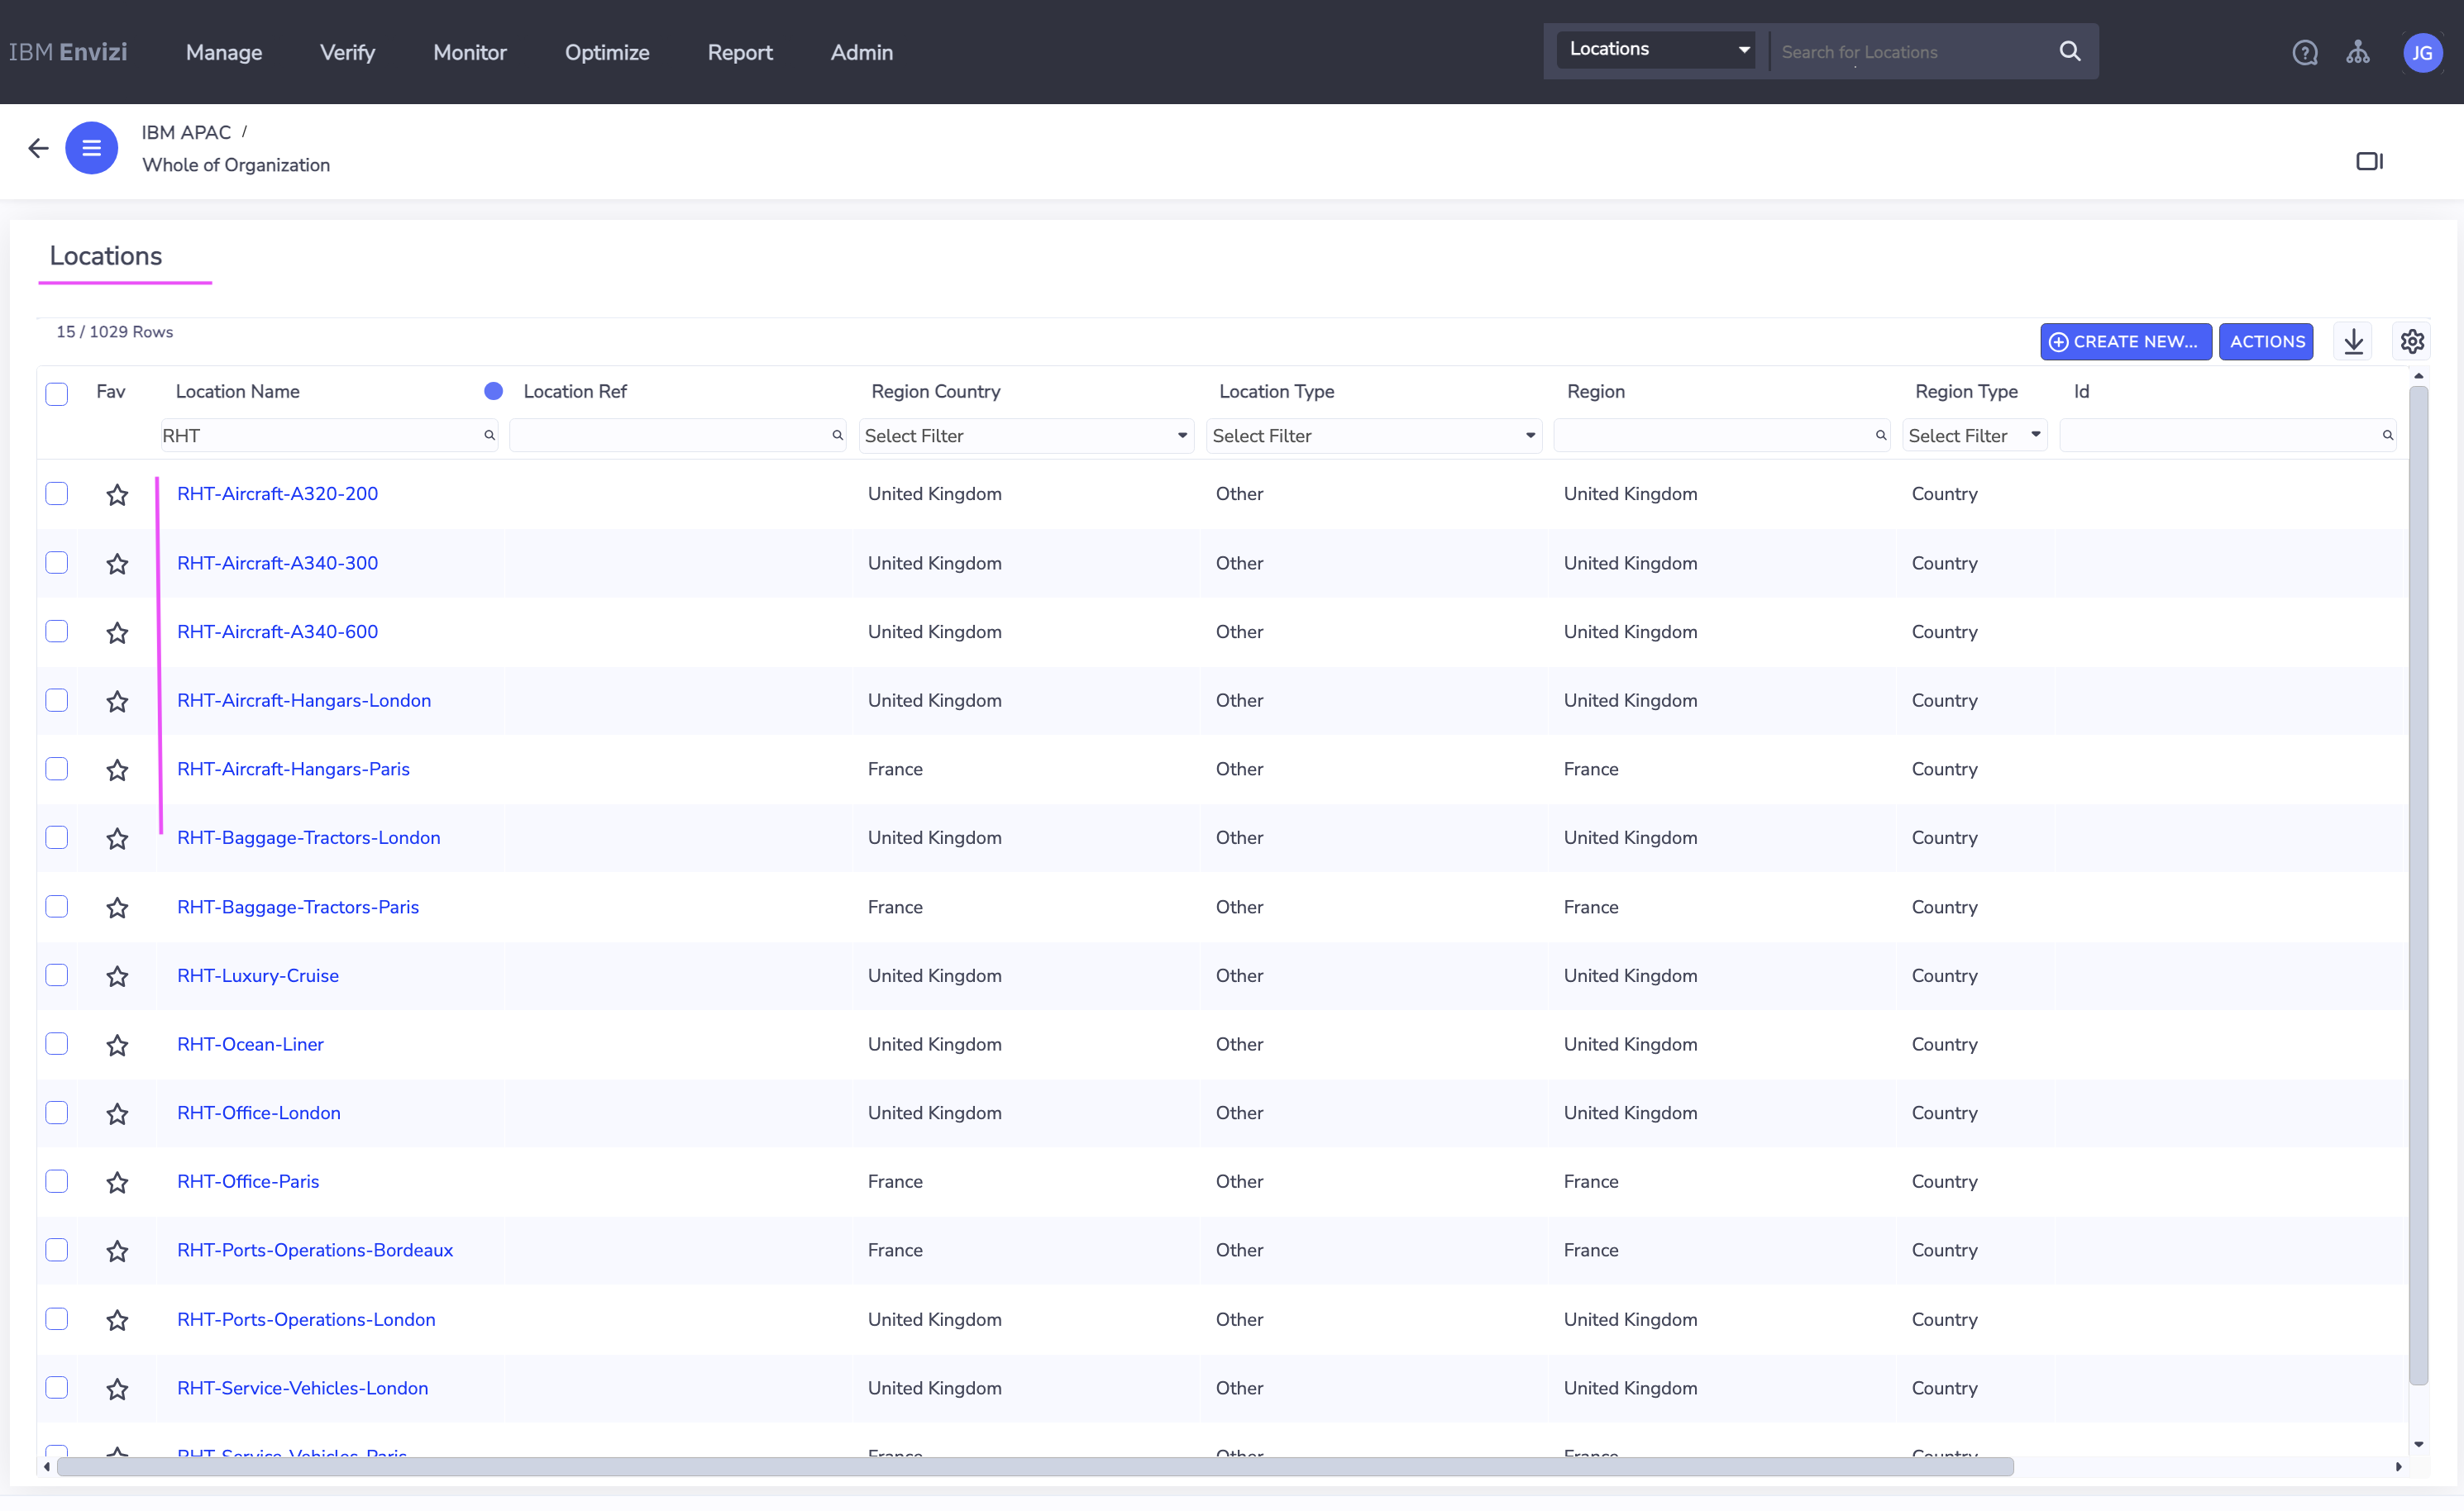
Upload the file to create Groups and Locations.
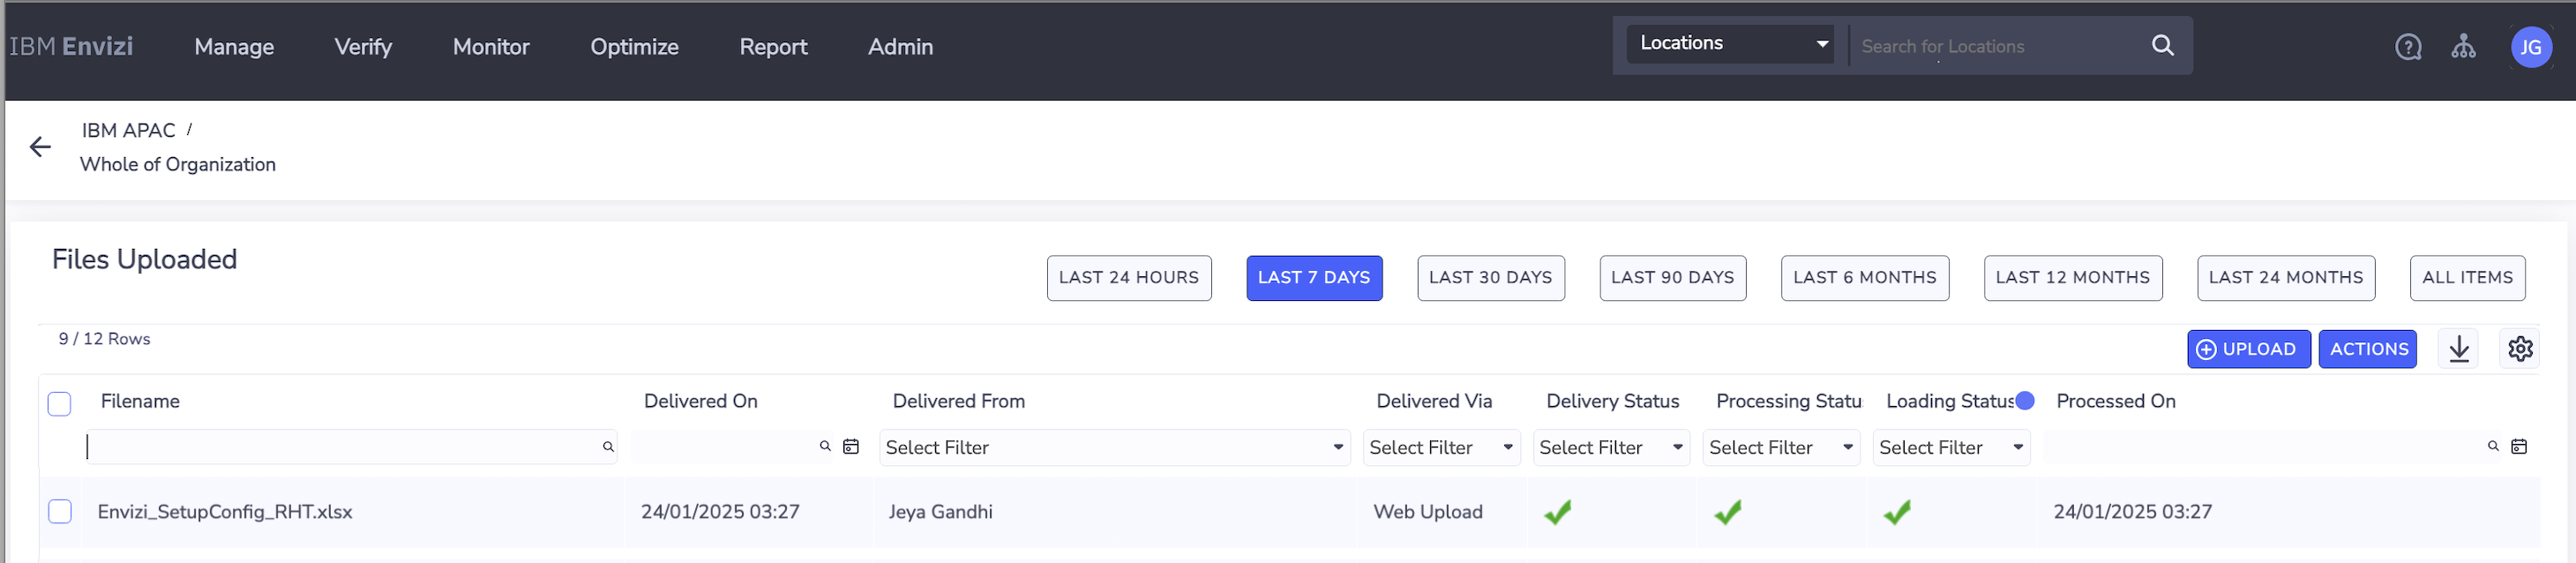
The created Groups and Locations will be displayed on their respective screens.
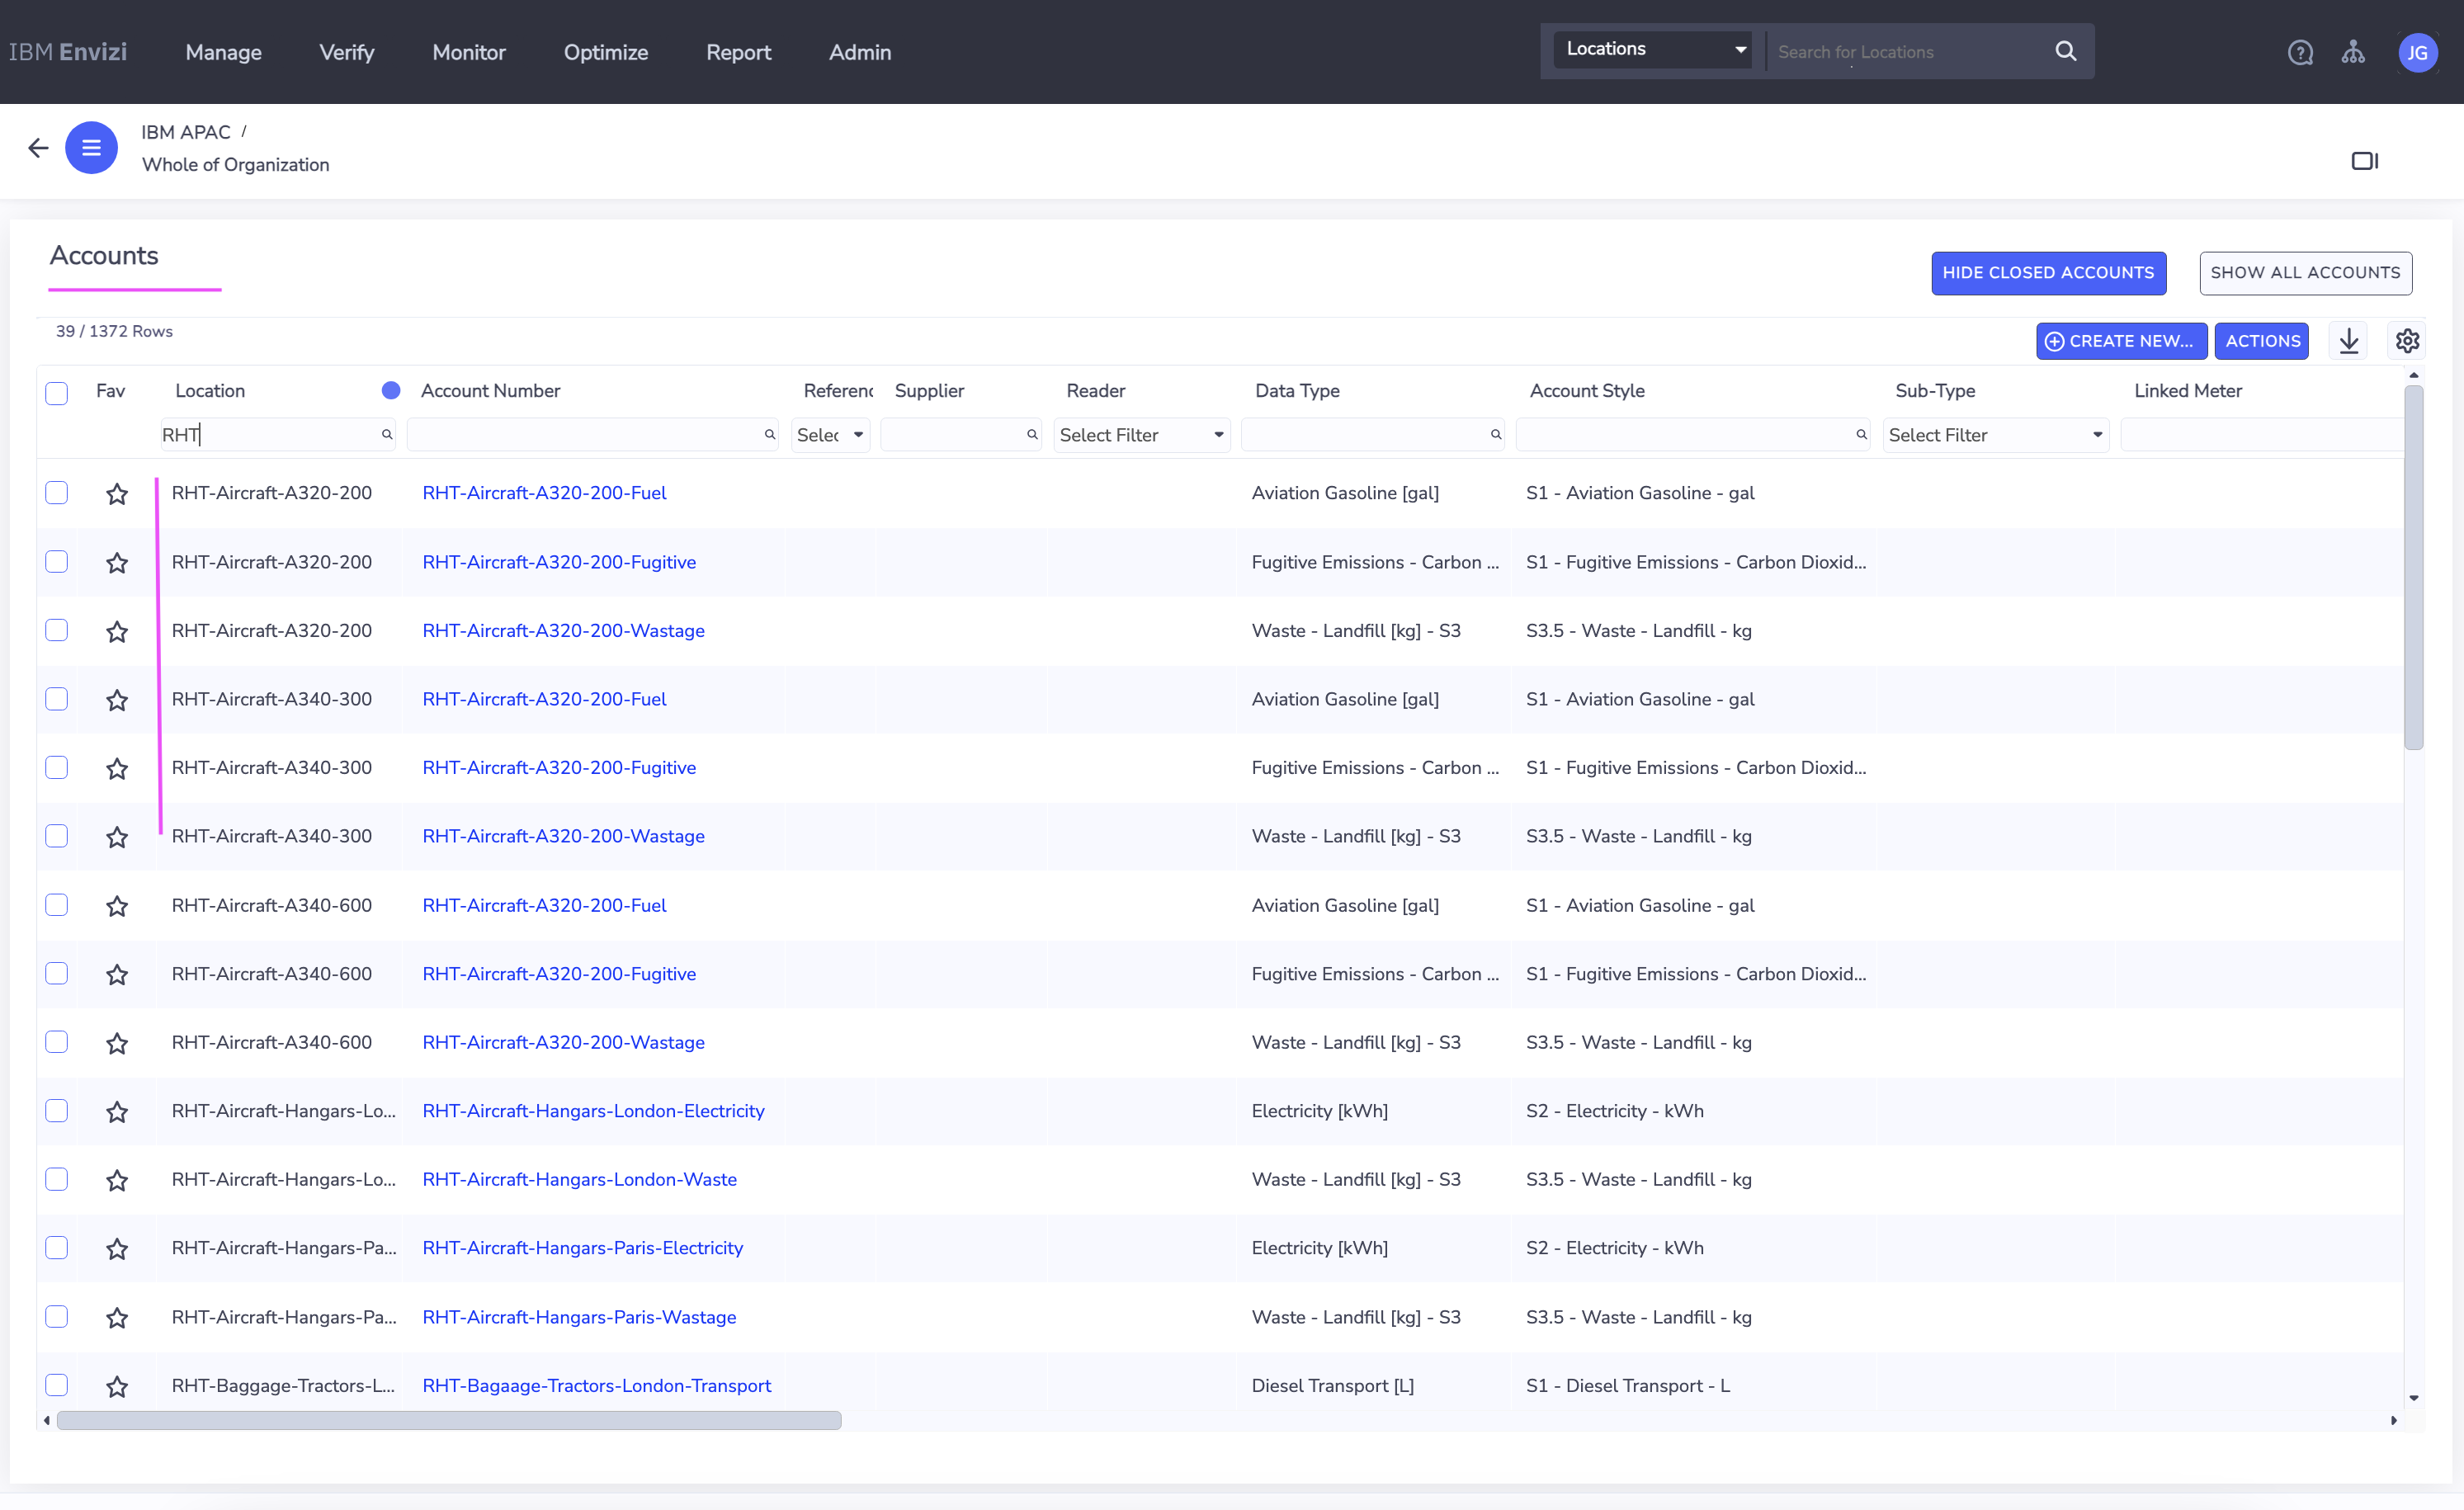
2.3 Create accounts and data
Update the Organization Link, Organization, and Account Style Link columns in the following files:
Upload the files to Envizi to create the Accounts and Data.
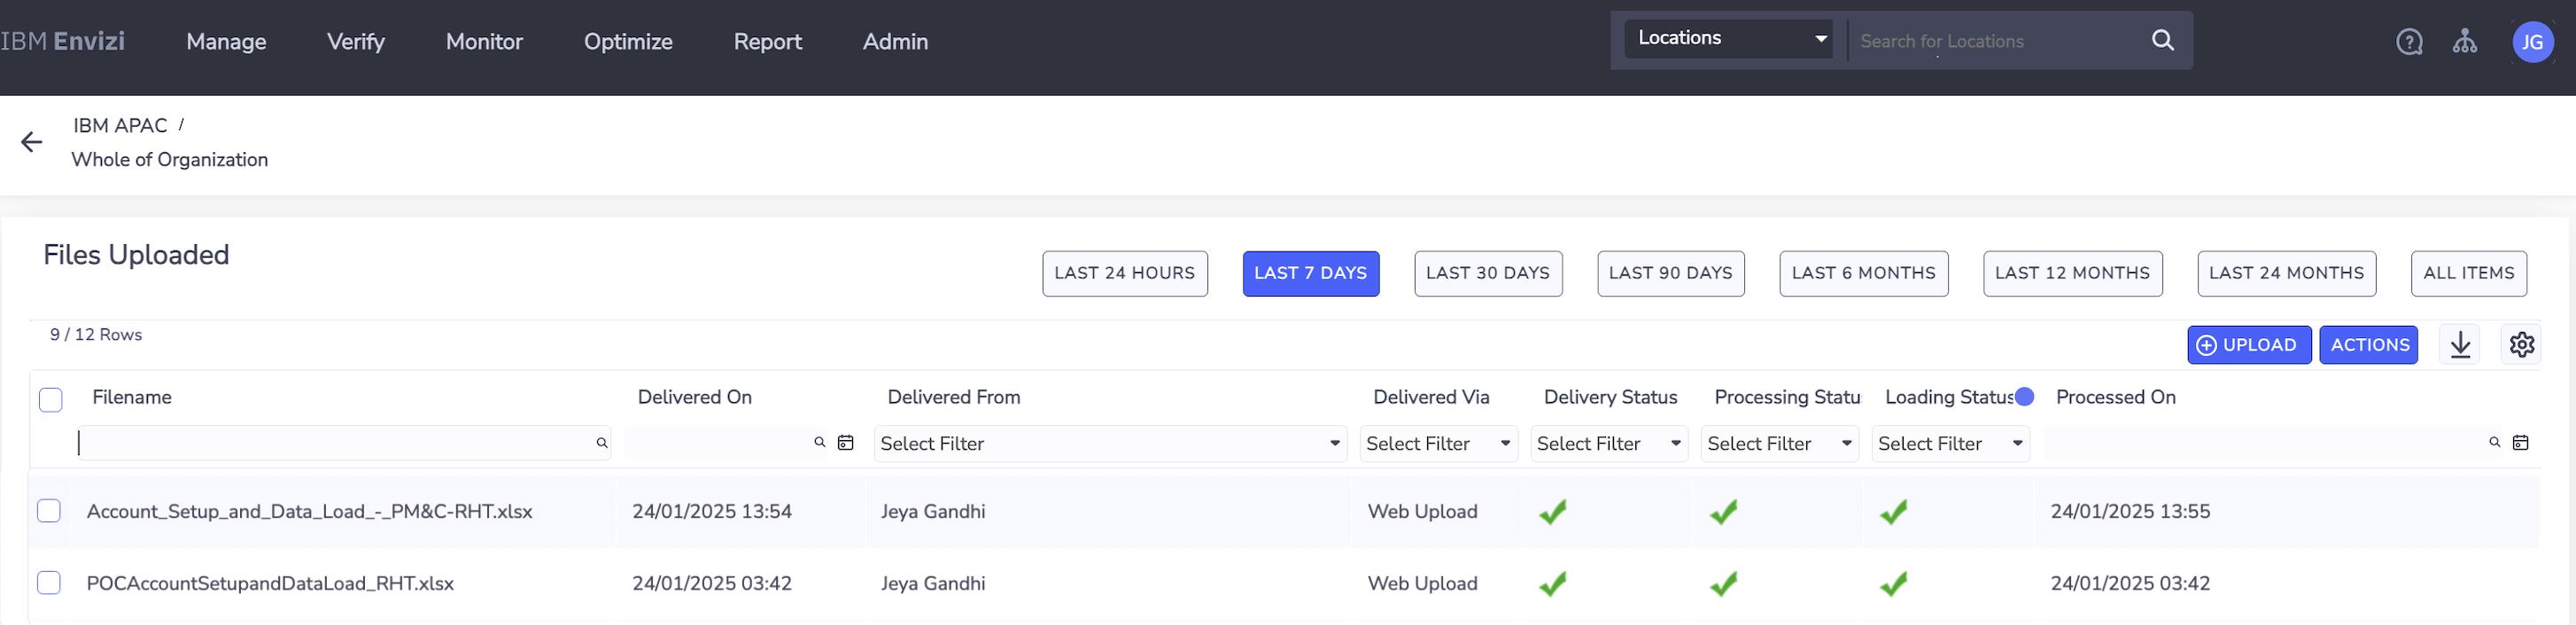
The created accounts will be available on the Accounts screen.
3. View dashboards
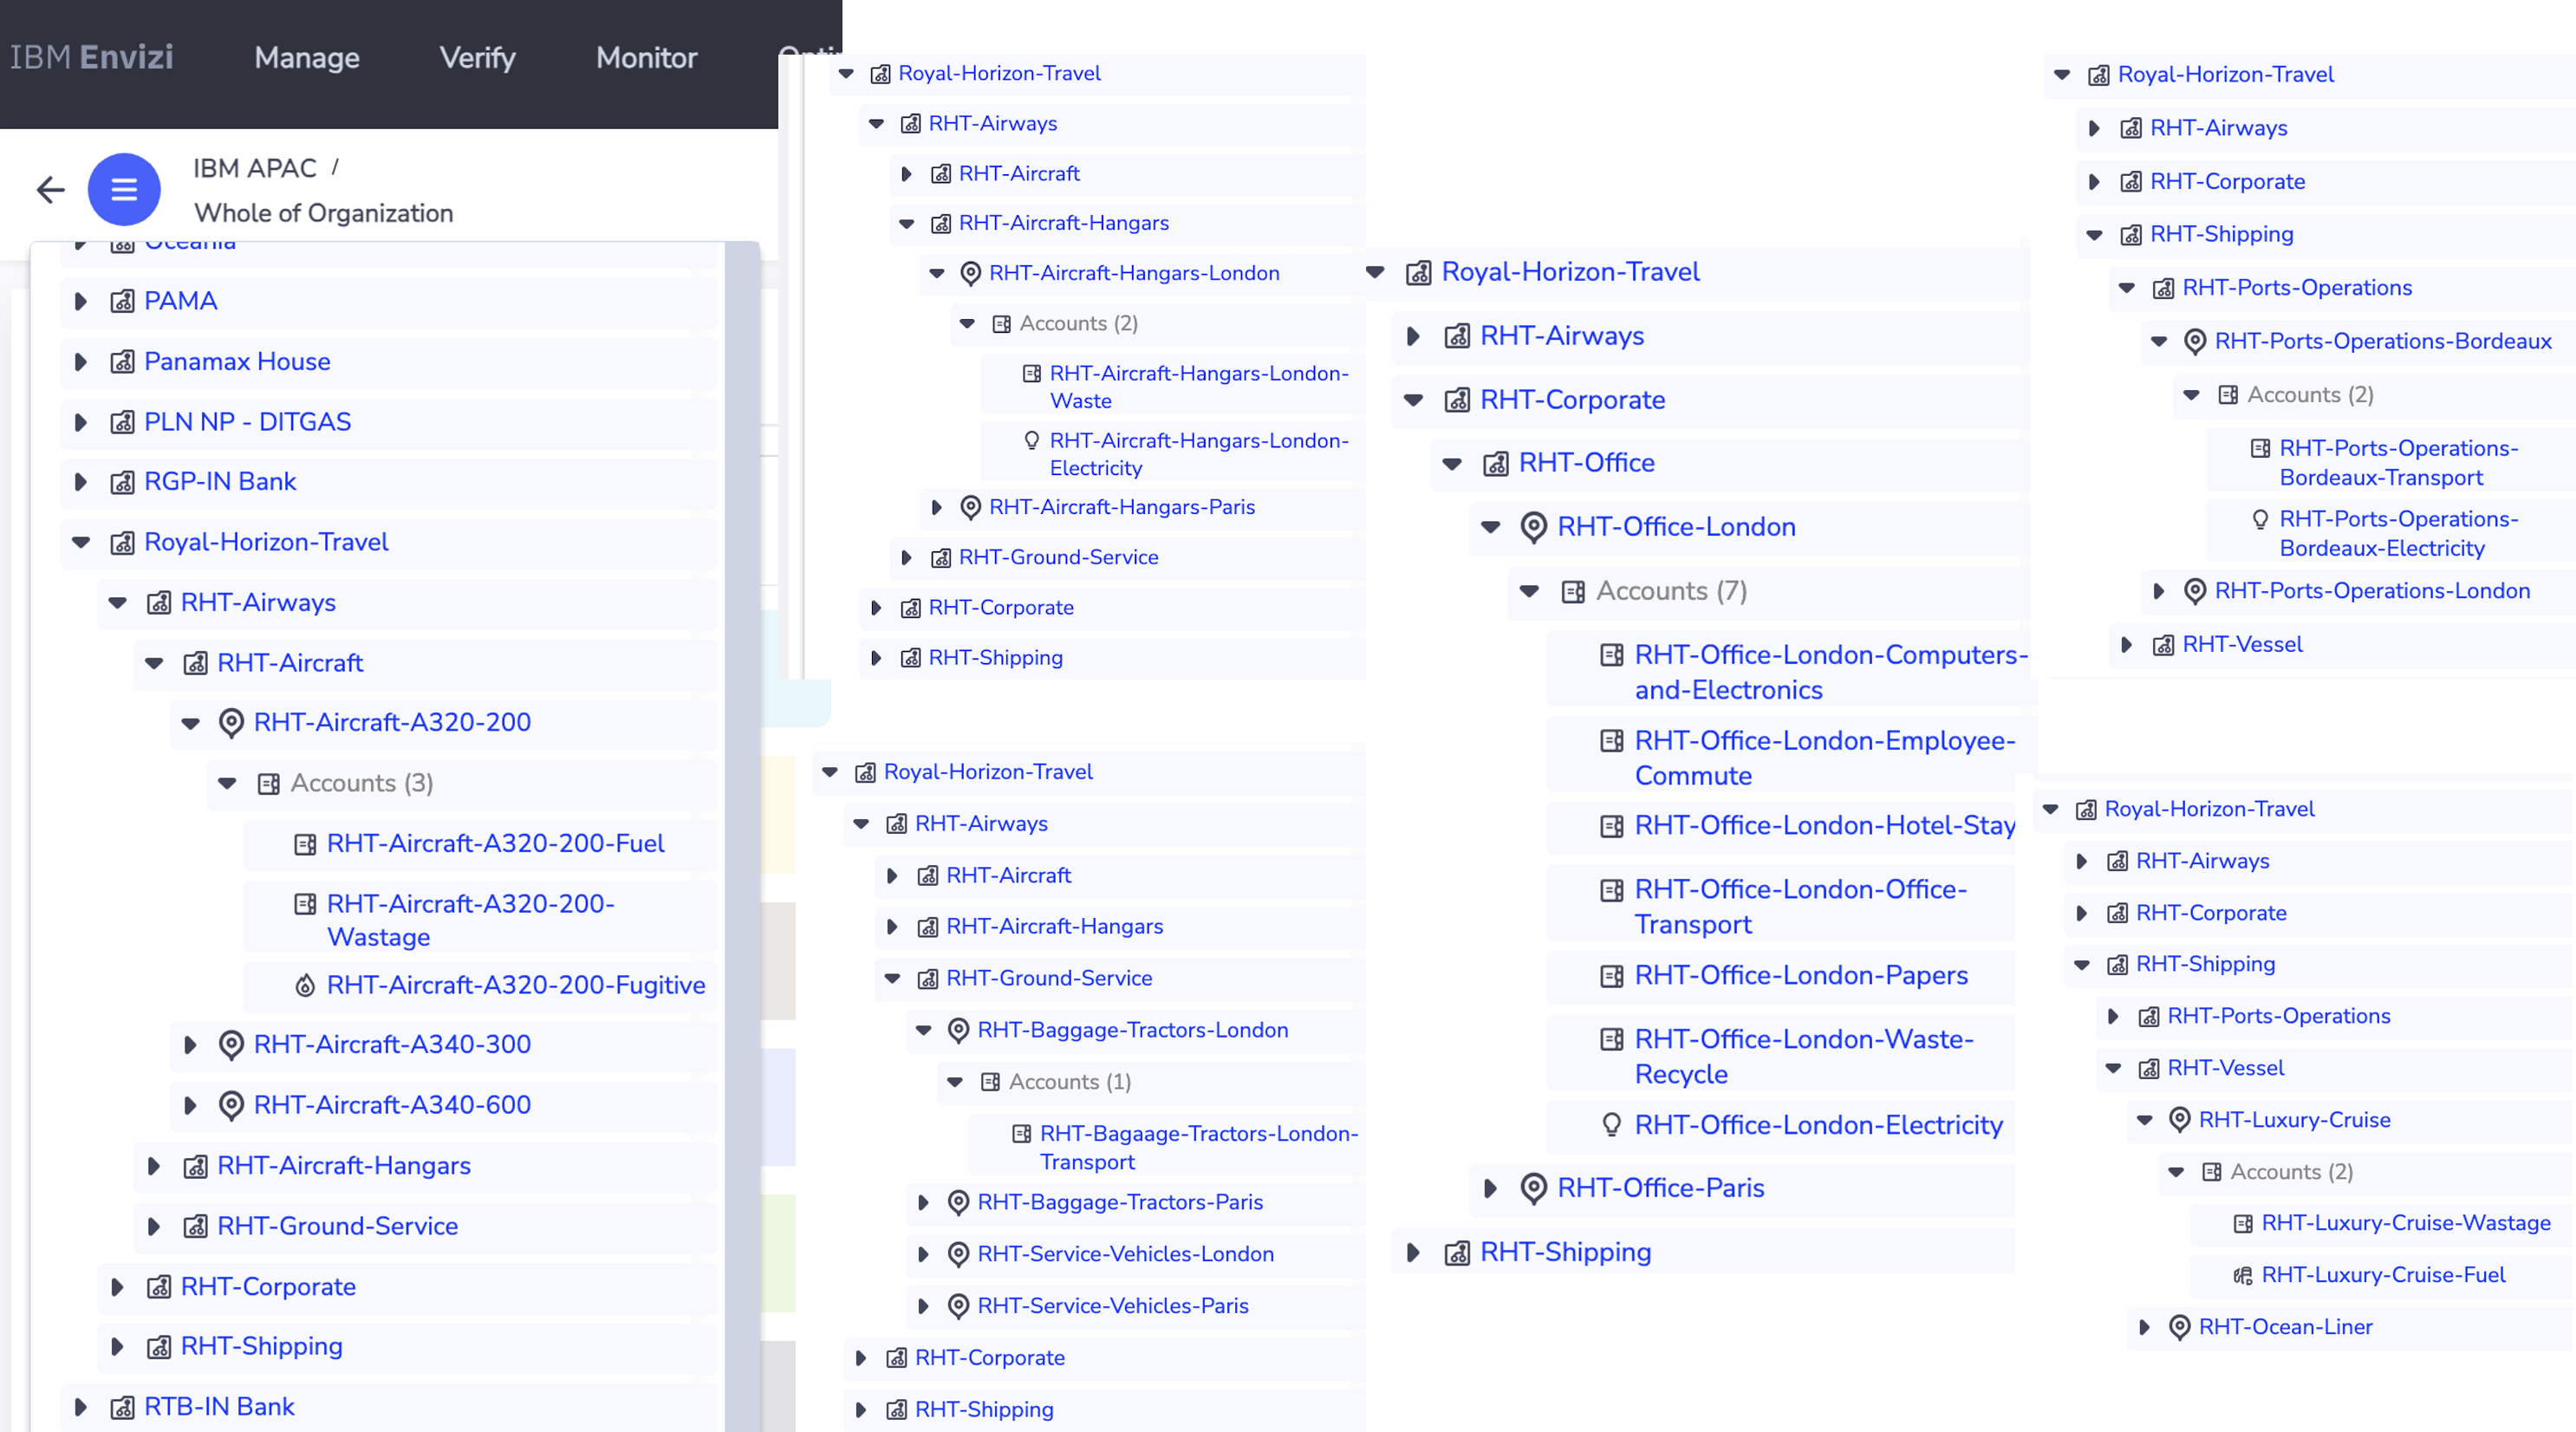
3.1 Organization hierarchy
The dashboard displays the organizational hierarchy with newly created Groups, Locations, and Accounts.
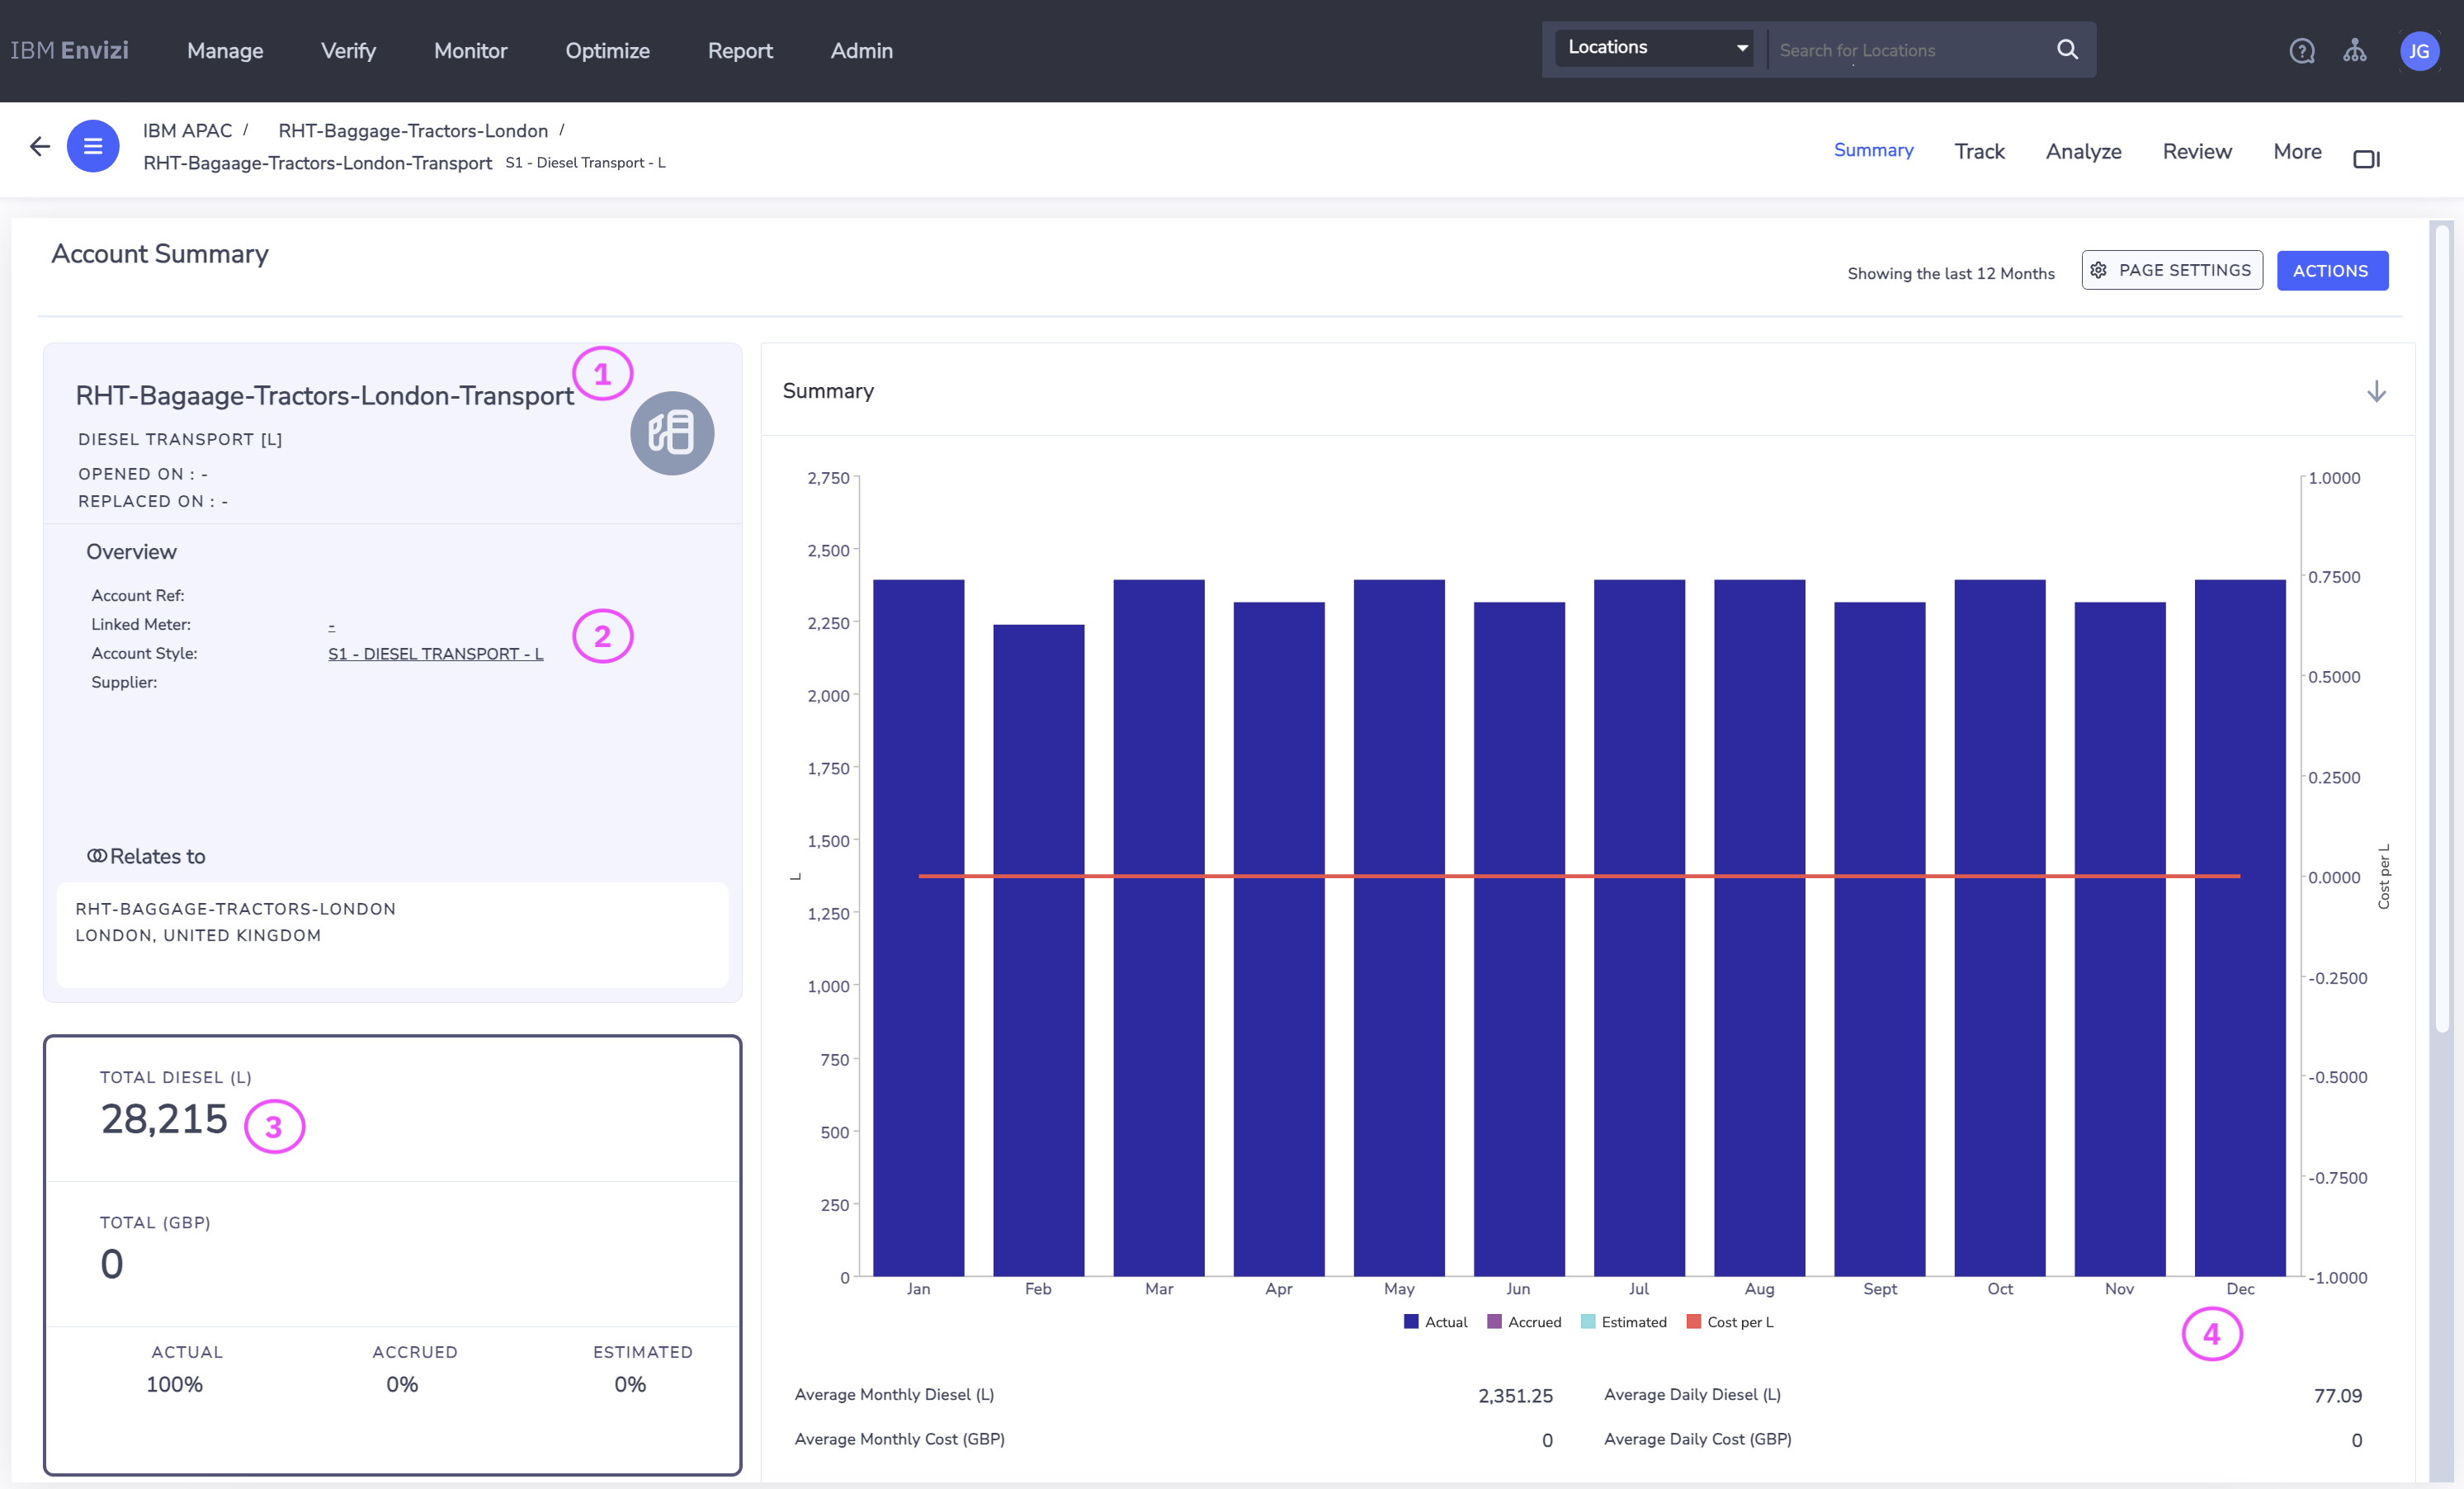
3.2 Account summary
Open the Account Summary page for the RHT-Baggage-Tractors-London-Transport account.
The summary page includes:
- Account name(1)
- Account style(2)
- Total consumption(3)
- Monthly consumption(4)
- Records from the last 12 months(5)

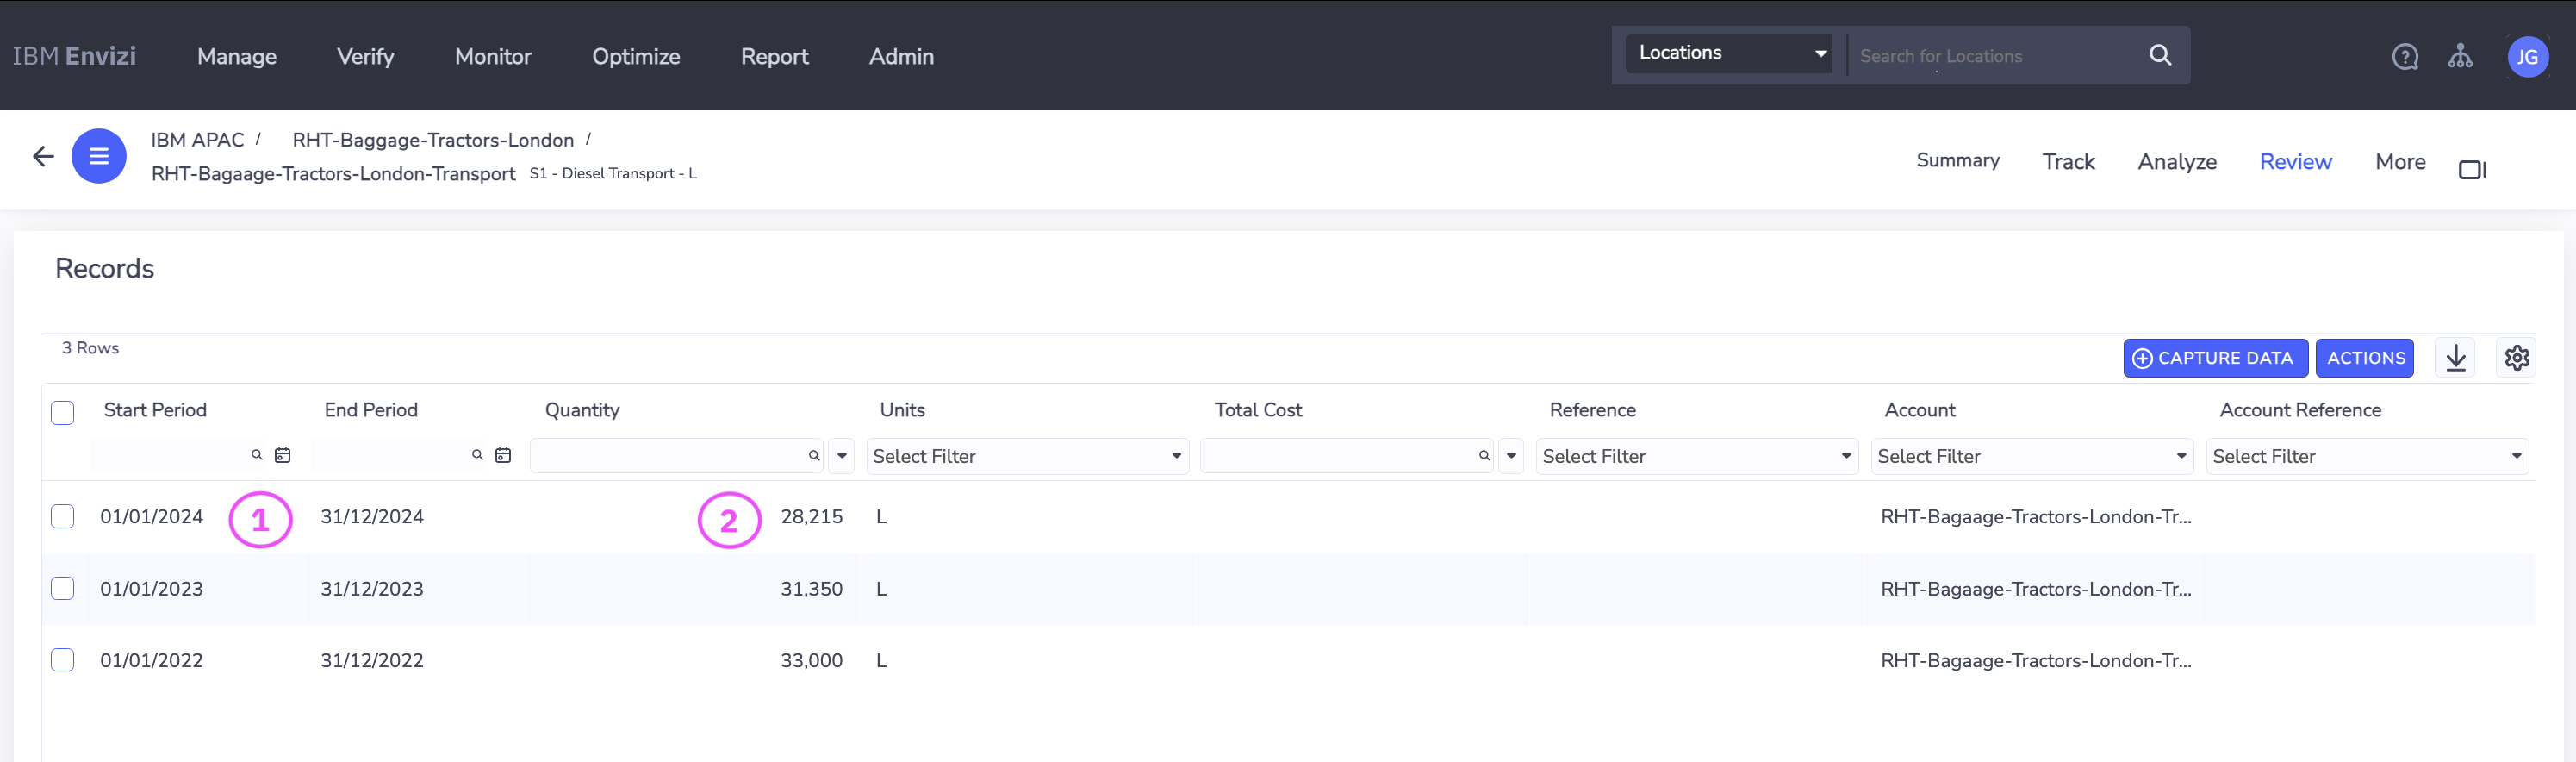
Records
The Records page lists all entries, including start period, end period (1), and quantity (2).
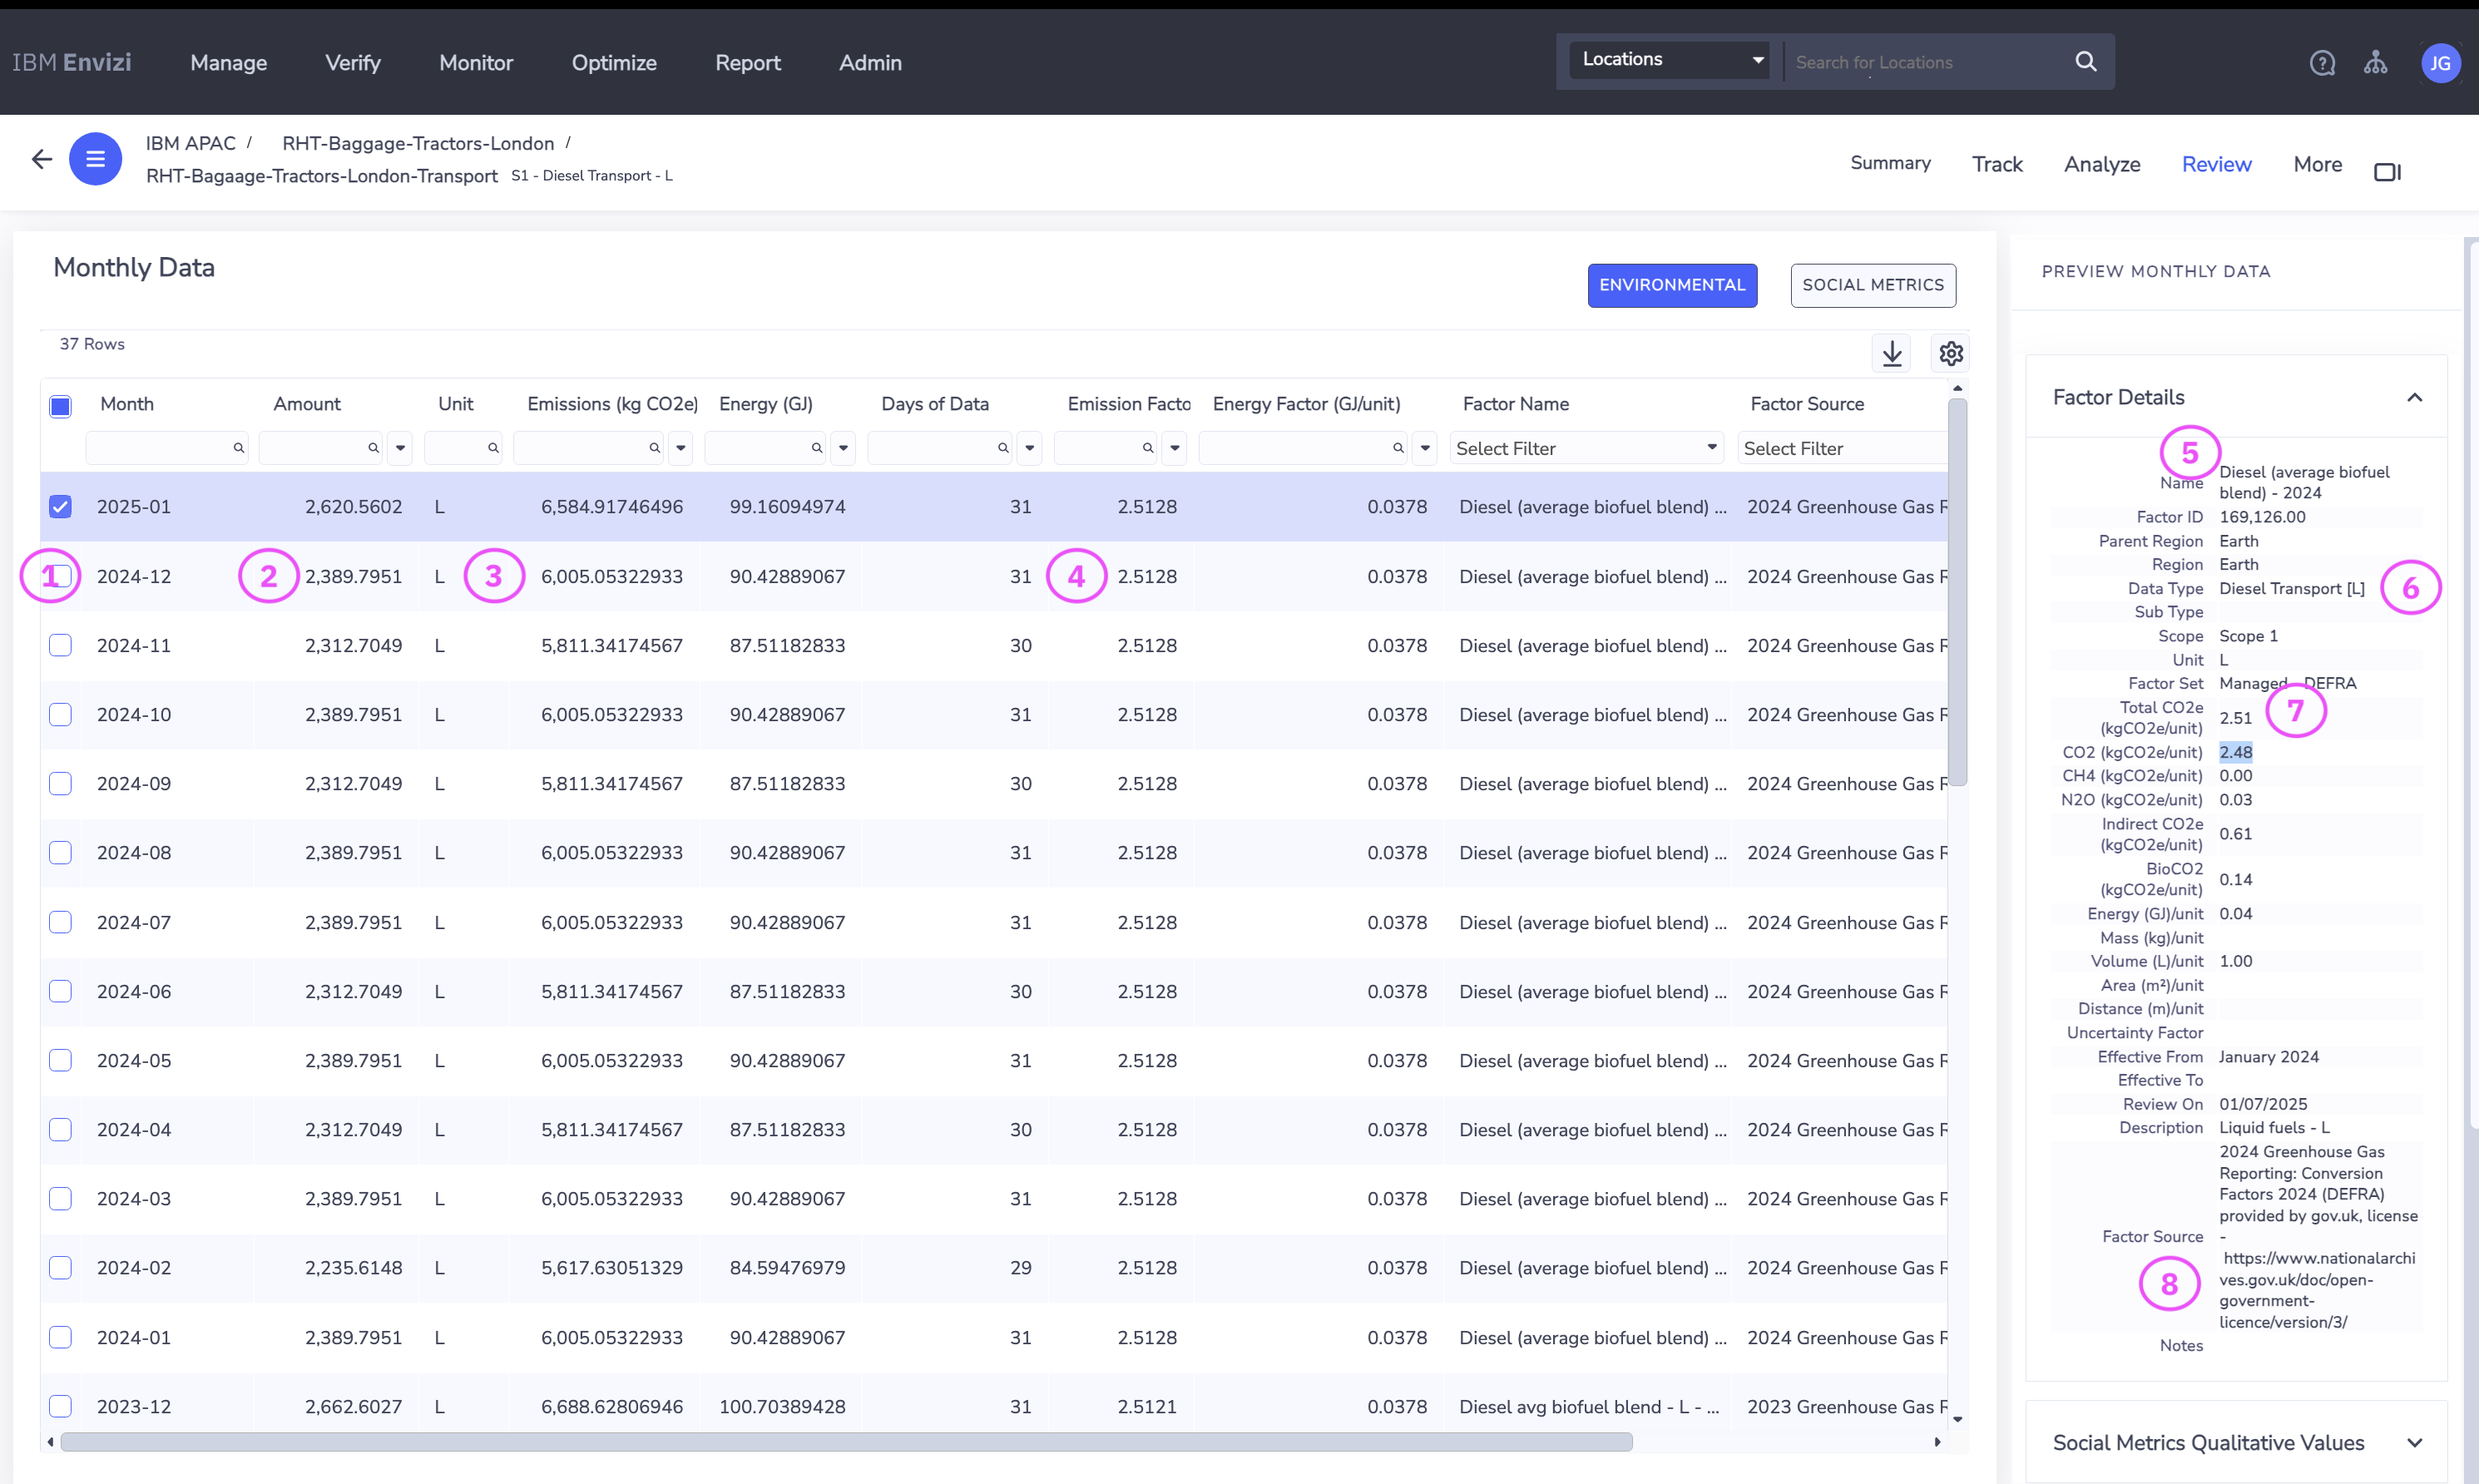
Monthly Data
The Monthly Data screen shows:
- Month of the record (1)
- The consumption amount (2)
- Emission amount (3)
- The emission factor value applied (4)
- The Factor name applied for the account (5)
- The Data Type of the account (6)
- The emission factor of the data type (7)
- Factor source (8)
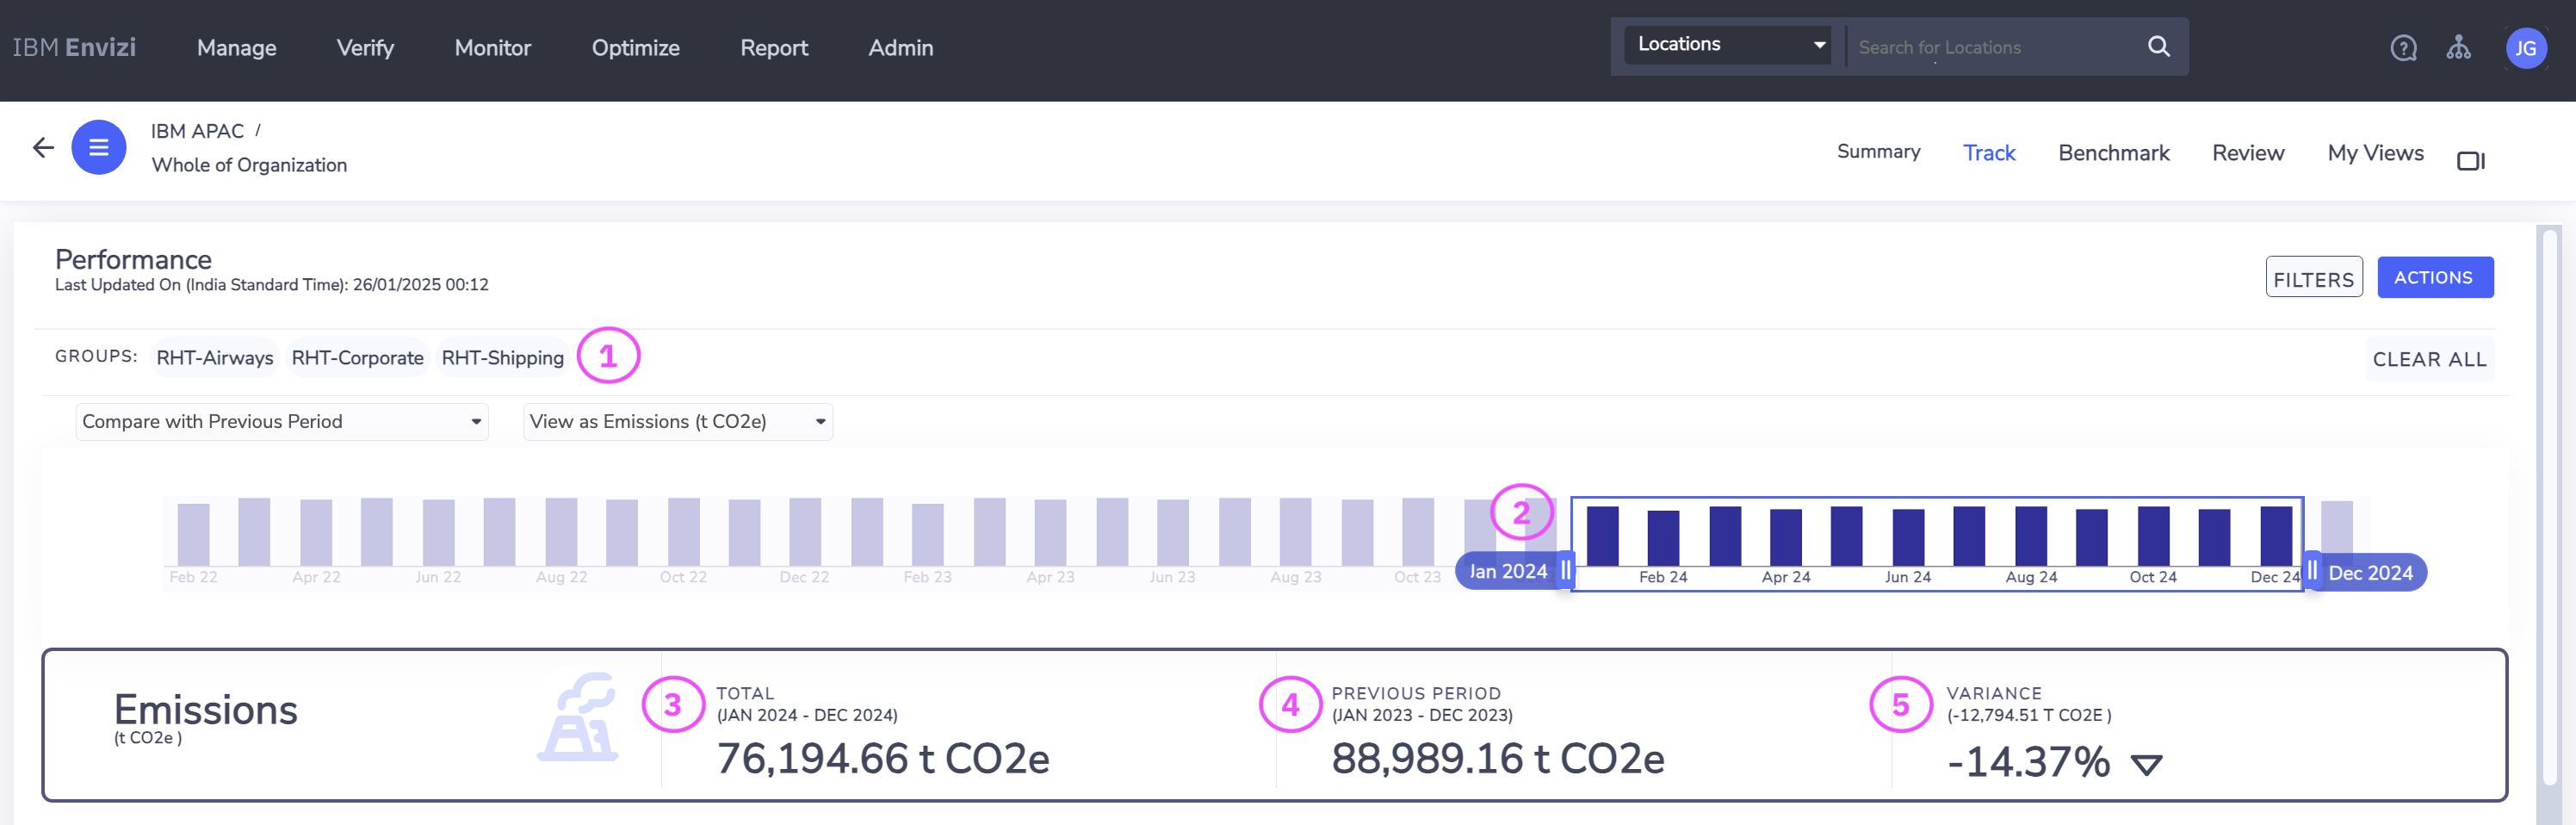
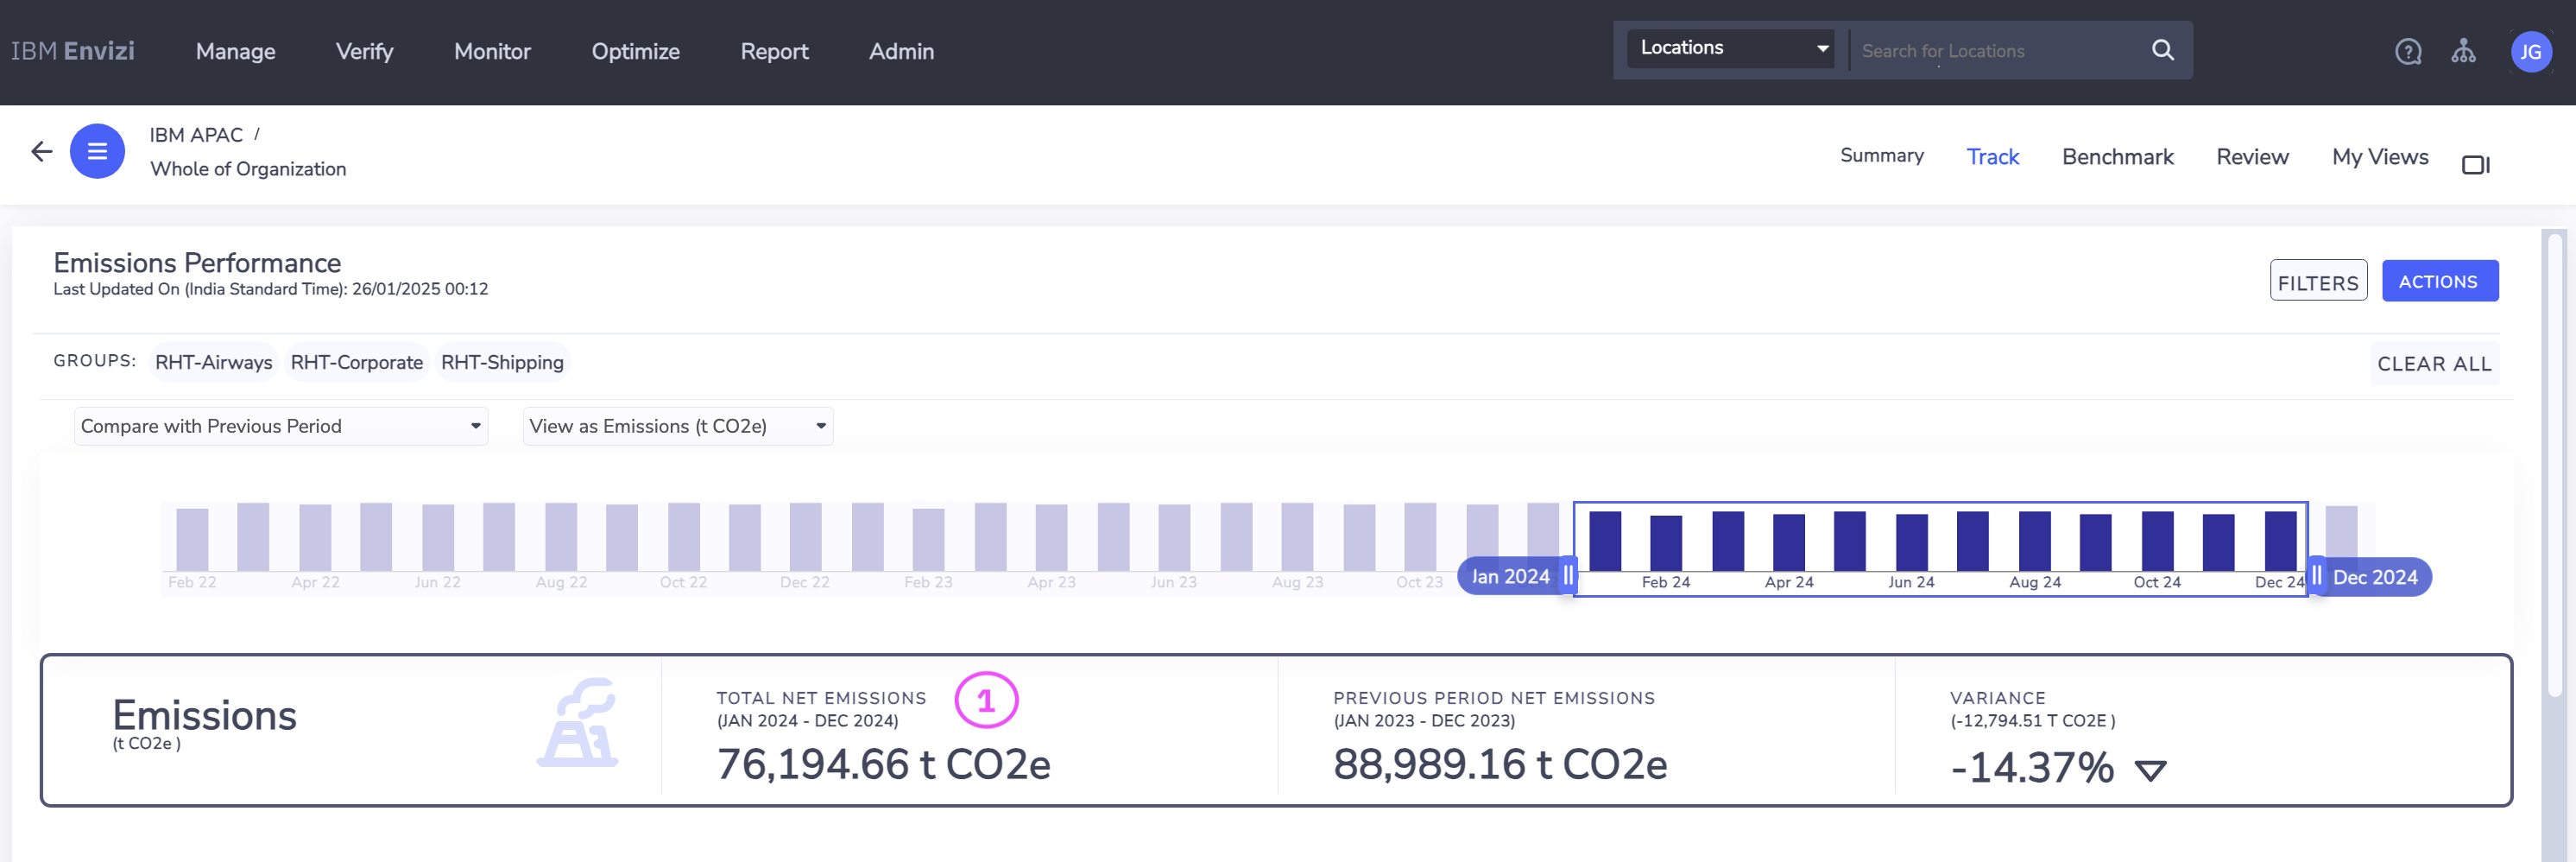
3.3 Organization-level performance
The Performance Dashboard provides emission insights for the entire organization. The filter is set to the Royal Horizon Travel group.
- Groups filter (1)
- Timeline (2)
- Emissions of Current Period (3)
- Emissions of Previous Period (4)
Variance % compared to last year (5)
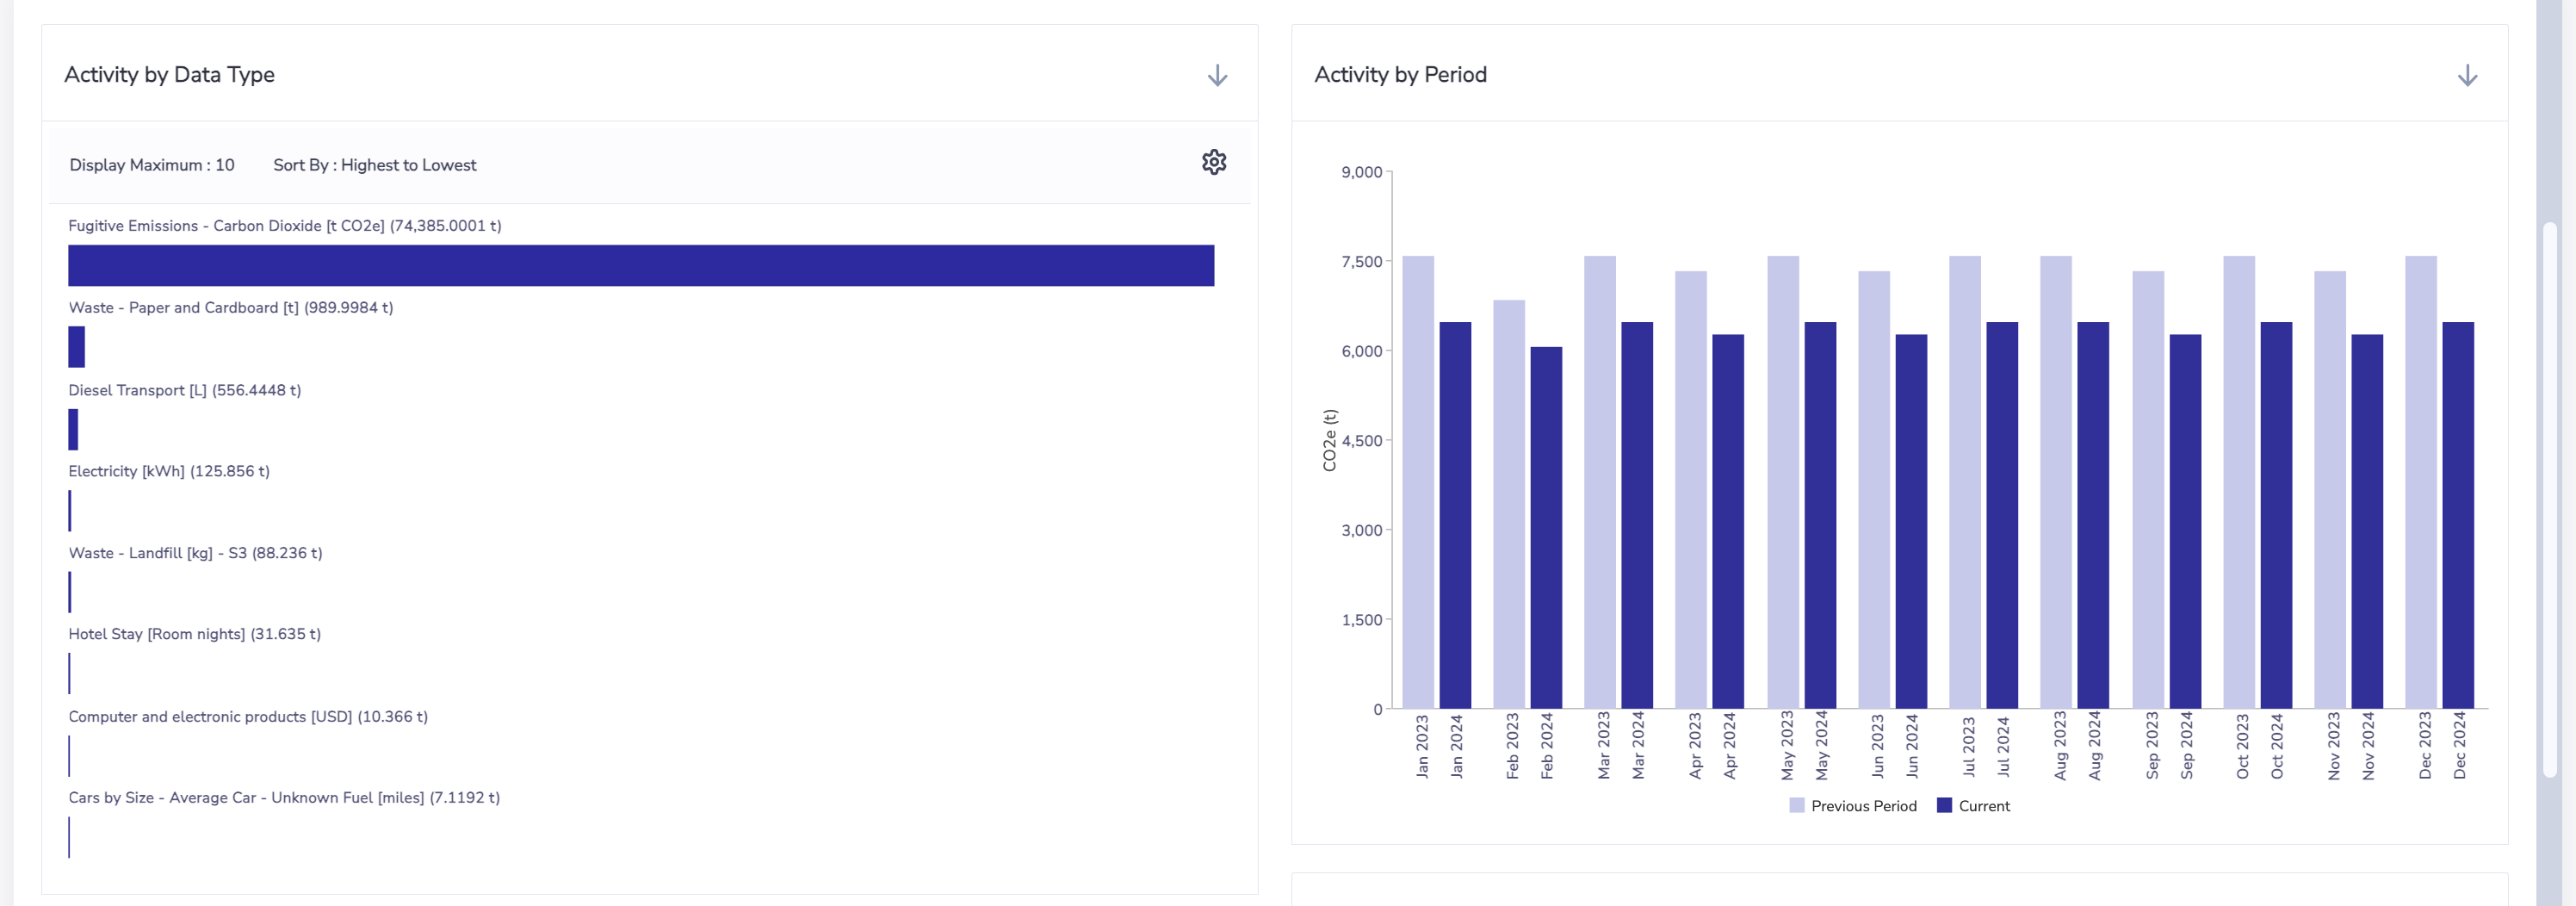
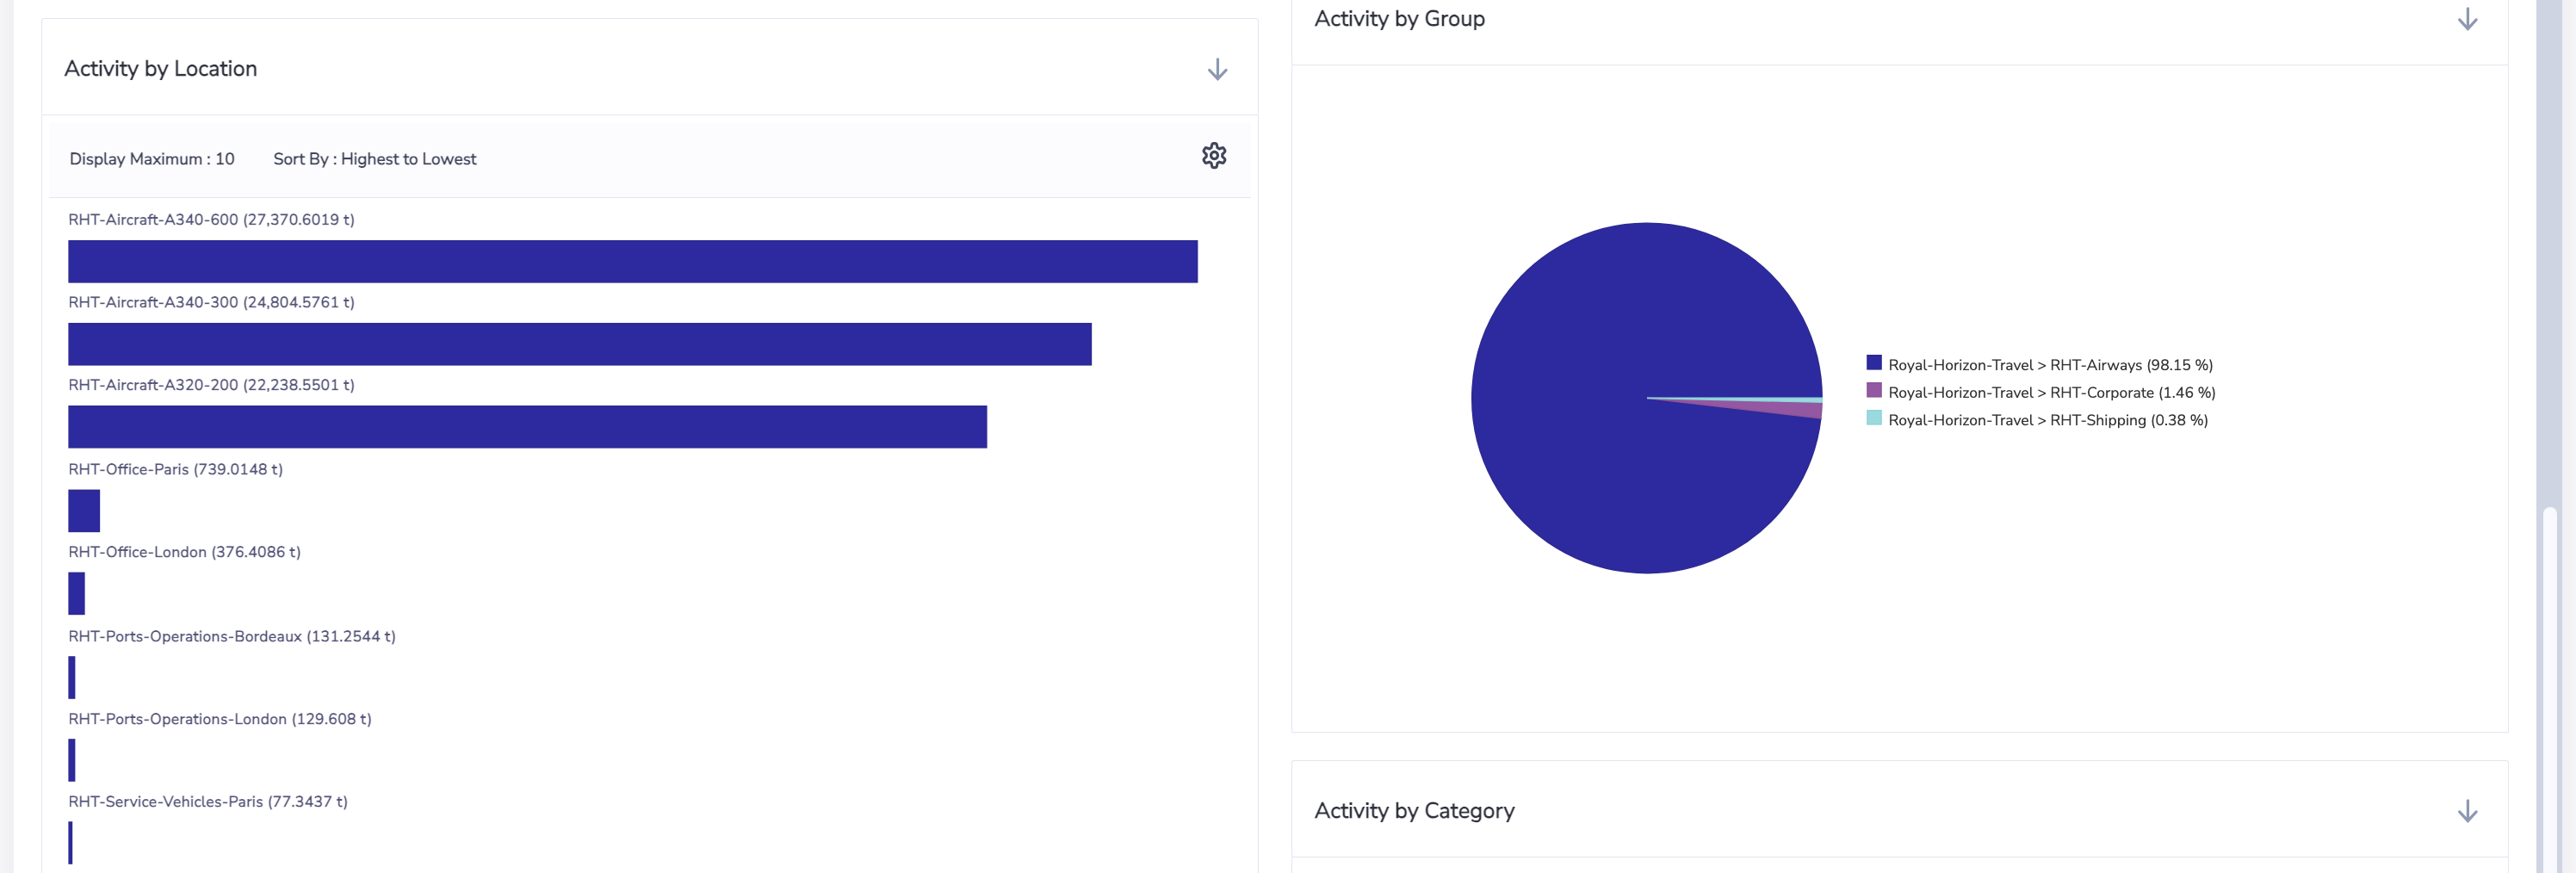
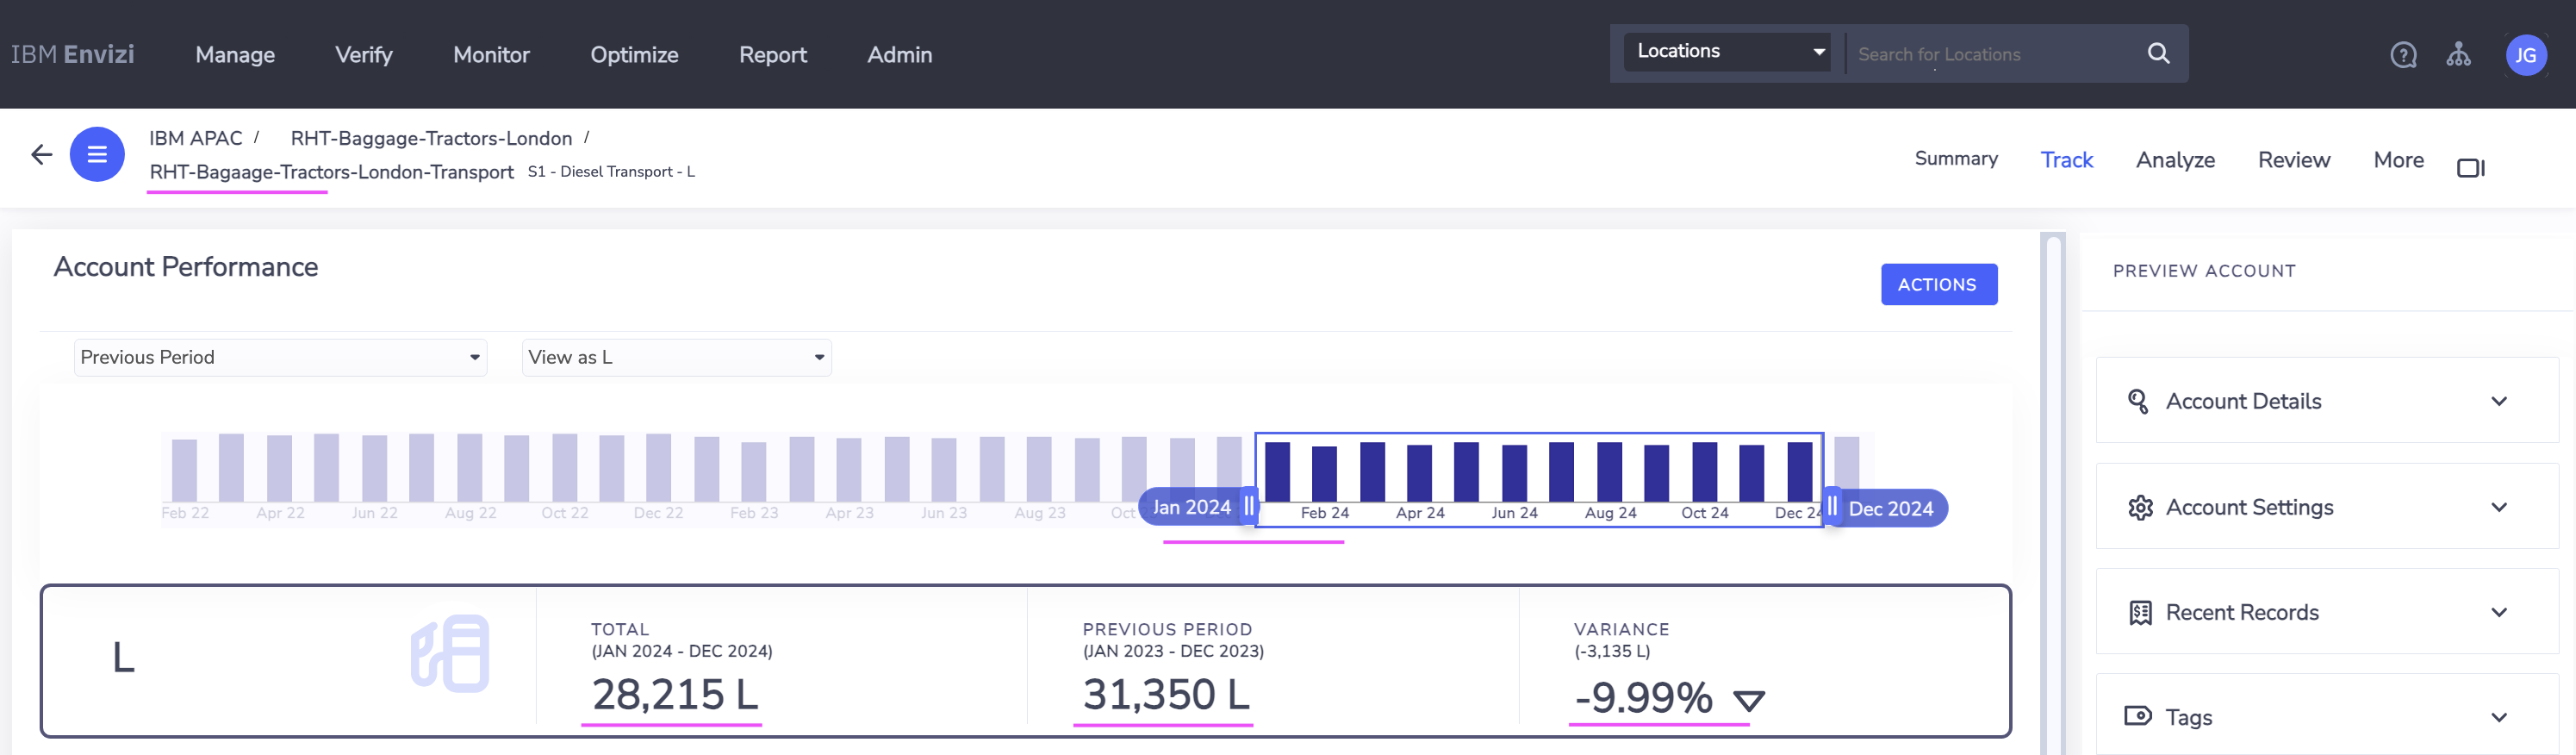
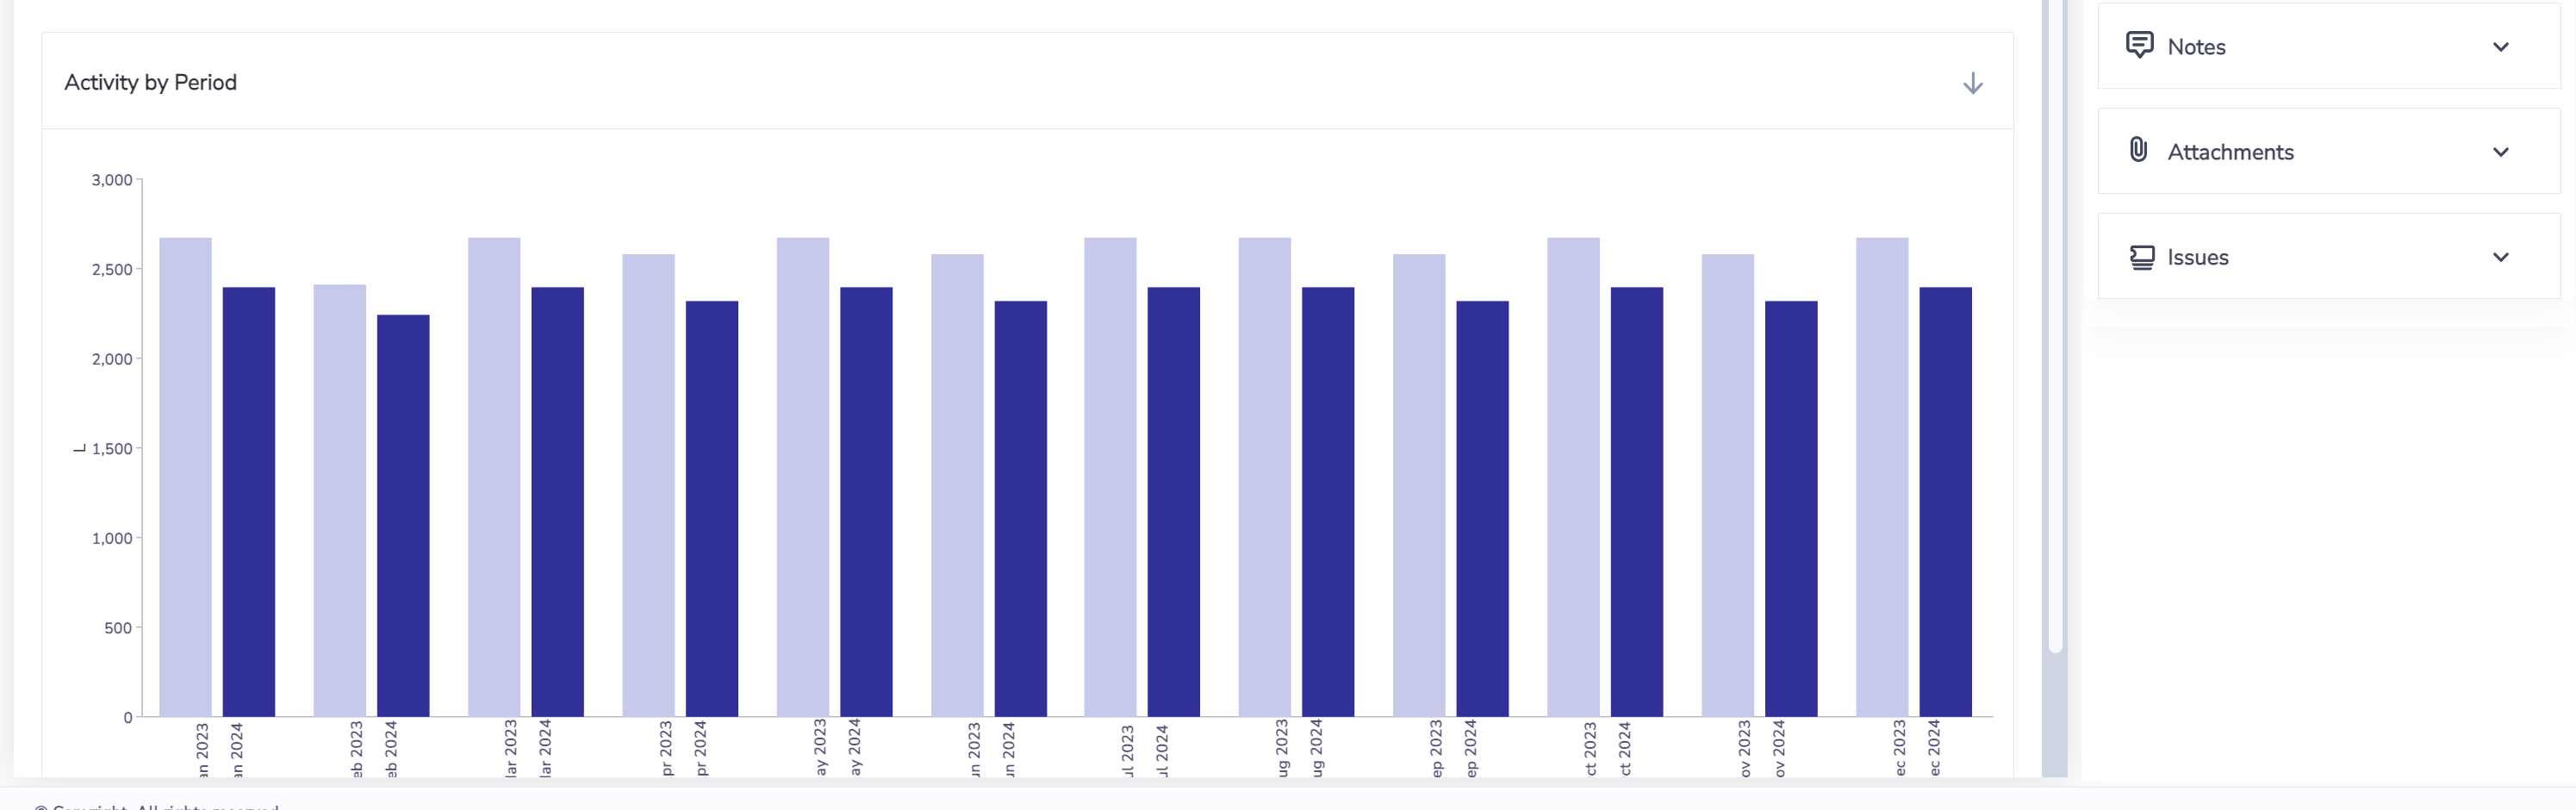
3.4 Account performance
The Account Performance dashboard tracks performance at the account level.
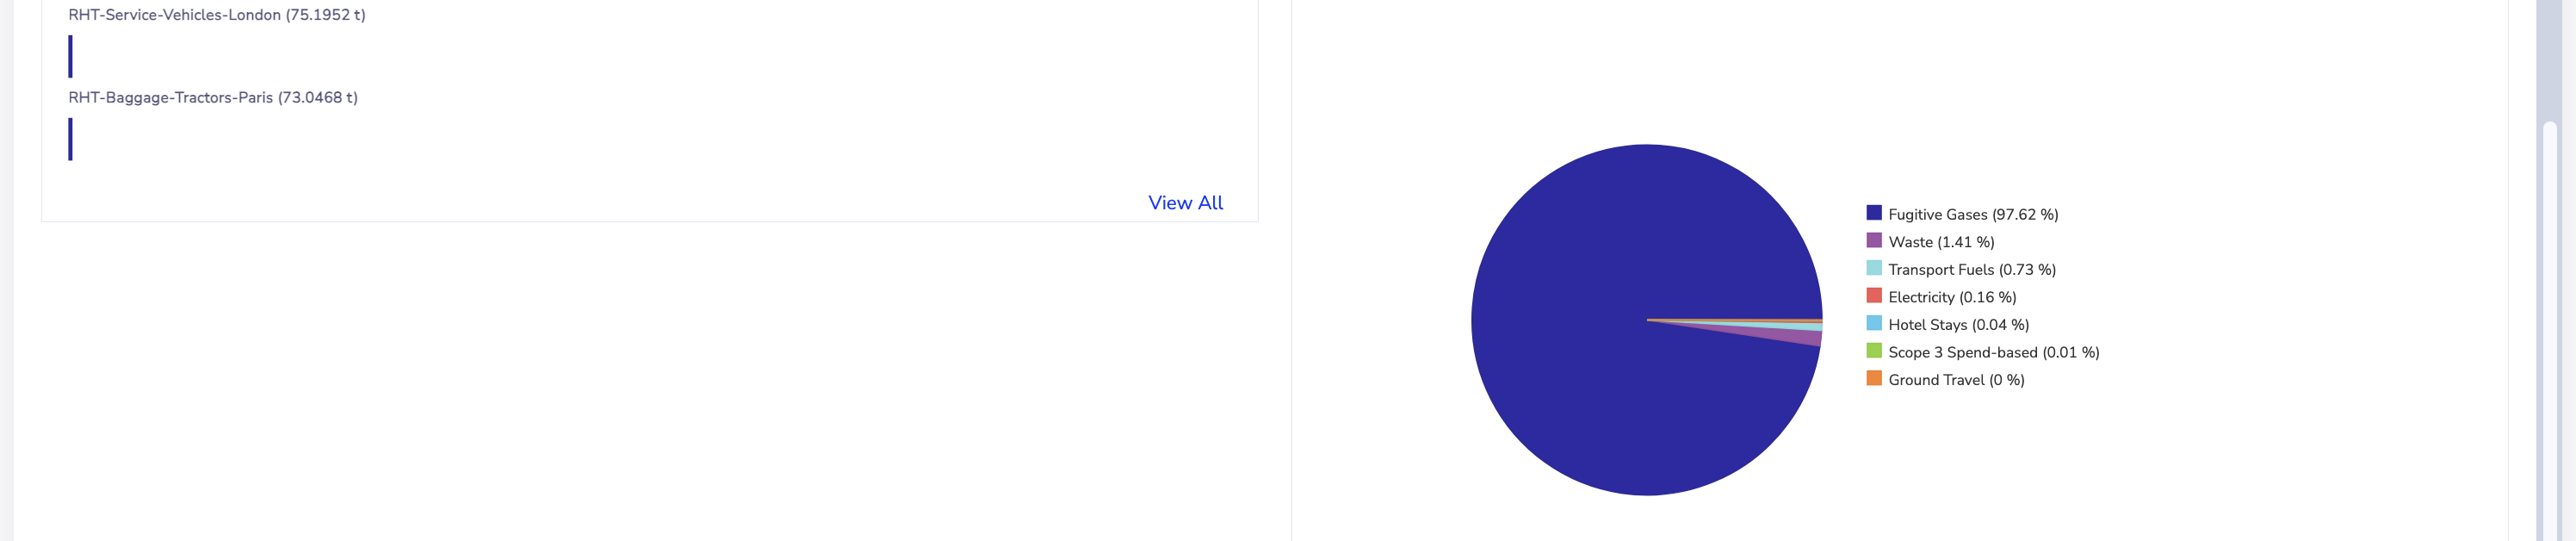
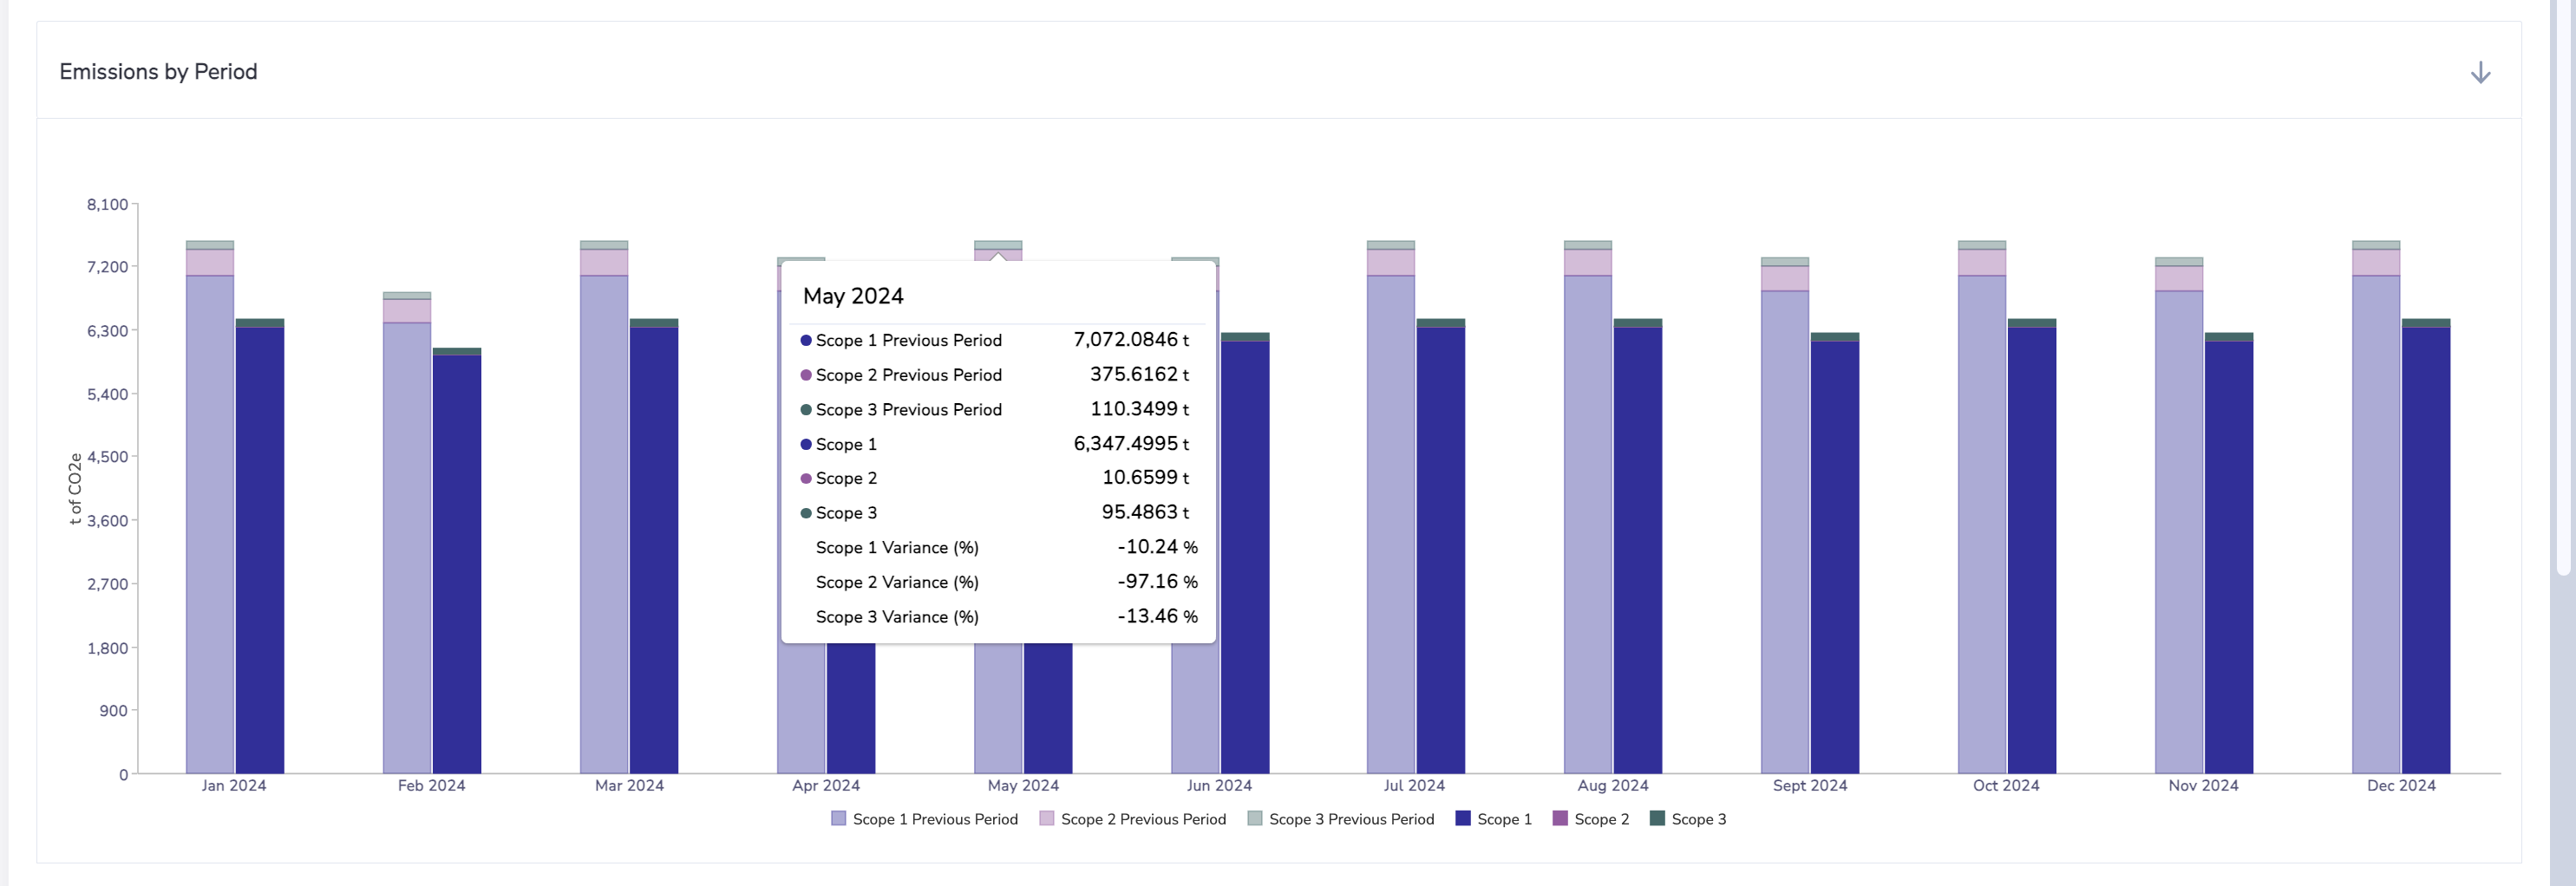
3.5 View emission performance
The Emission Performance Dashboard shows emissions for the entire organization. The filter is set to the group Royal Horizon Travel.
You can view the Total emissions (1), scope breakdown (2), and other details.
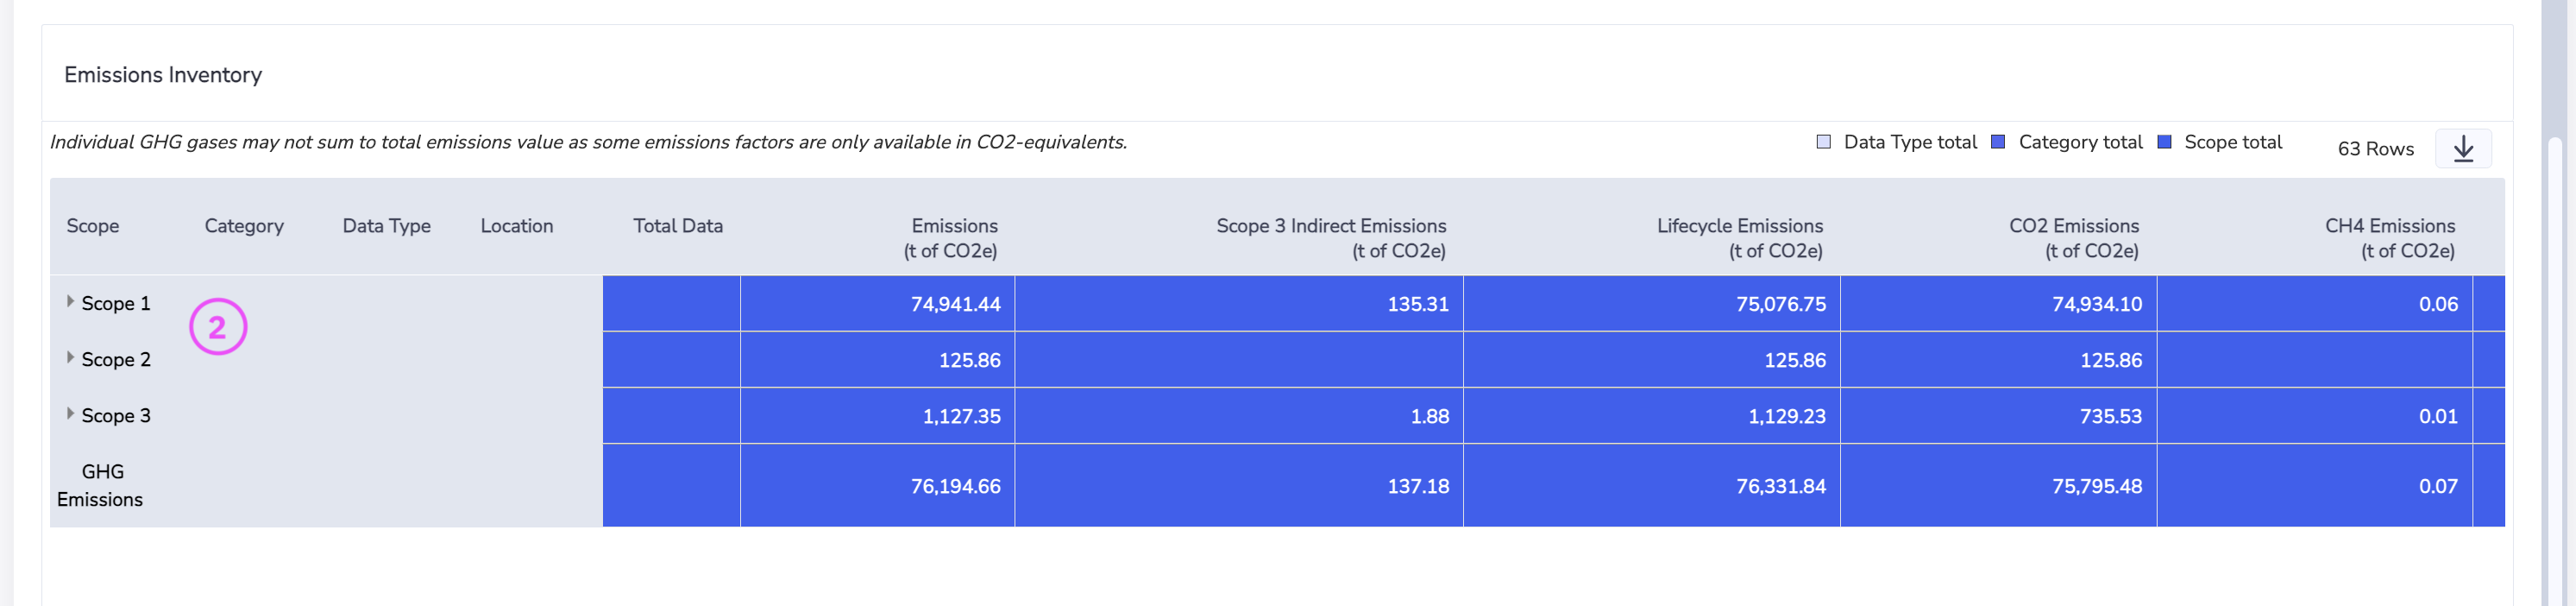
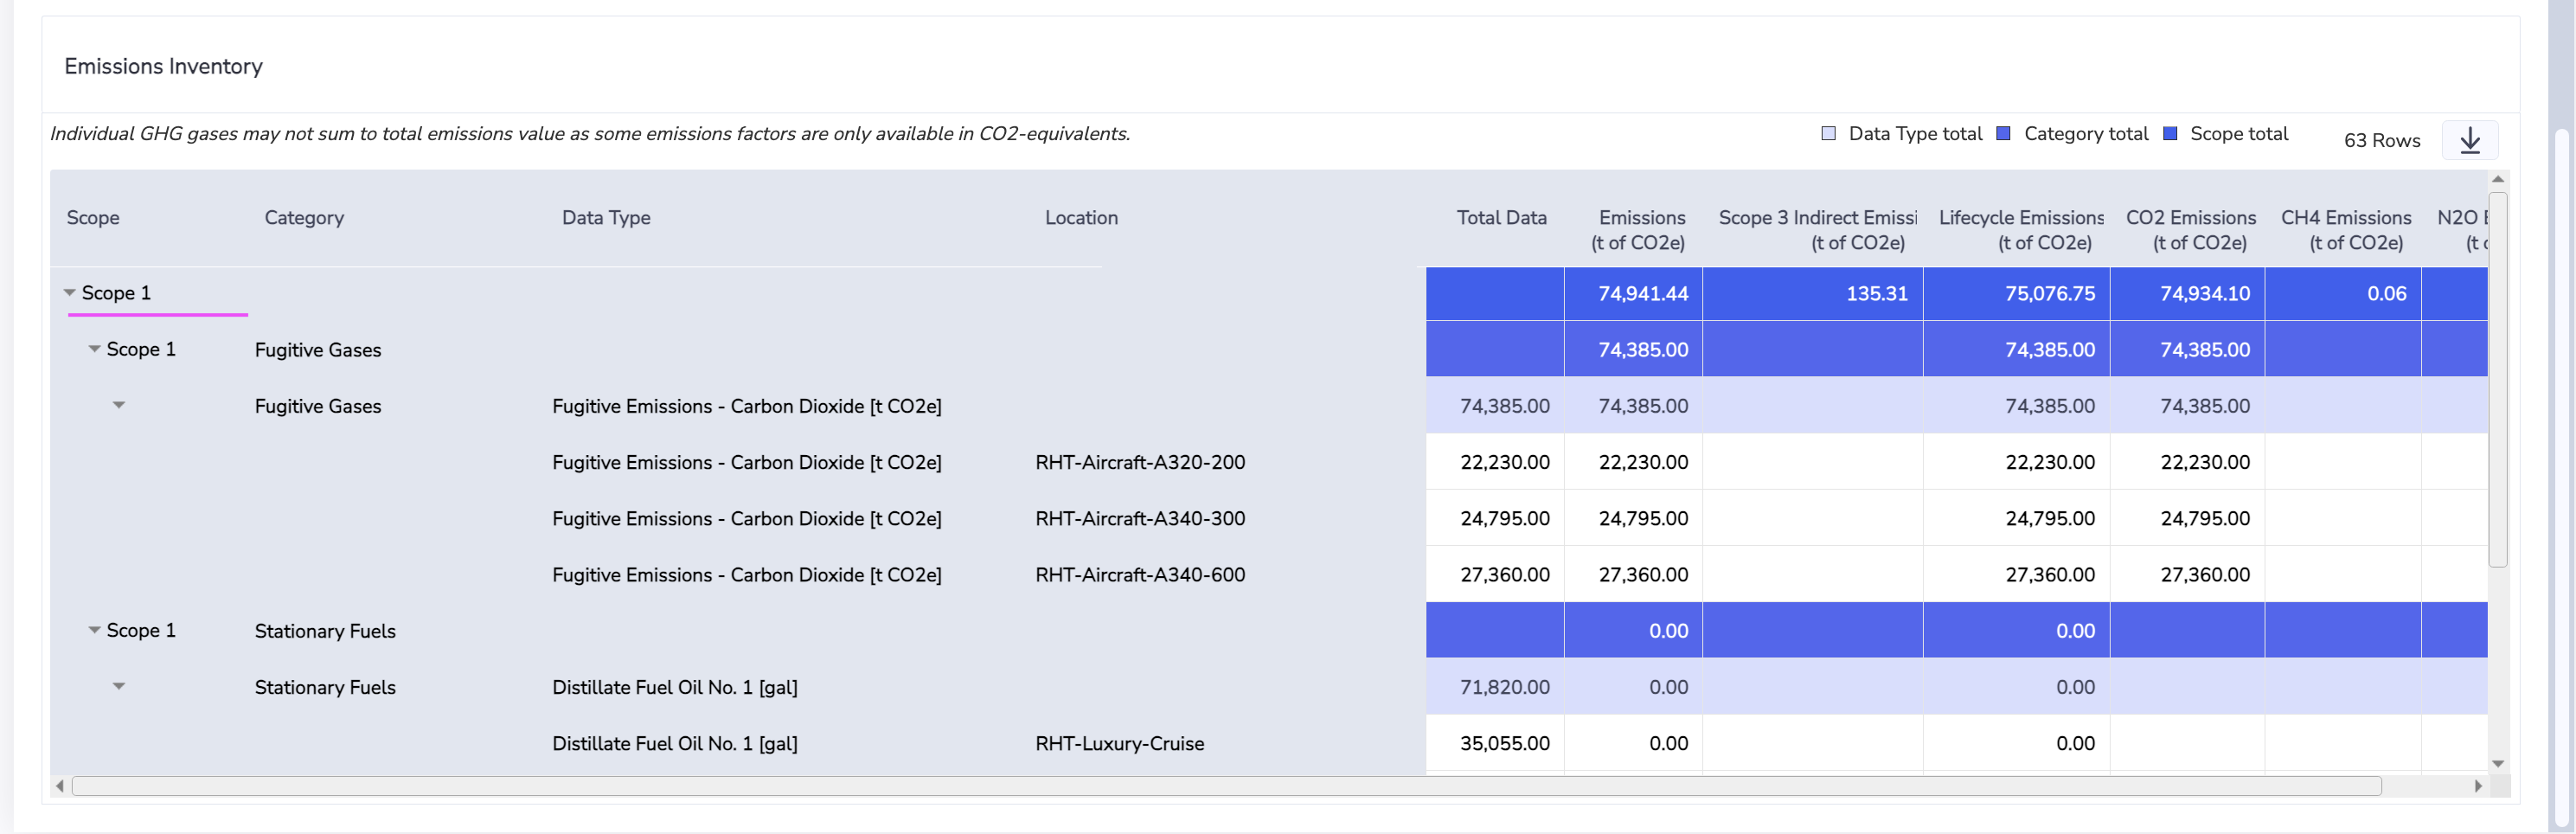
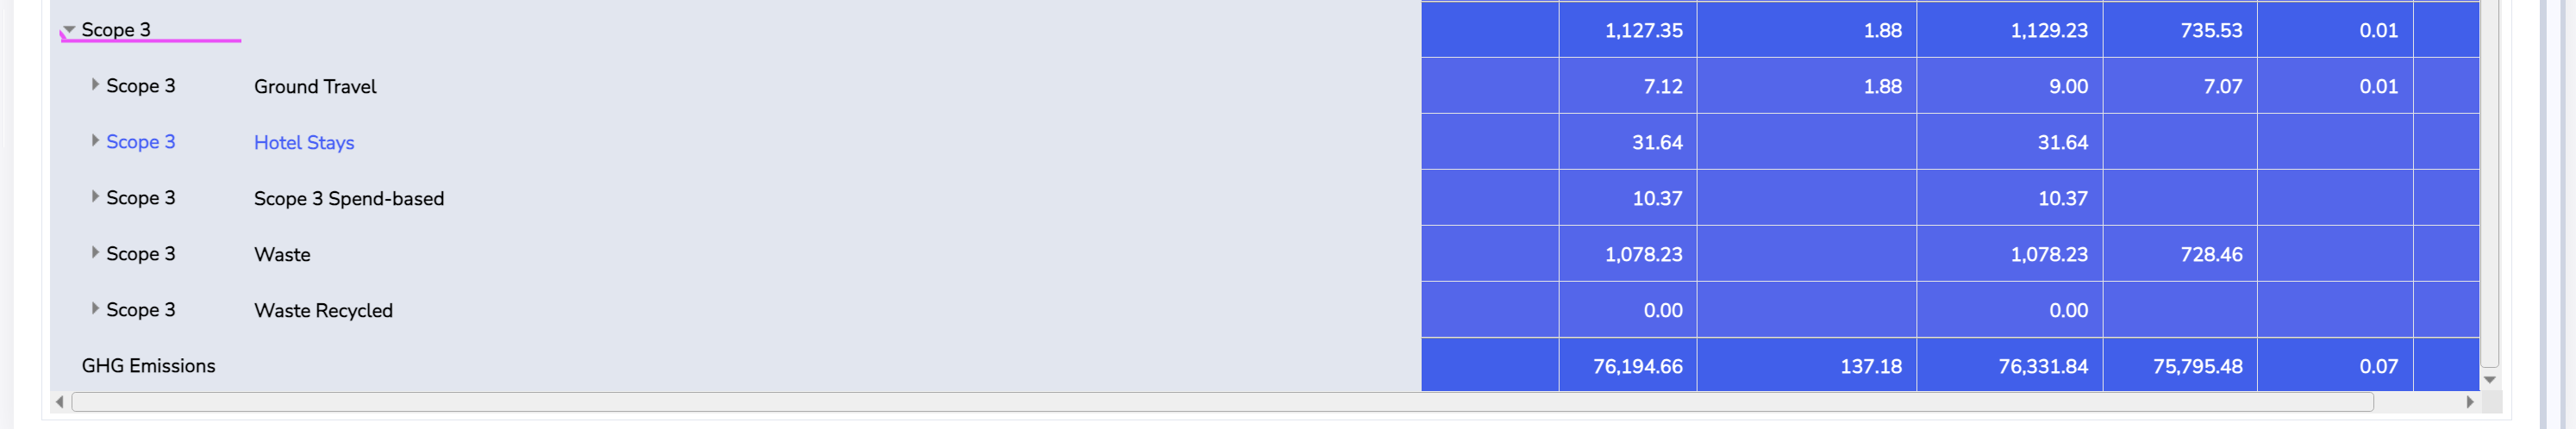
Detailed tables for Scope 1, Scope 2, and Scope 3 are available:
Scope 1 table
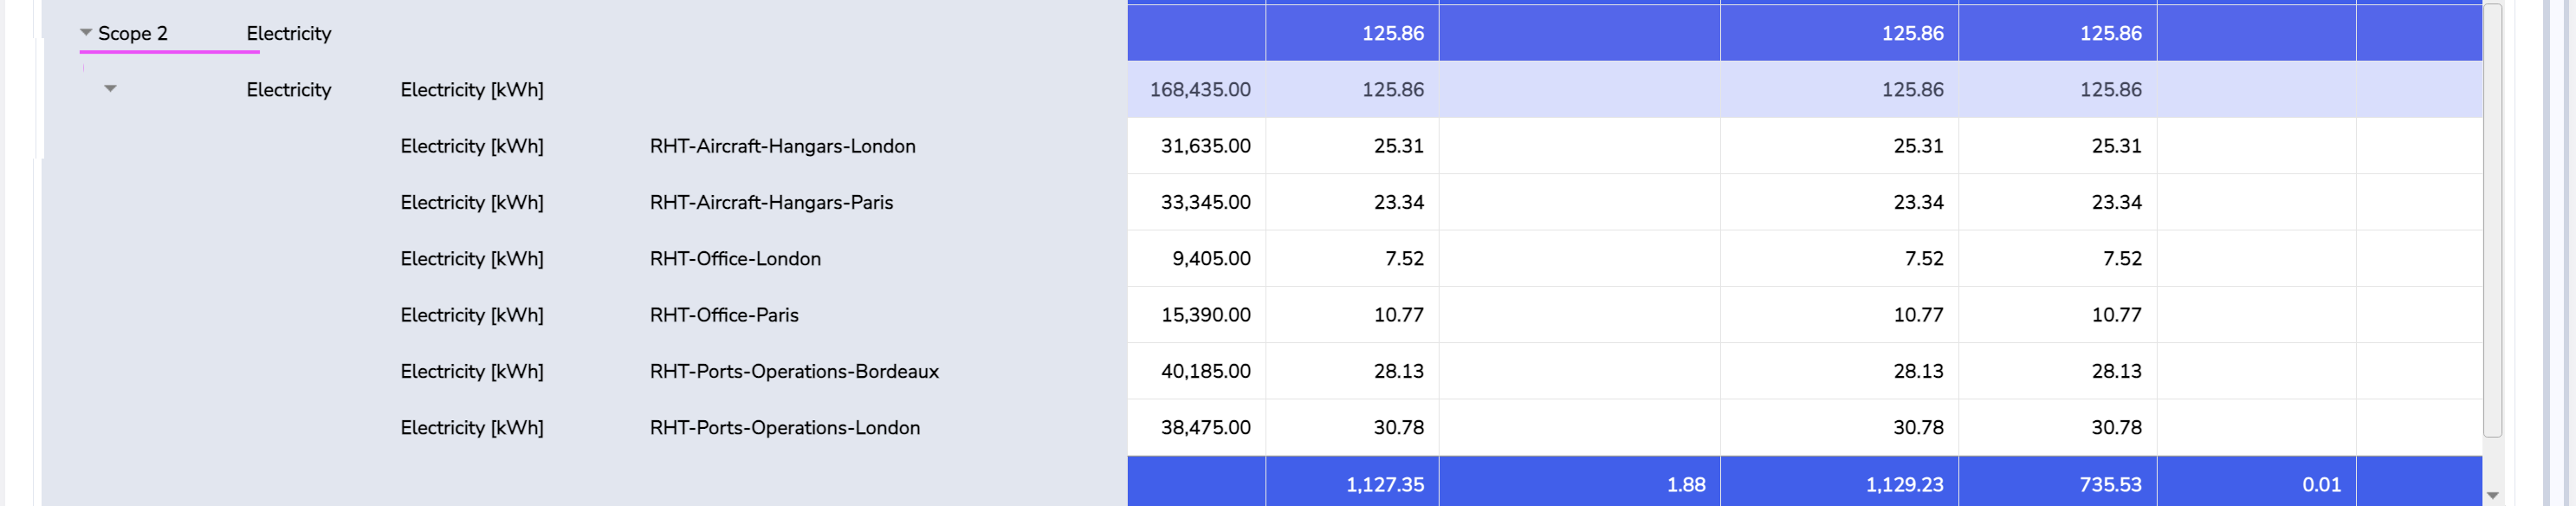
Scope 2 table
Scope 3 table
3.6 Custom account styles and mapping
The dashboard displays how custom account styles are mapped to corresponding accounts.
4. Custom emission factors
4.1 Create custom emission factor
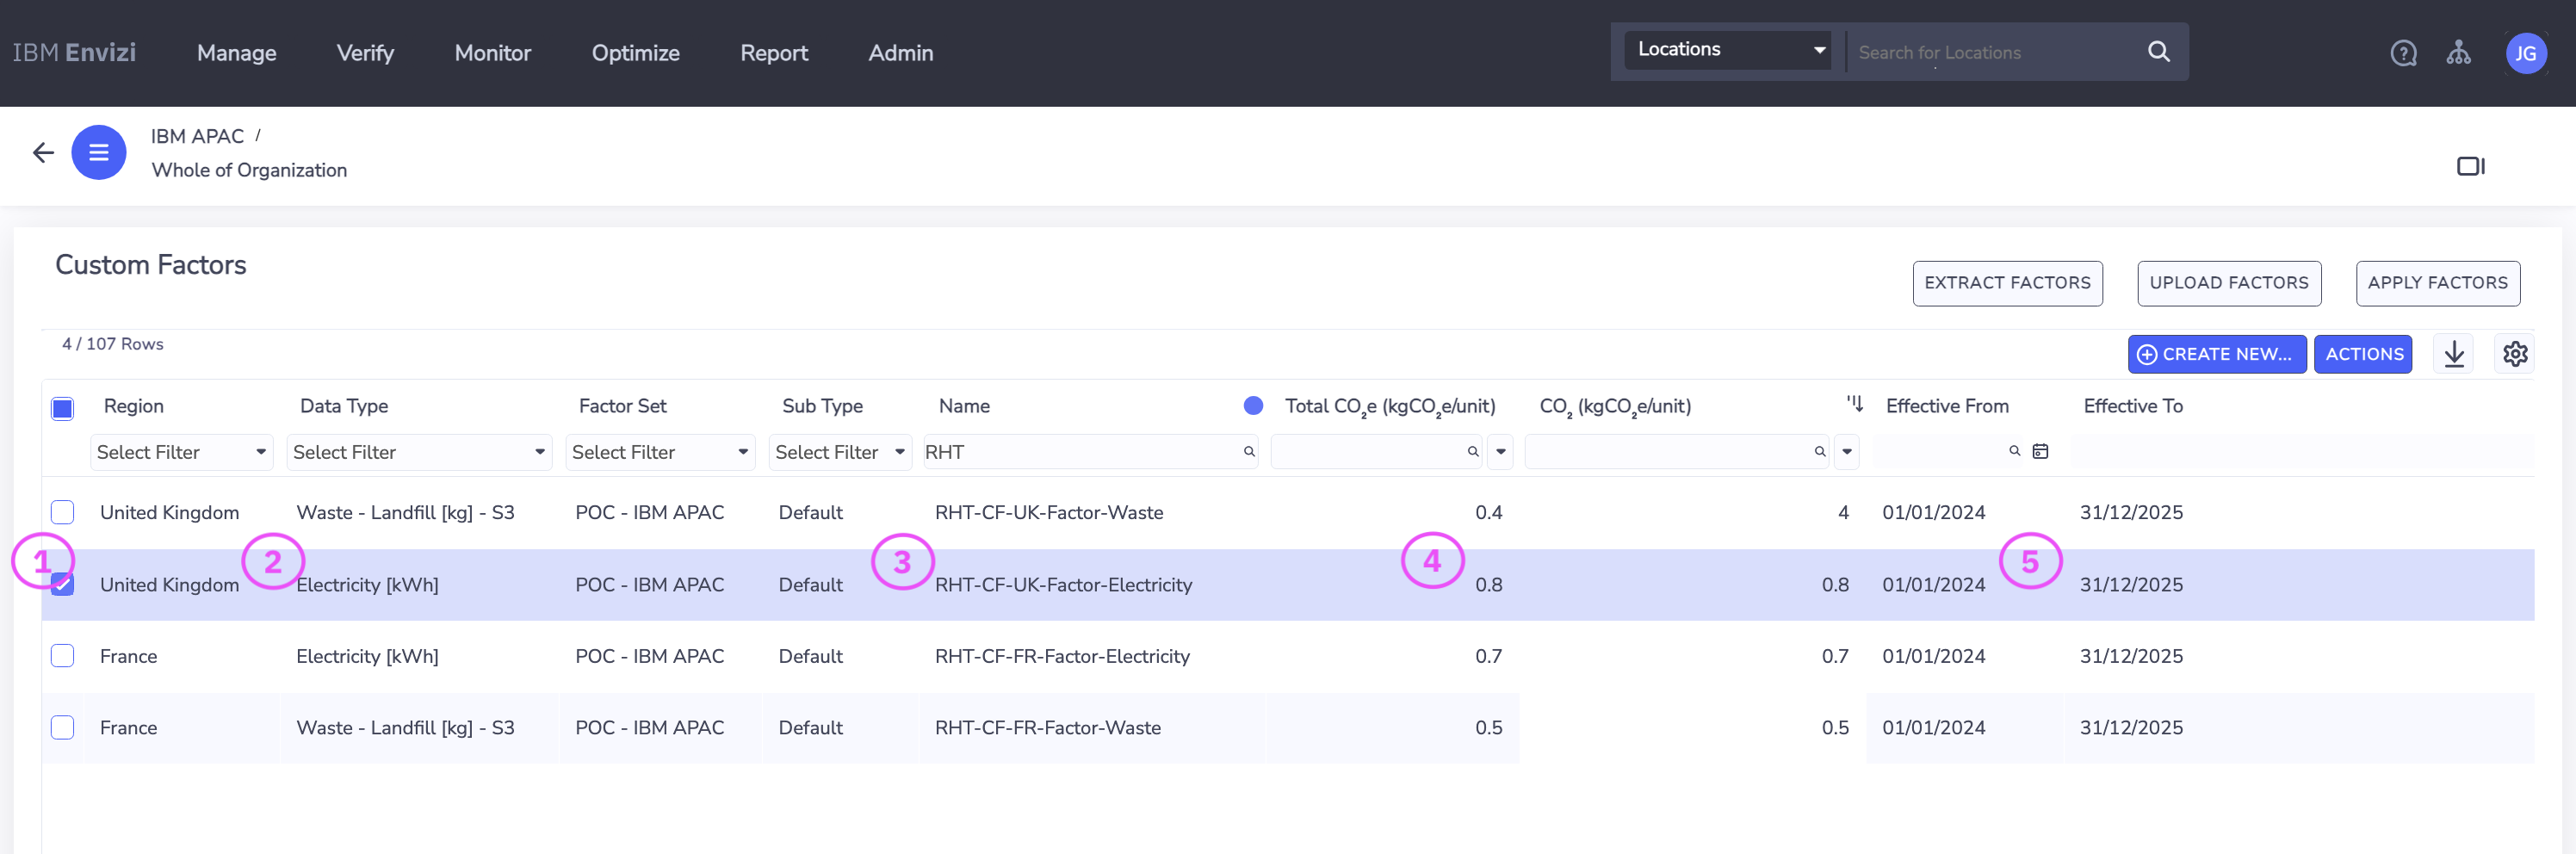
Create the following four custom factors.
Key fields to note:
- Region of the custom factor (1)
- Data type (2)
- Factor name (3)
- Total emission value of the data type (4)
Effective period (5)
4.2 View the factor mapping
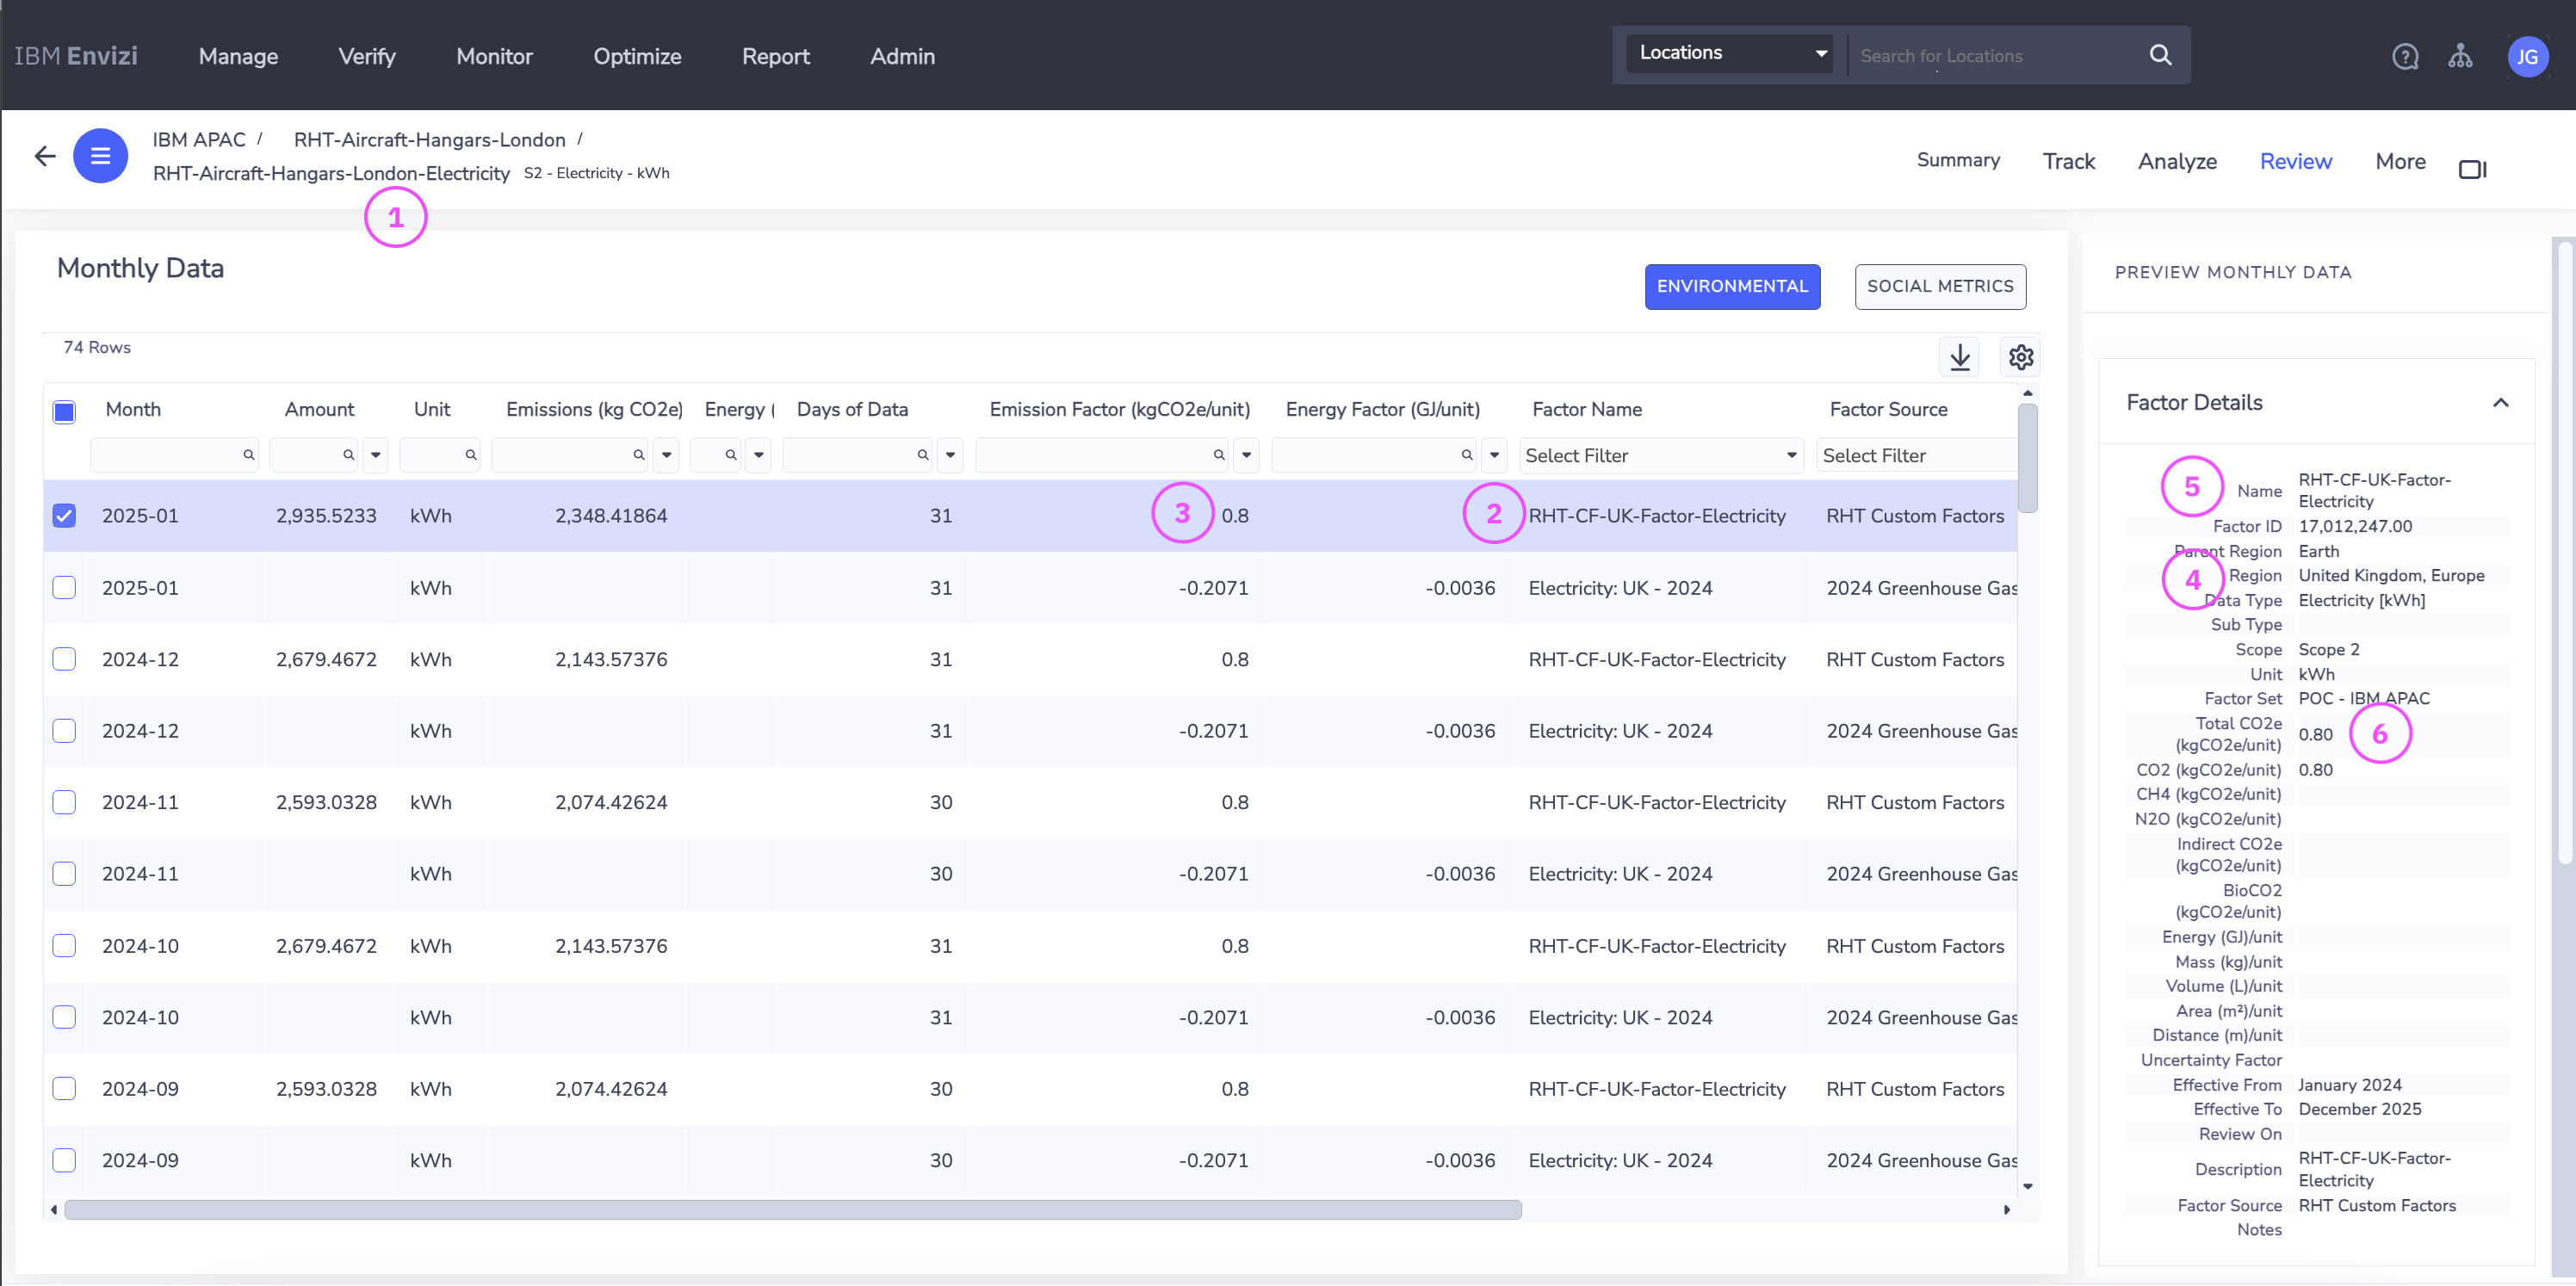
The created emission factor is mapped to the Account based on Region and Effective date.
Open the
Account > Monthly Datascreen for the accountRHT-Aircraft-Hangars-London-Electricity.Observe the mapping:
Account:
RHT-Aircraft-Hangars-London-Electricity(1)- Emission Factor:
RHT-CF-UK-Factor-Electricity(2), (5) - Factor value: 0.8 (3), (6)
Region: UK (4)
Note: A weekly server refresh is required for the custom factor to take effect.
5. Programs and actions
Programs, action plans, and actions can be created for decarbonization as follows:
5.1 Create programs and actions
Create the following program.
Create an action plan for the program.
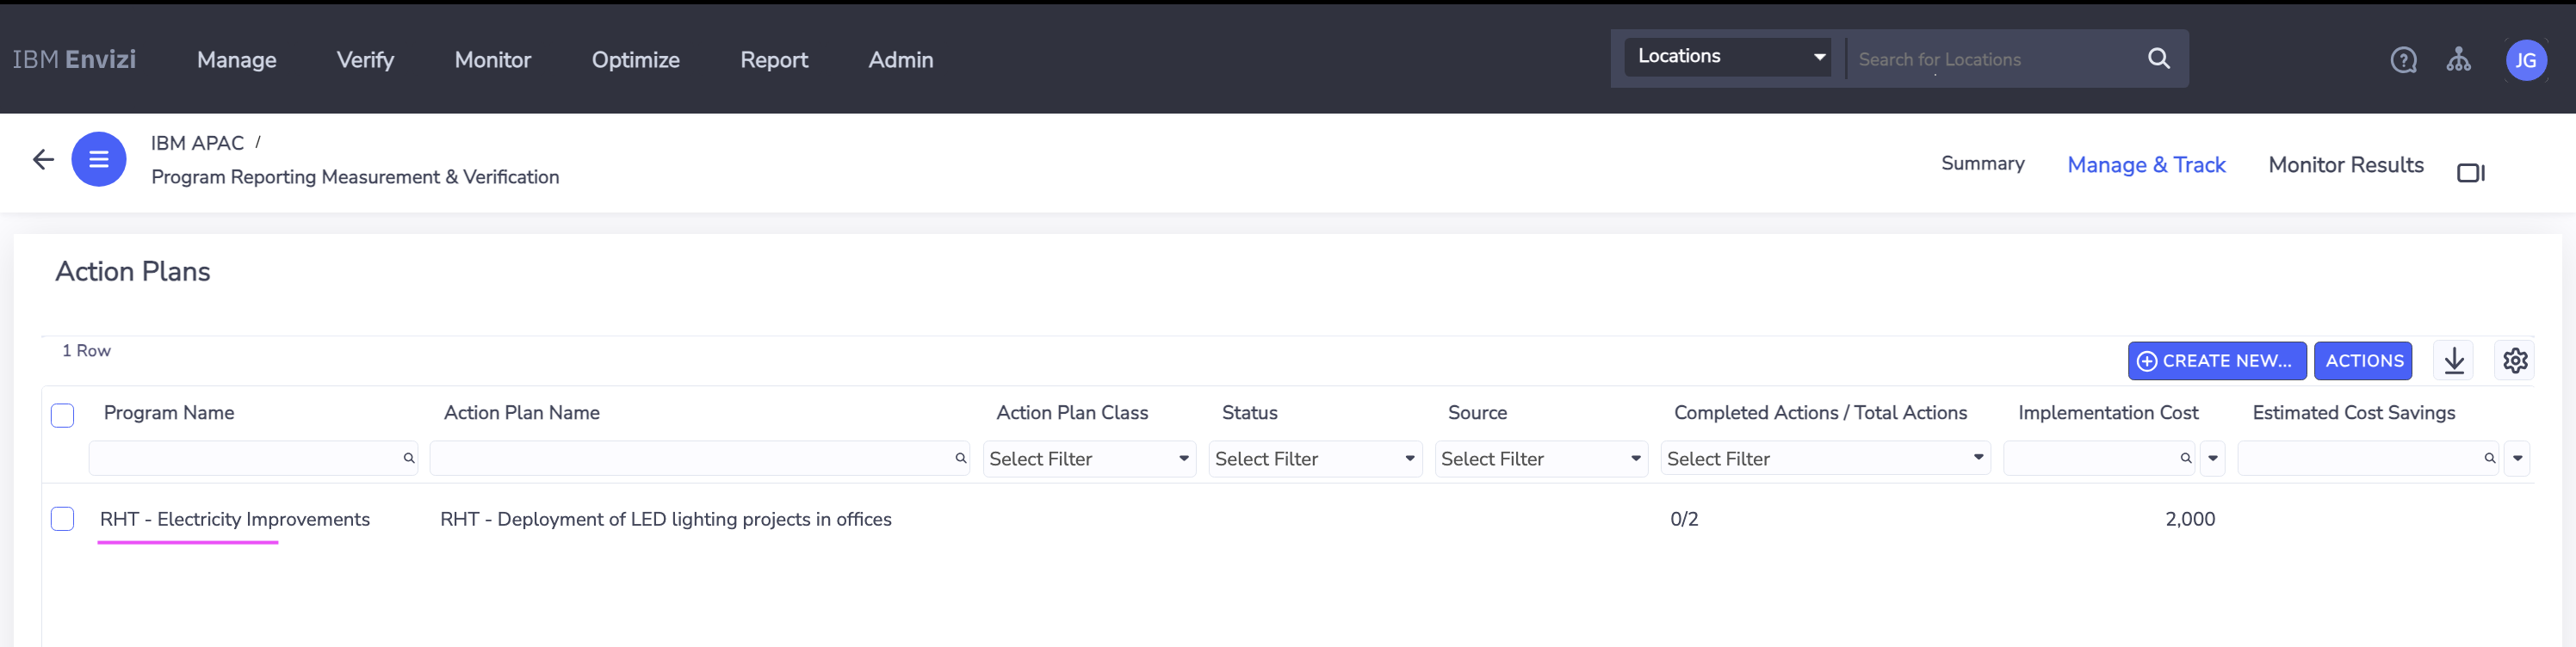
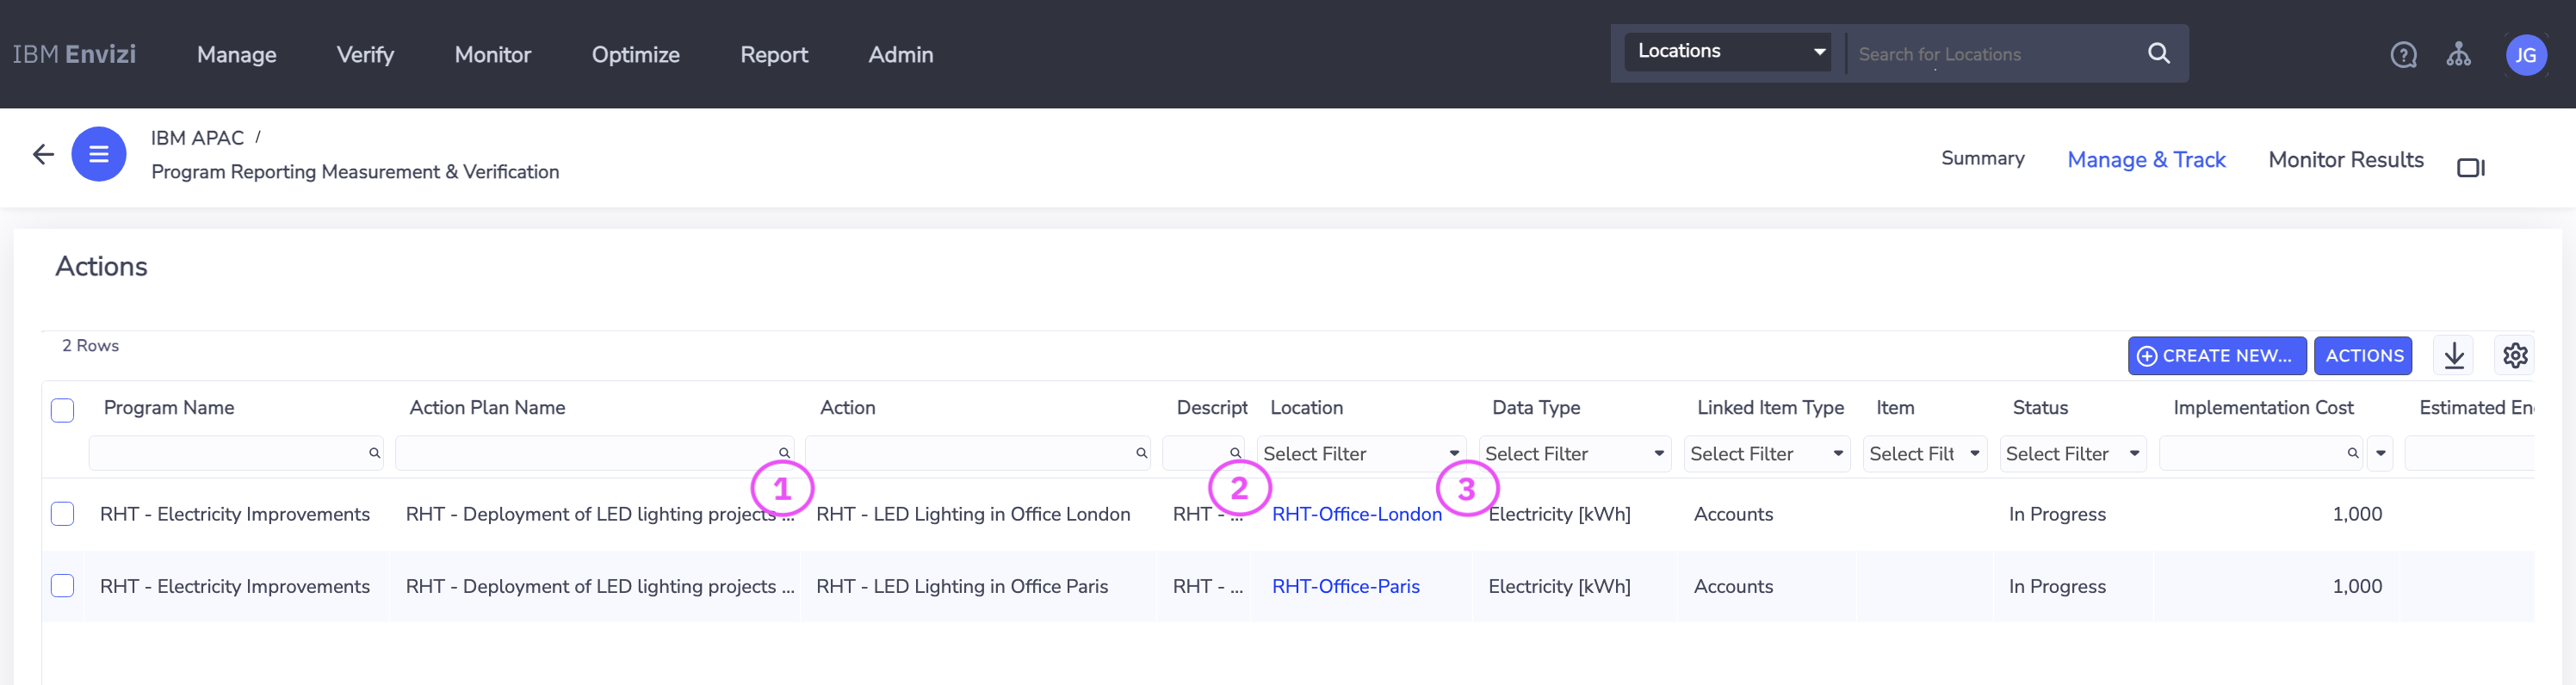
Create actions for the action plan.
Key fields to note:
- Action name (1)
- Associated location (2)
Data type (3)
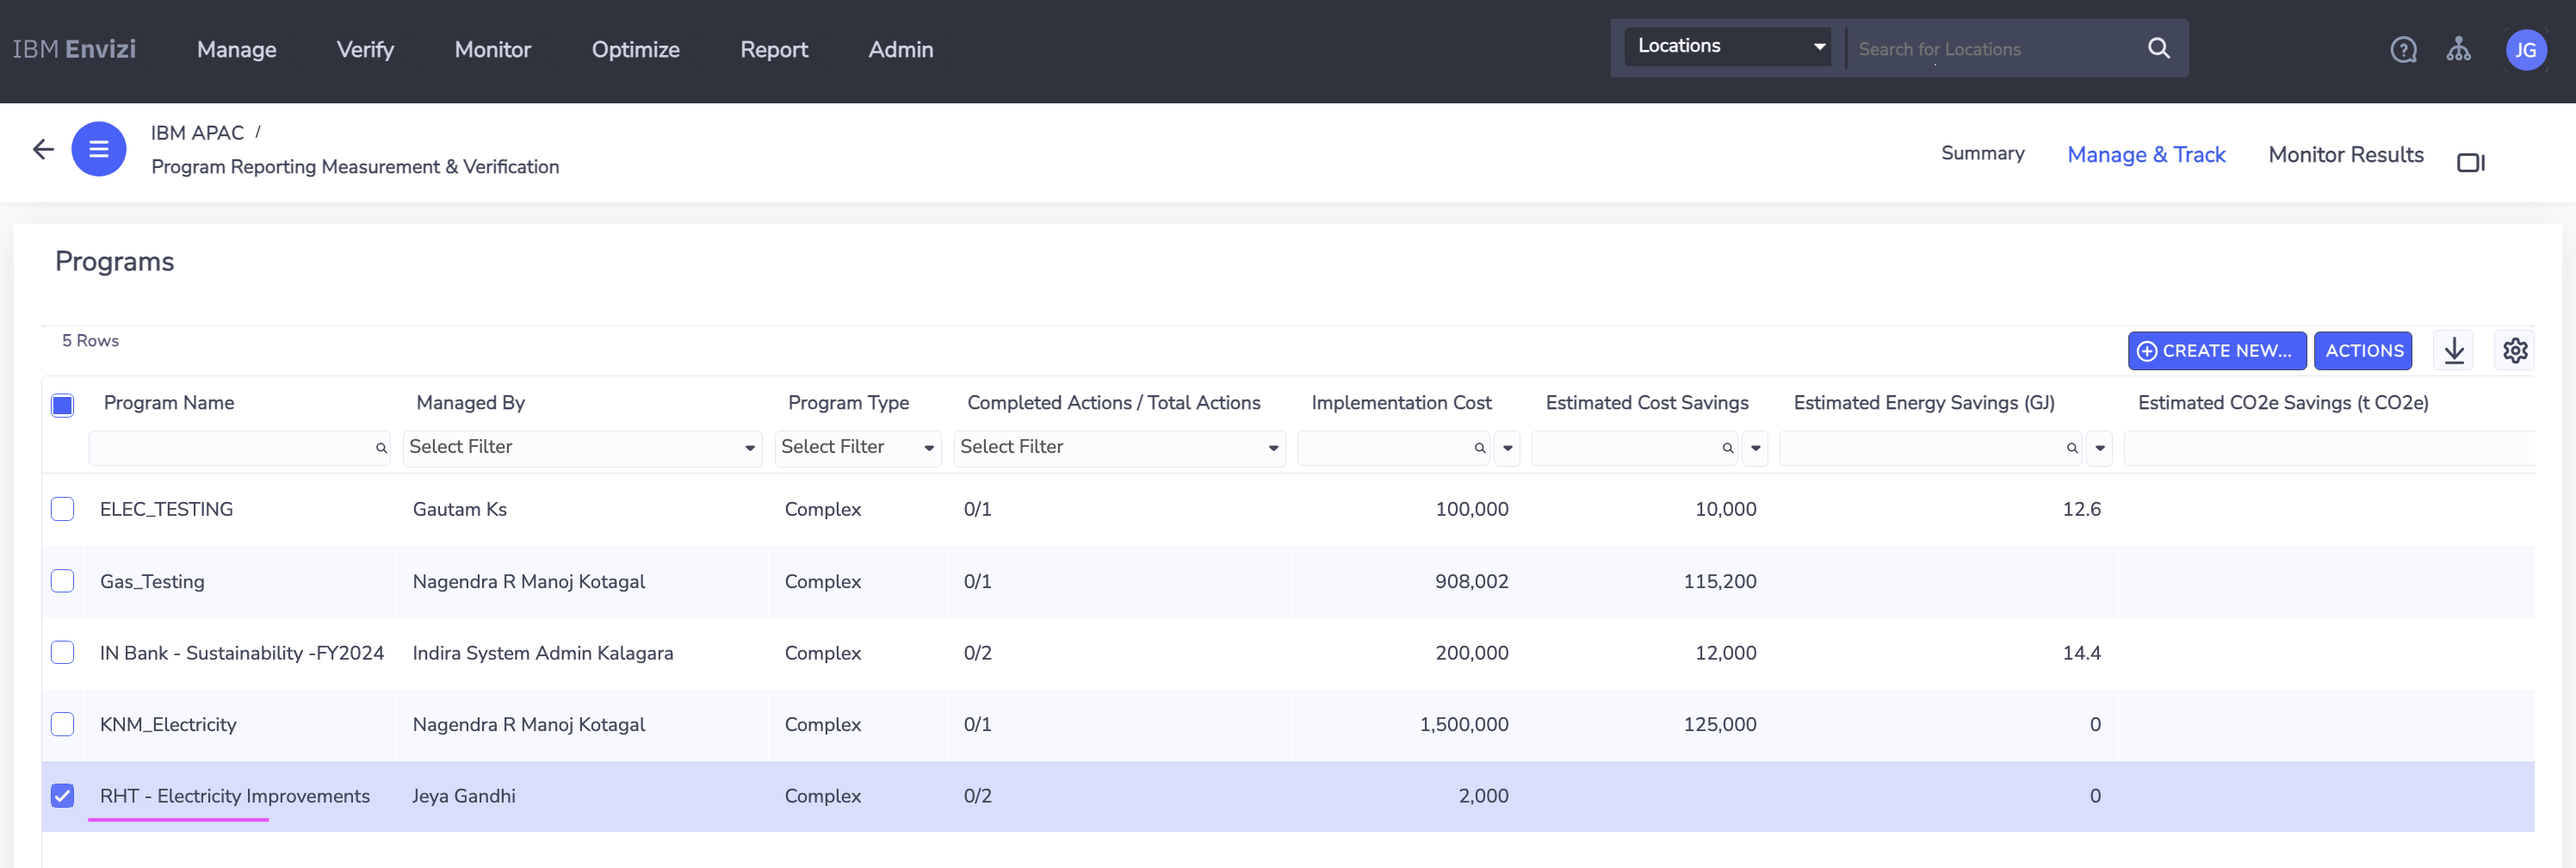
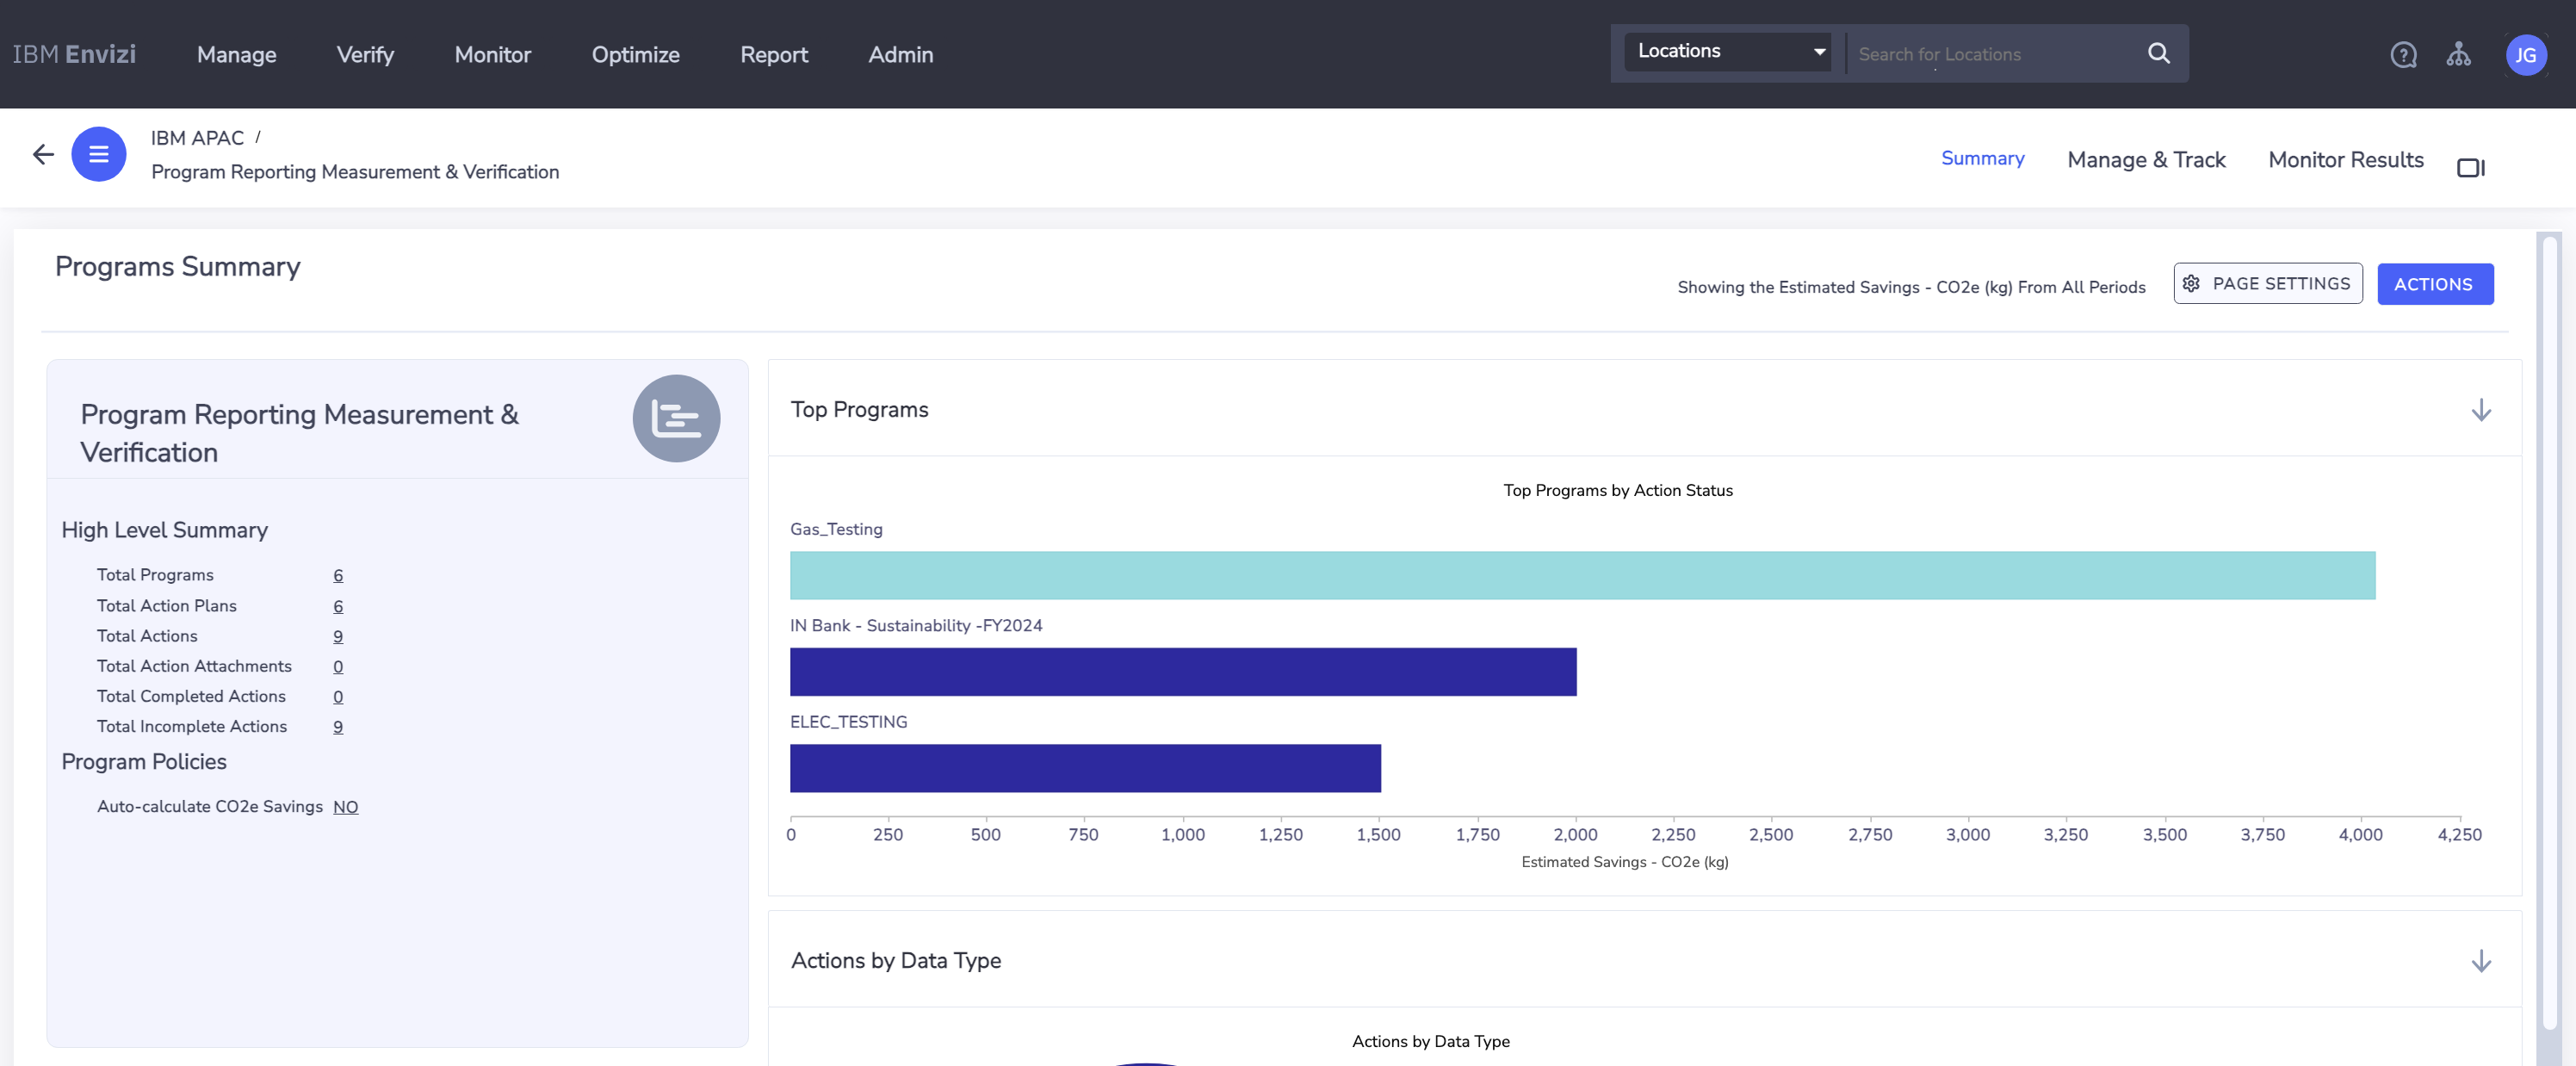
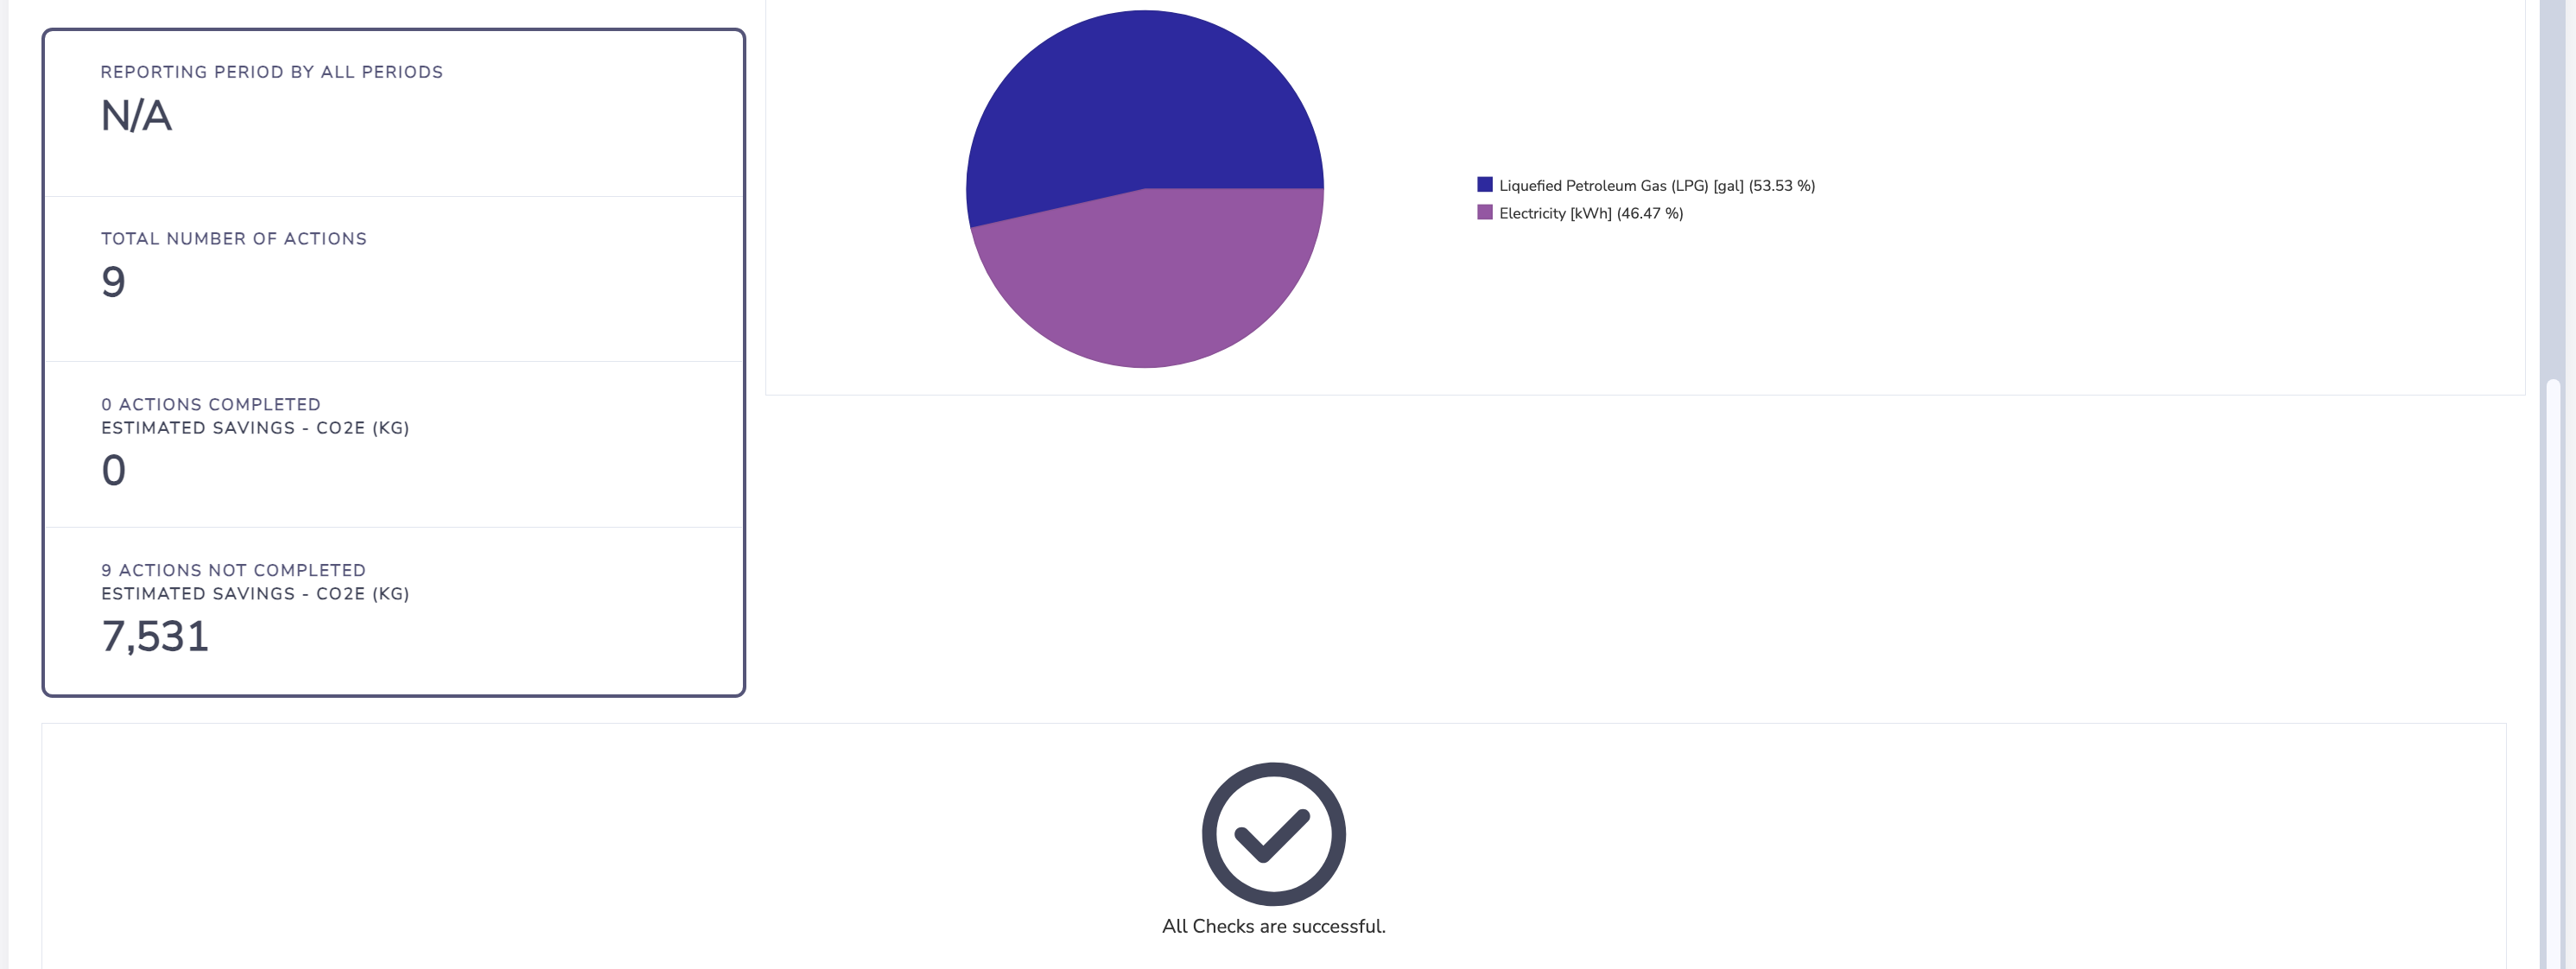
5.2 View programs summary
The Program Summary page shows various programs and their status.
6. Target setting and tracking
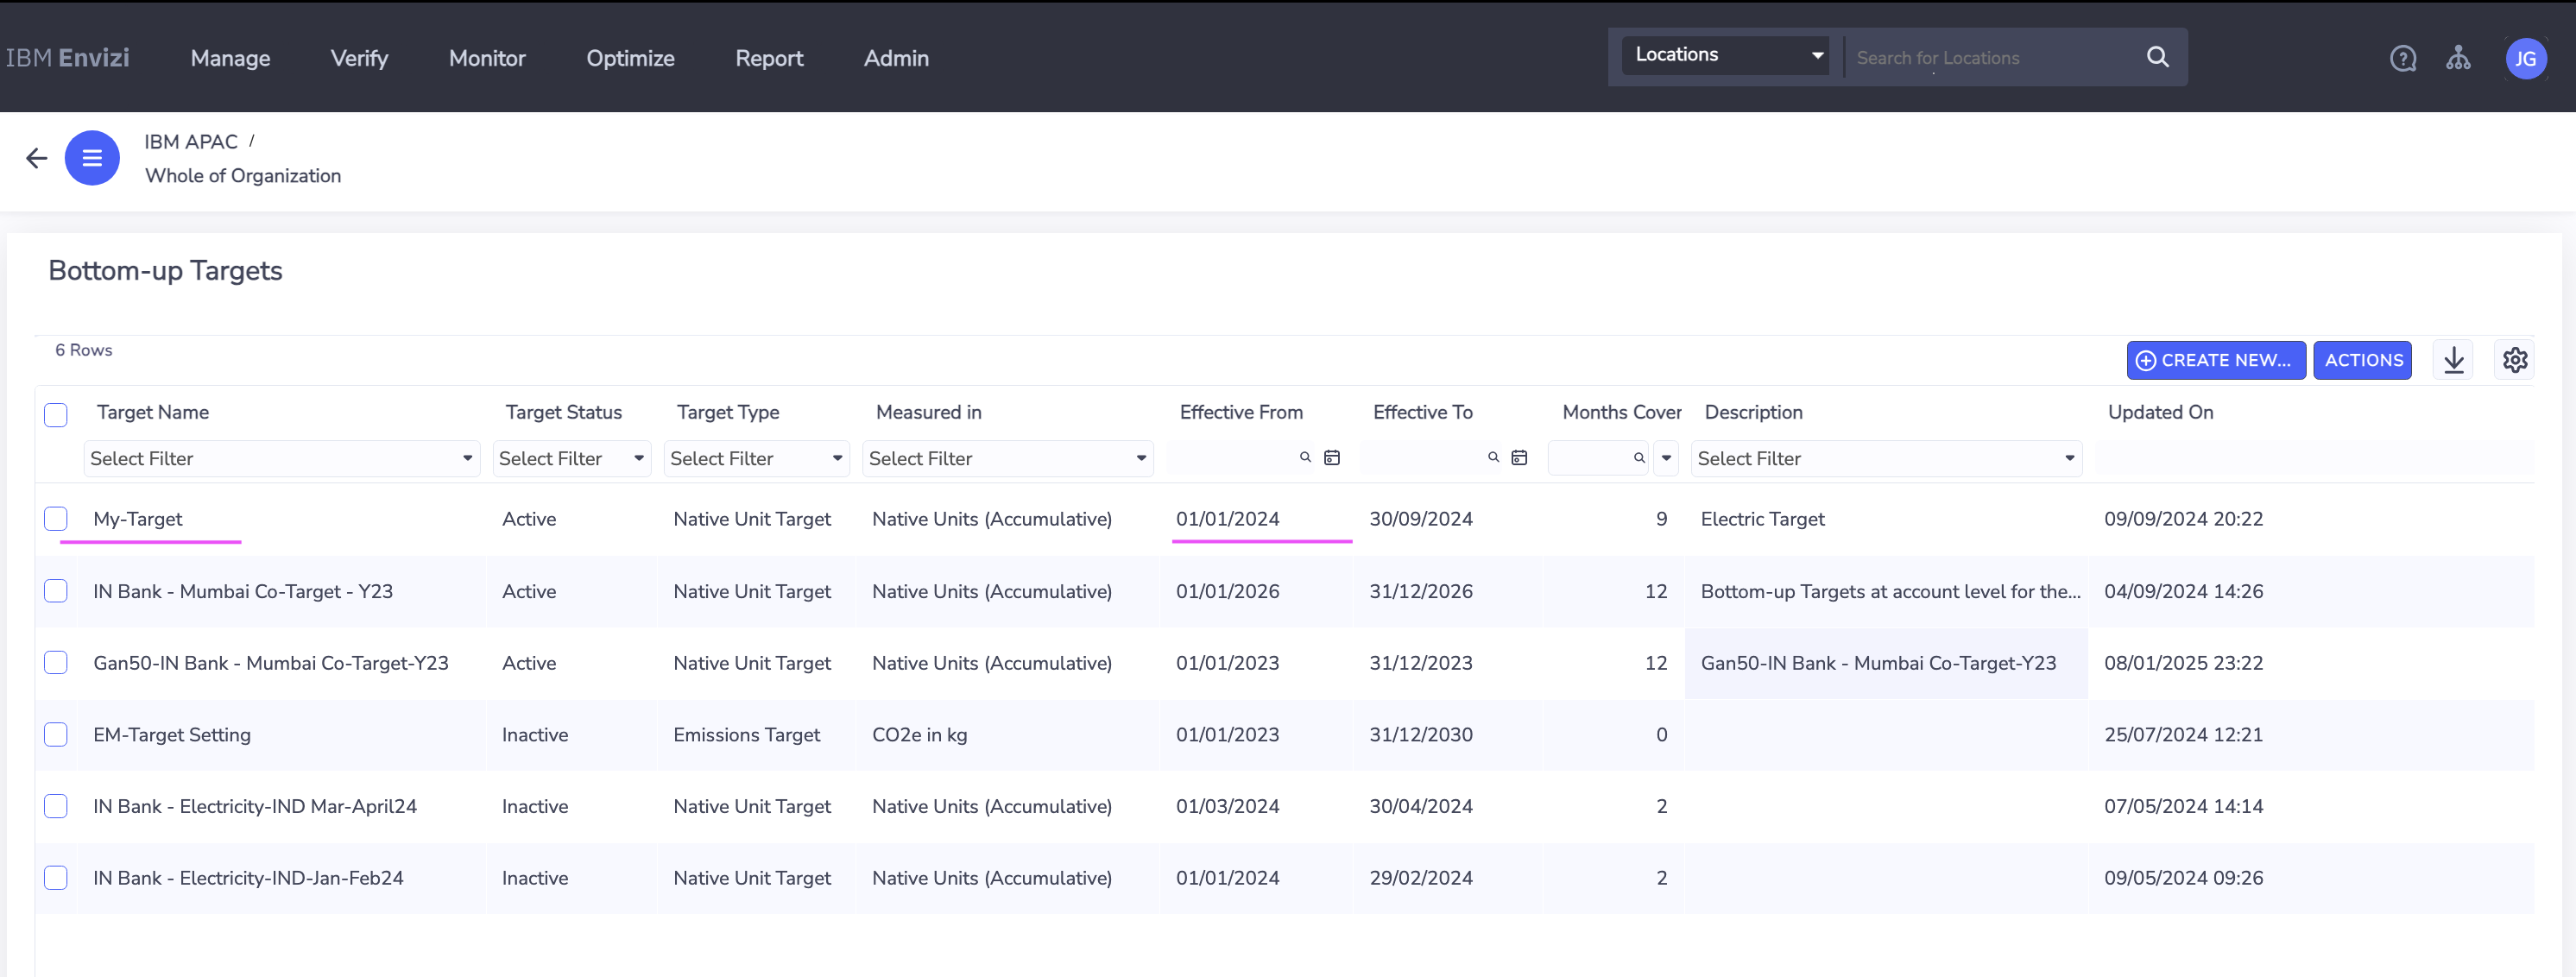
6.1 Create targets
Set up the target.
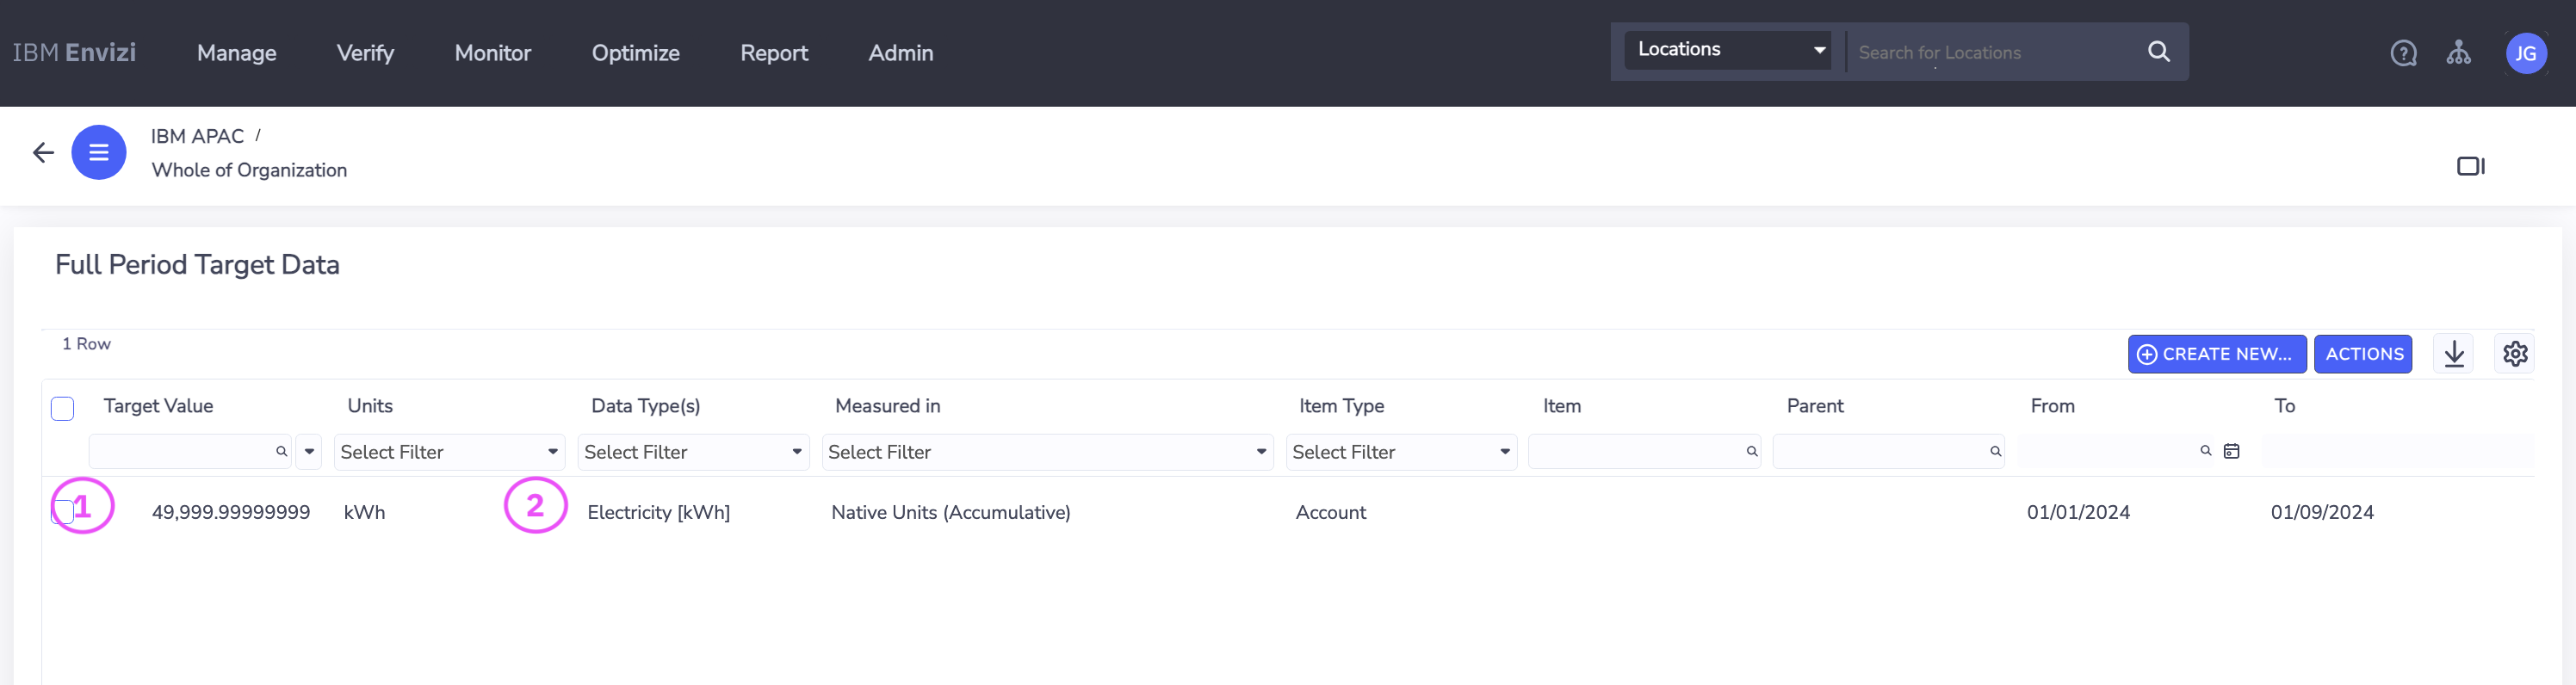
Enter full-period target data.
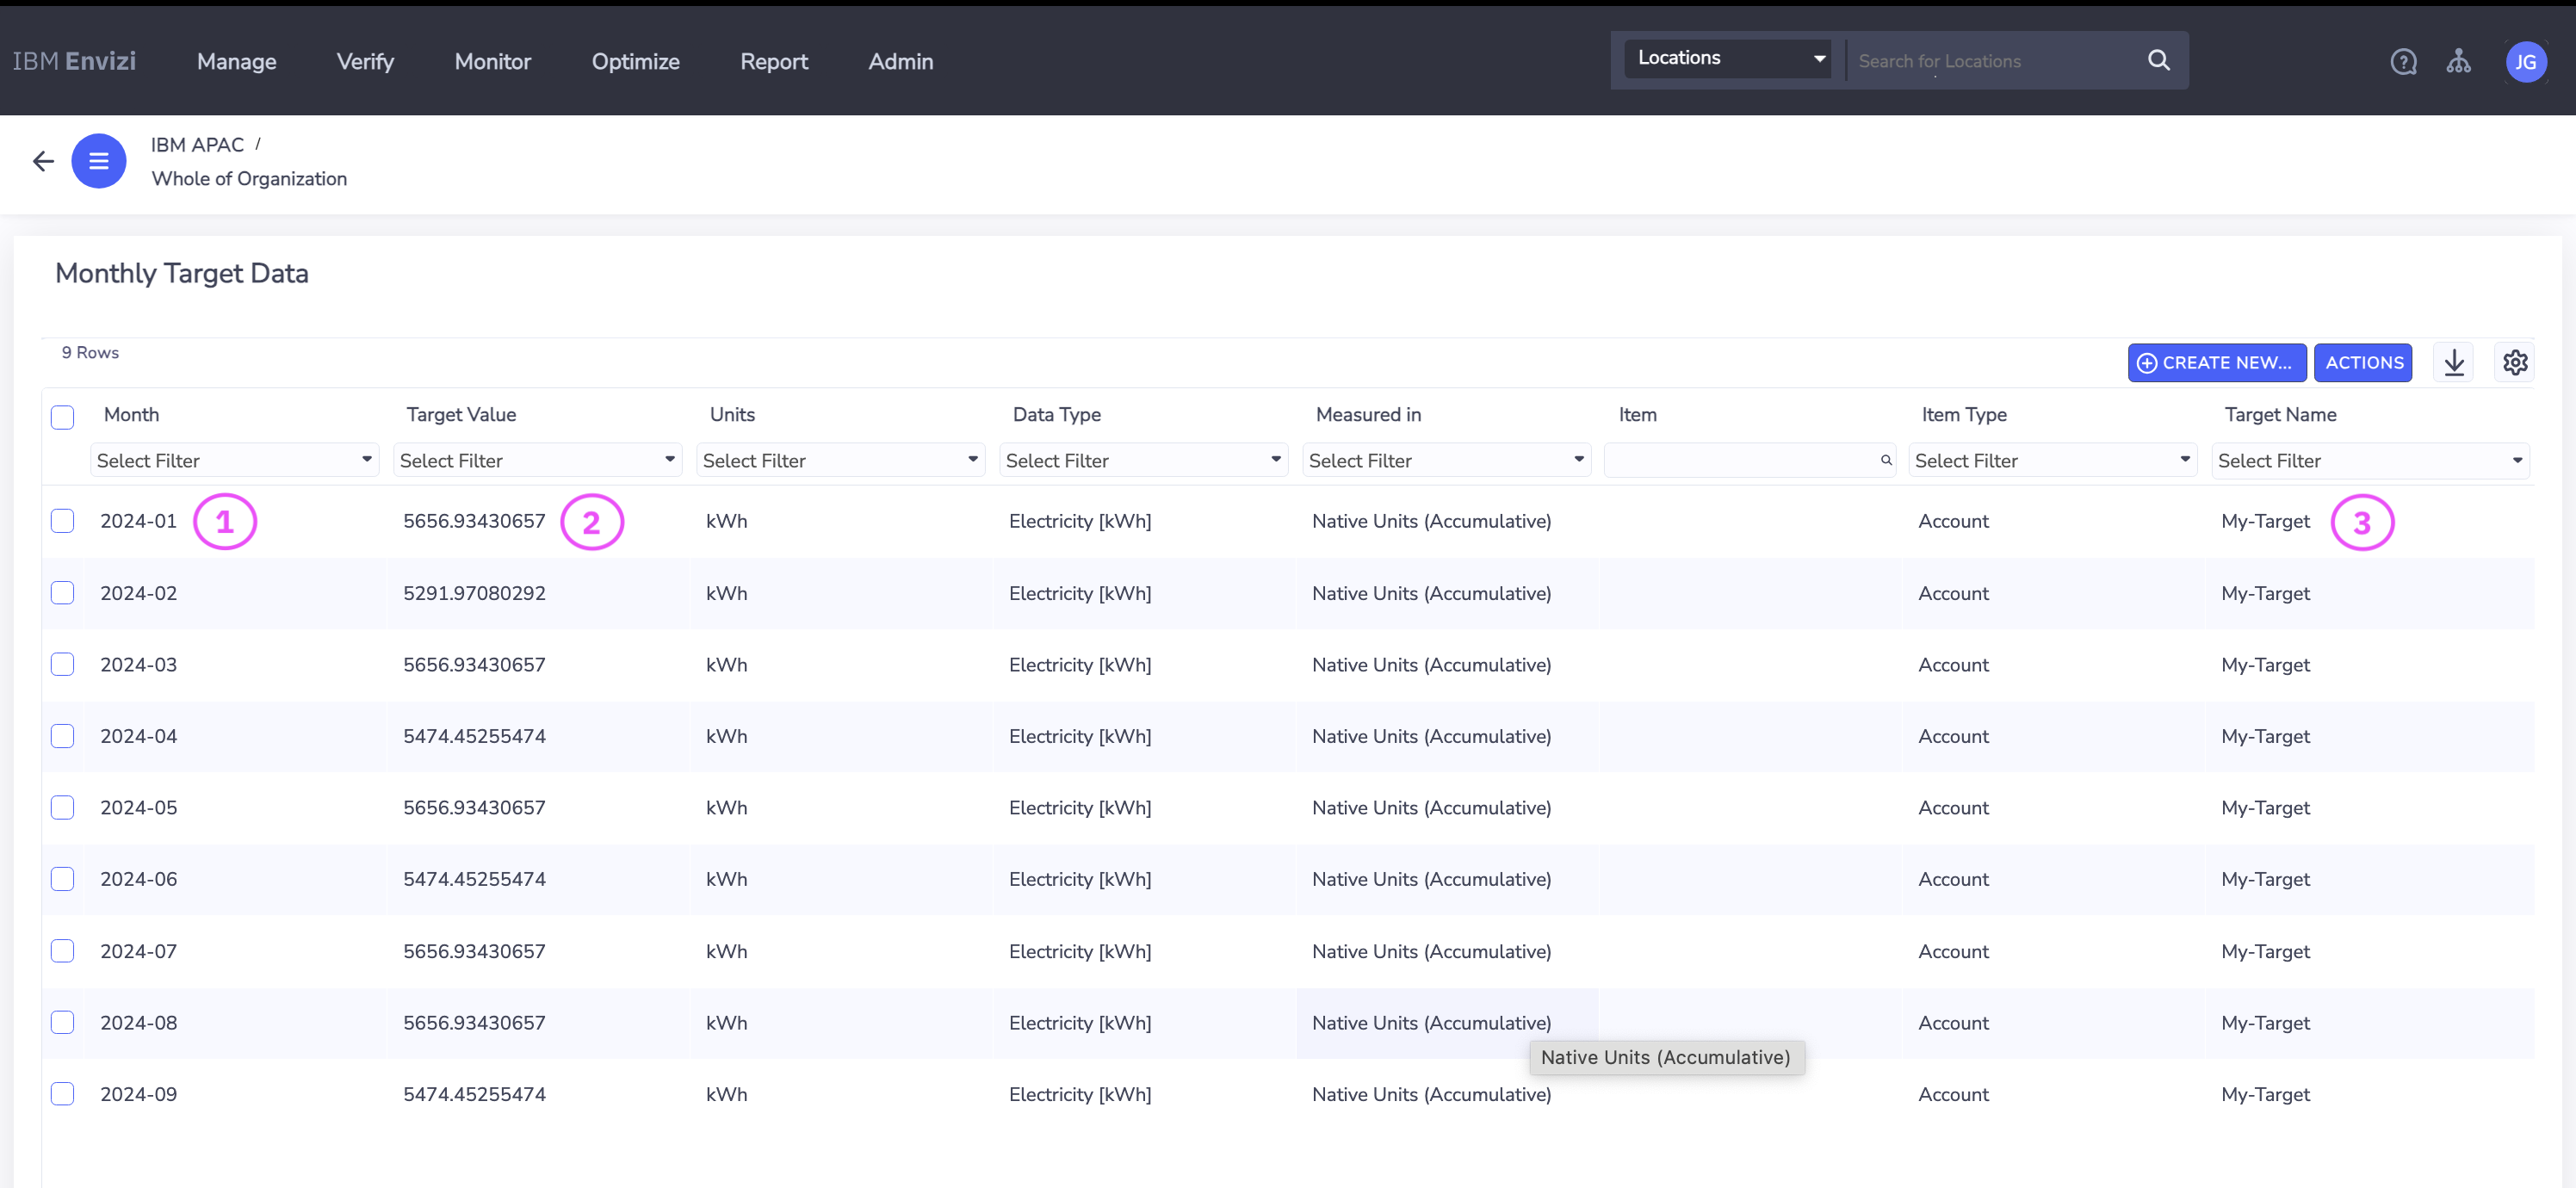
Add monthly target data.
7. Sustainability reporting manager
The Sustainability Reporting Manager helps create sustainability disclosure reports.
7.1 Create disclosure
Add a disclosure with:
- Name (1)
- Framework included (2)
- Number of questions (3)
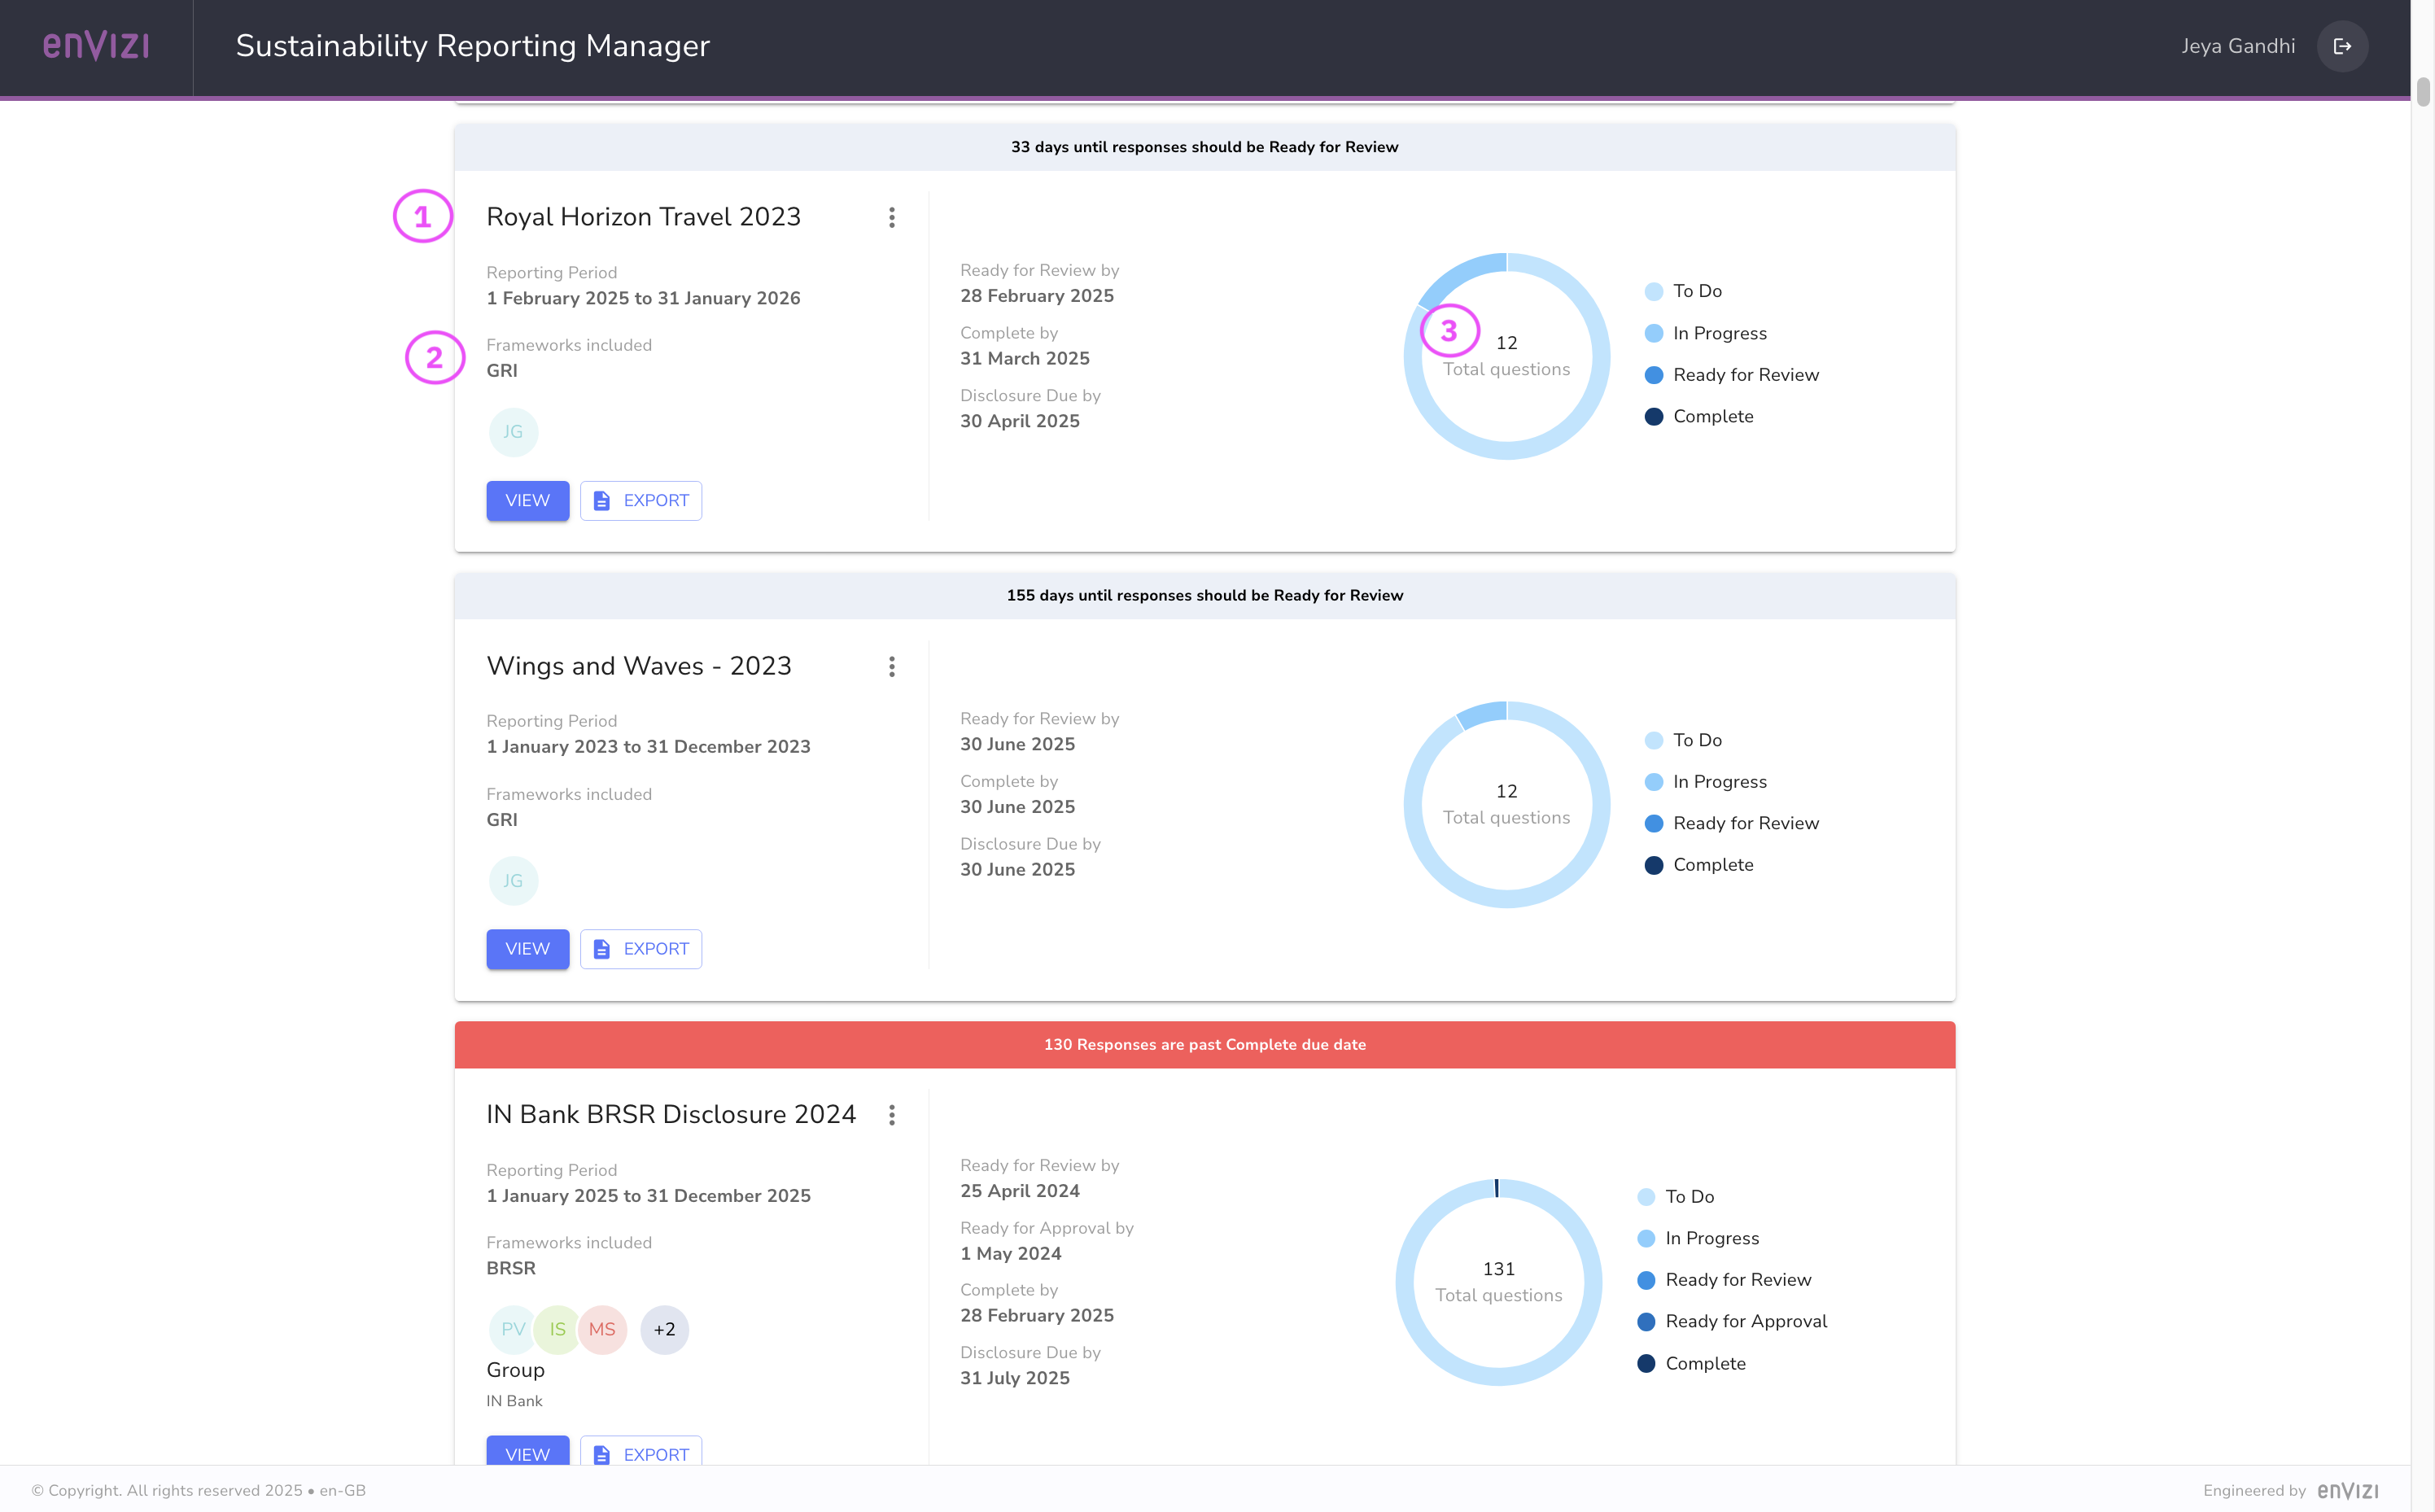
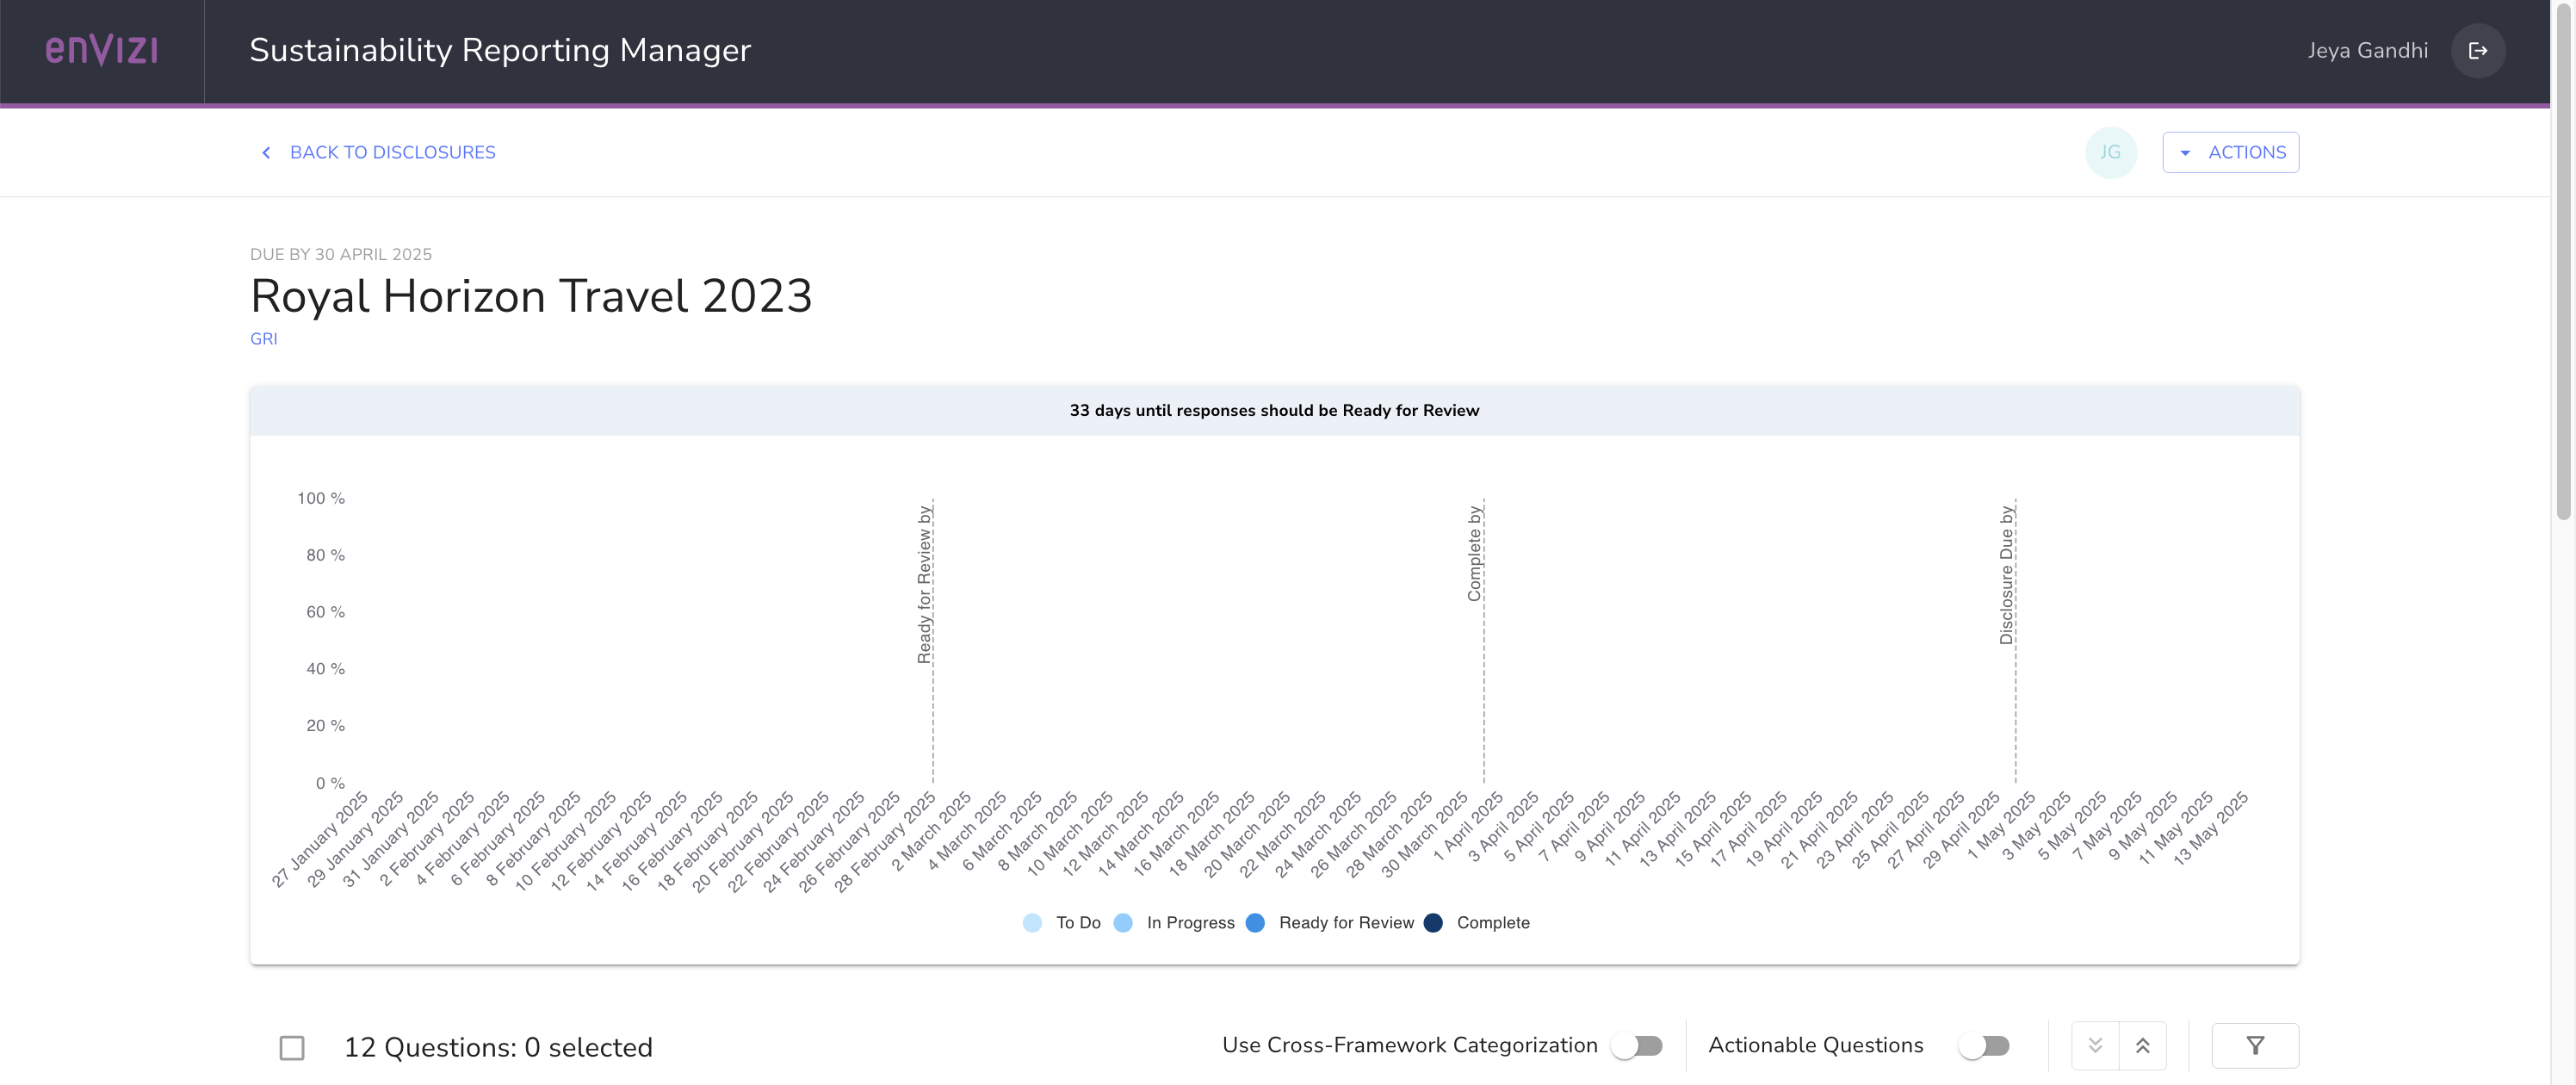
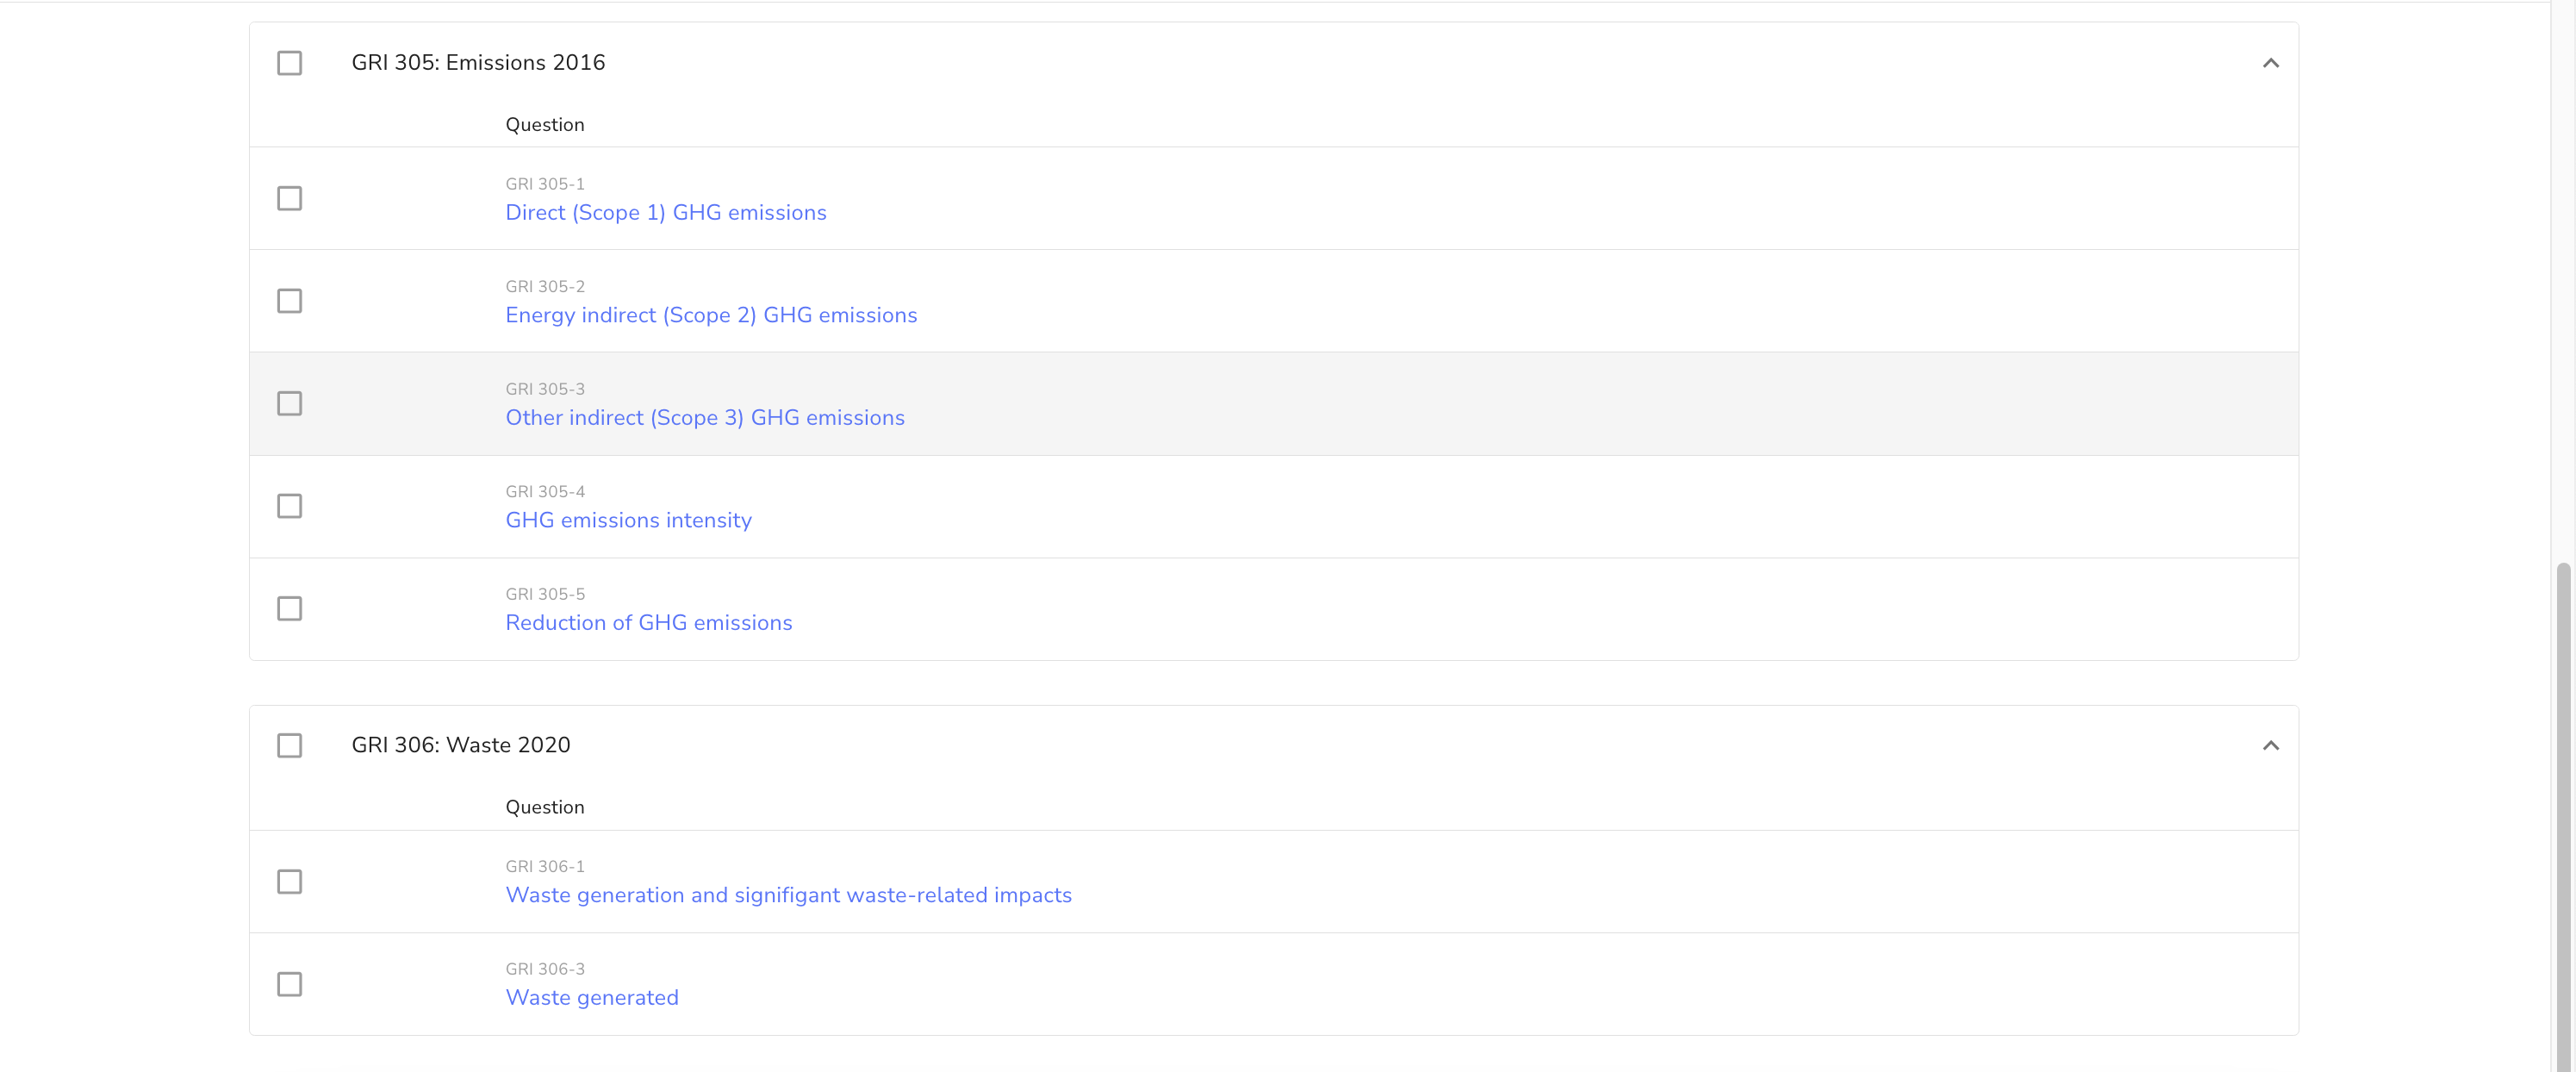
7.2 View disclosure
Displays a disclosure with 12 GRI questions.
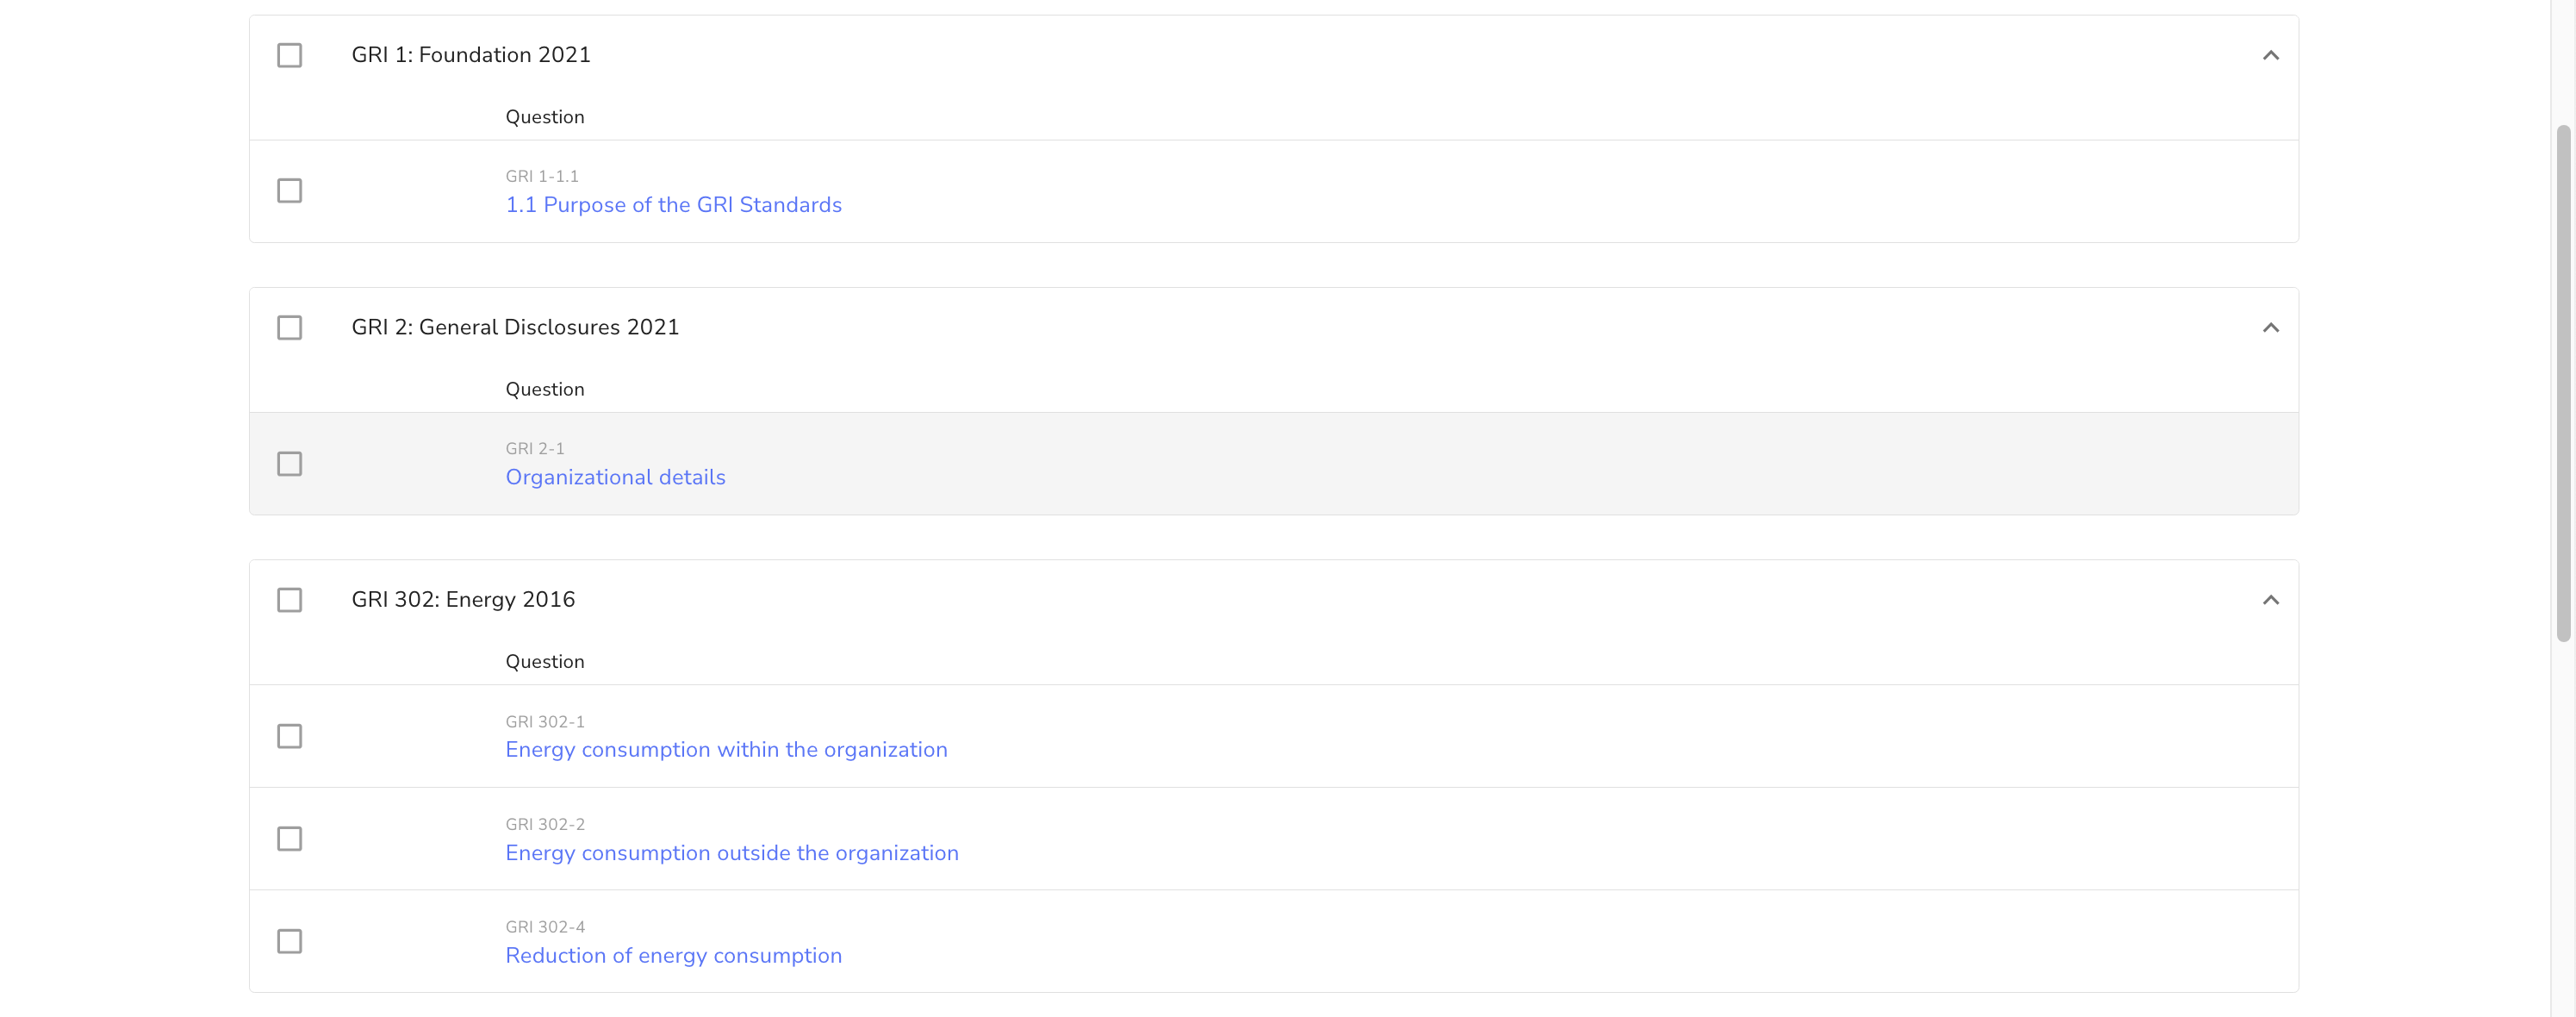
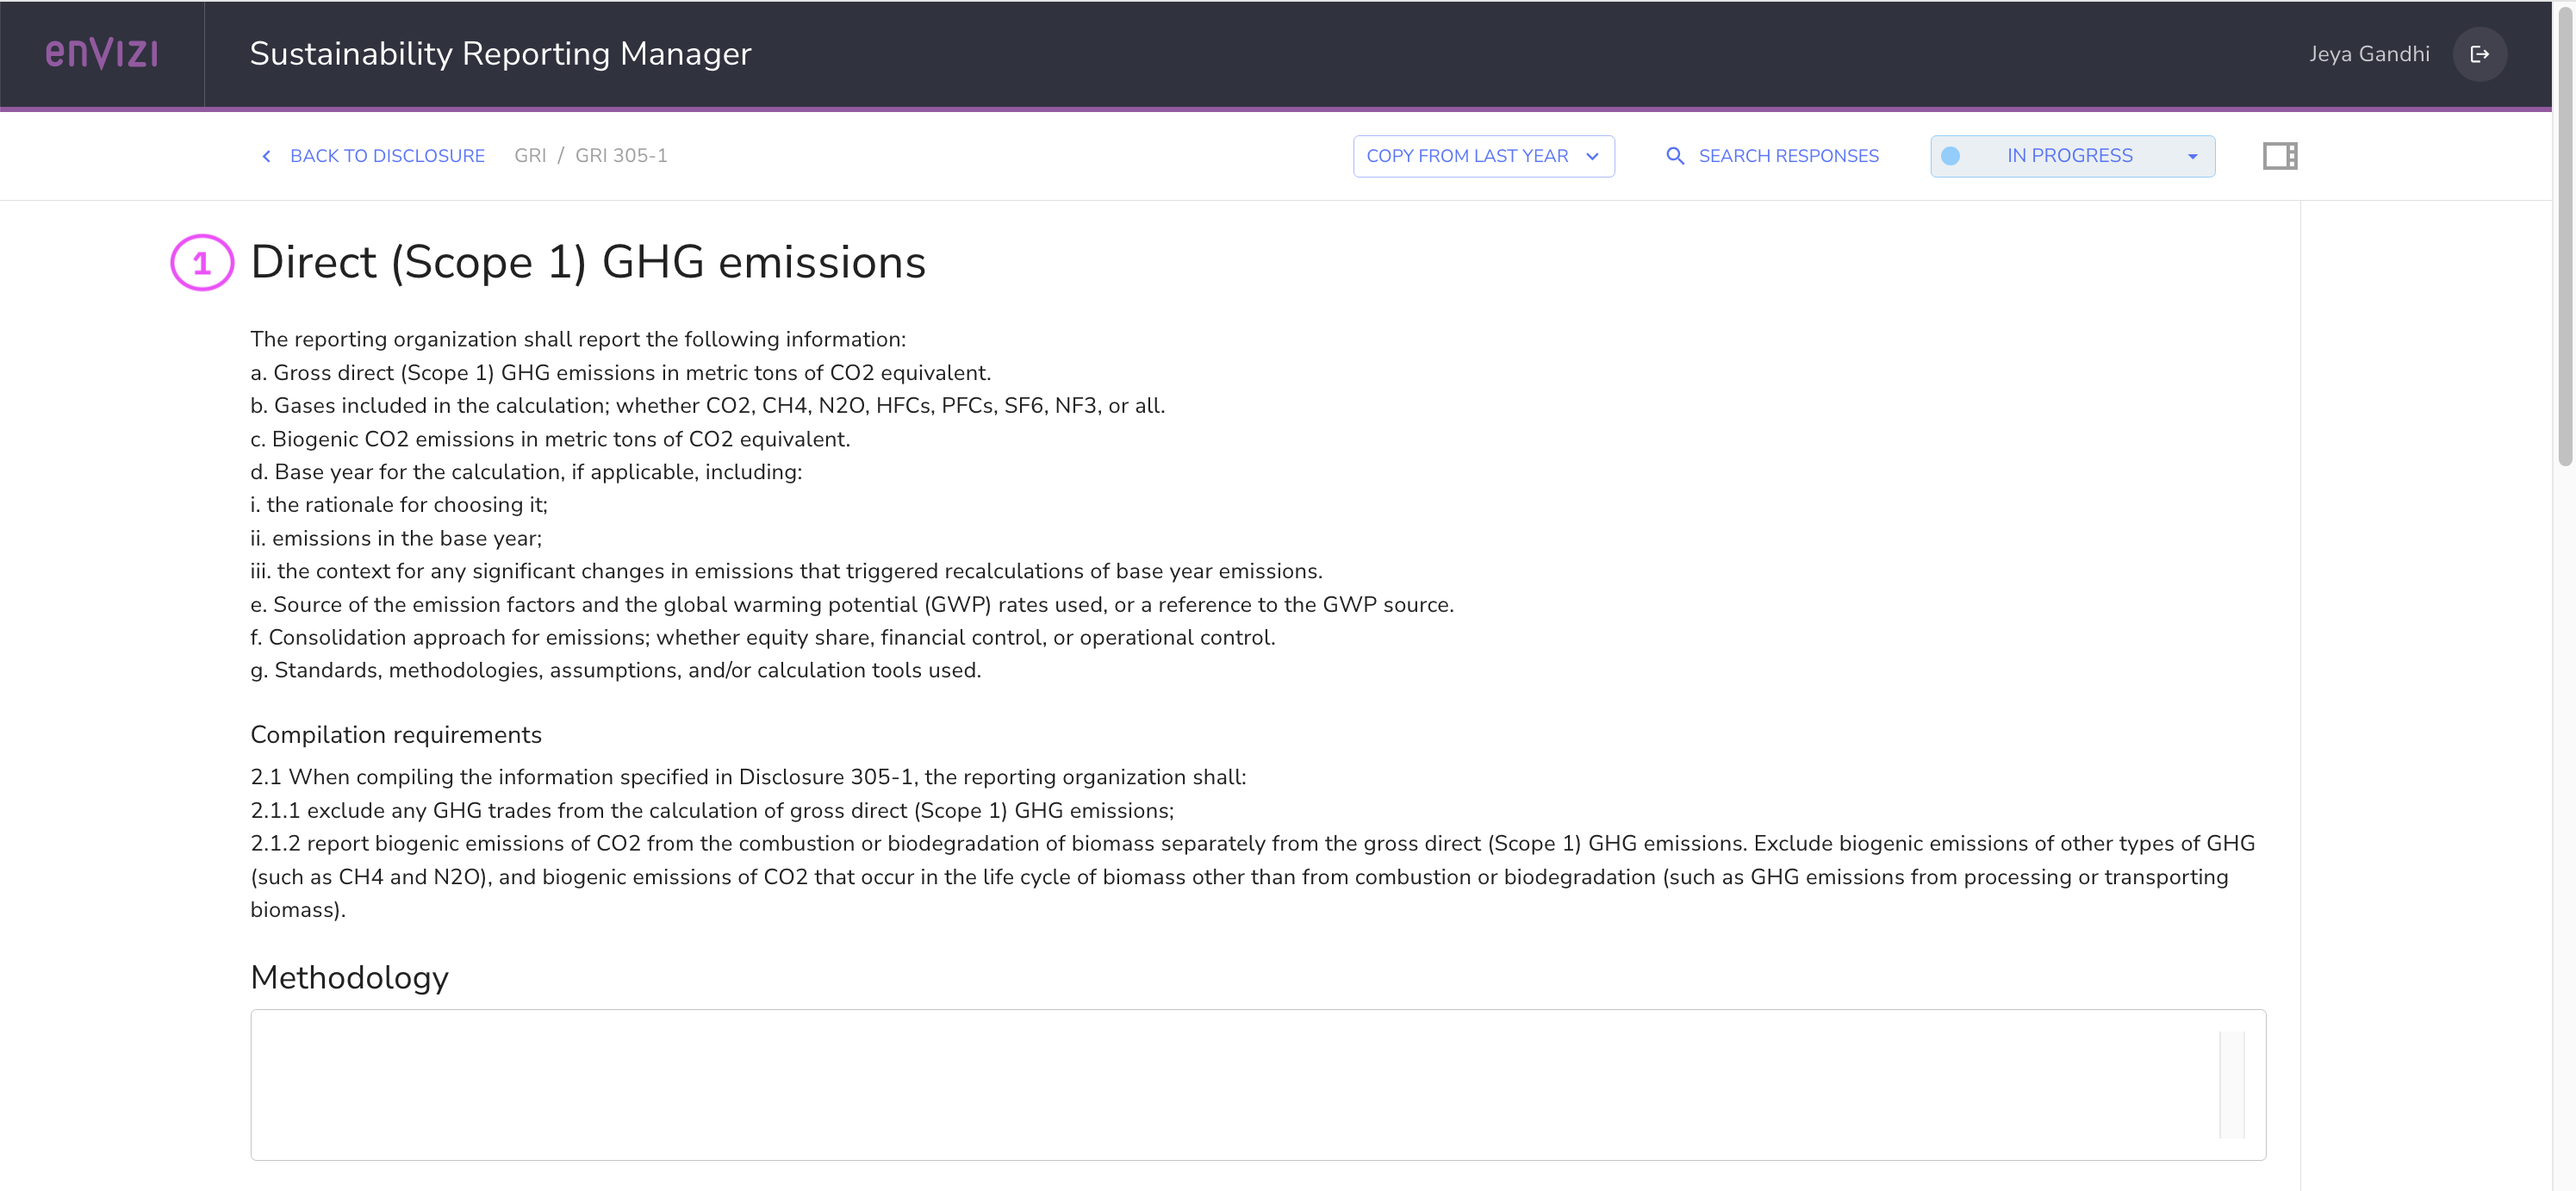
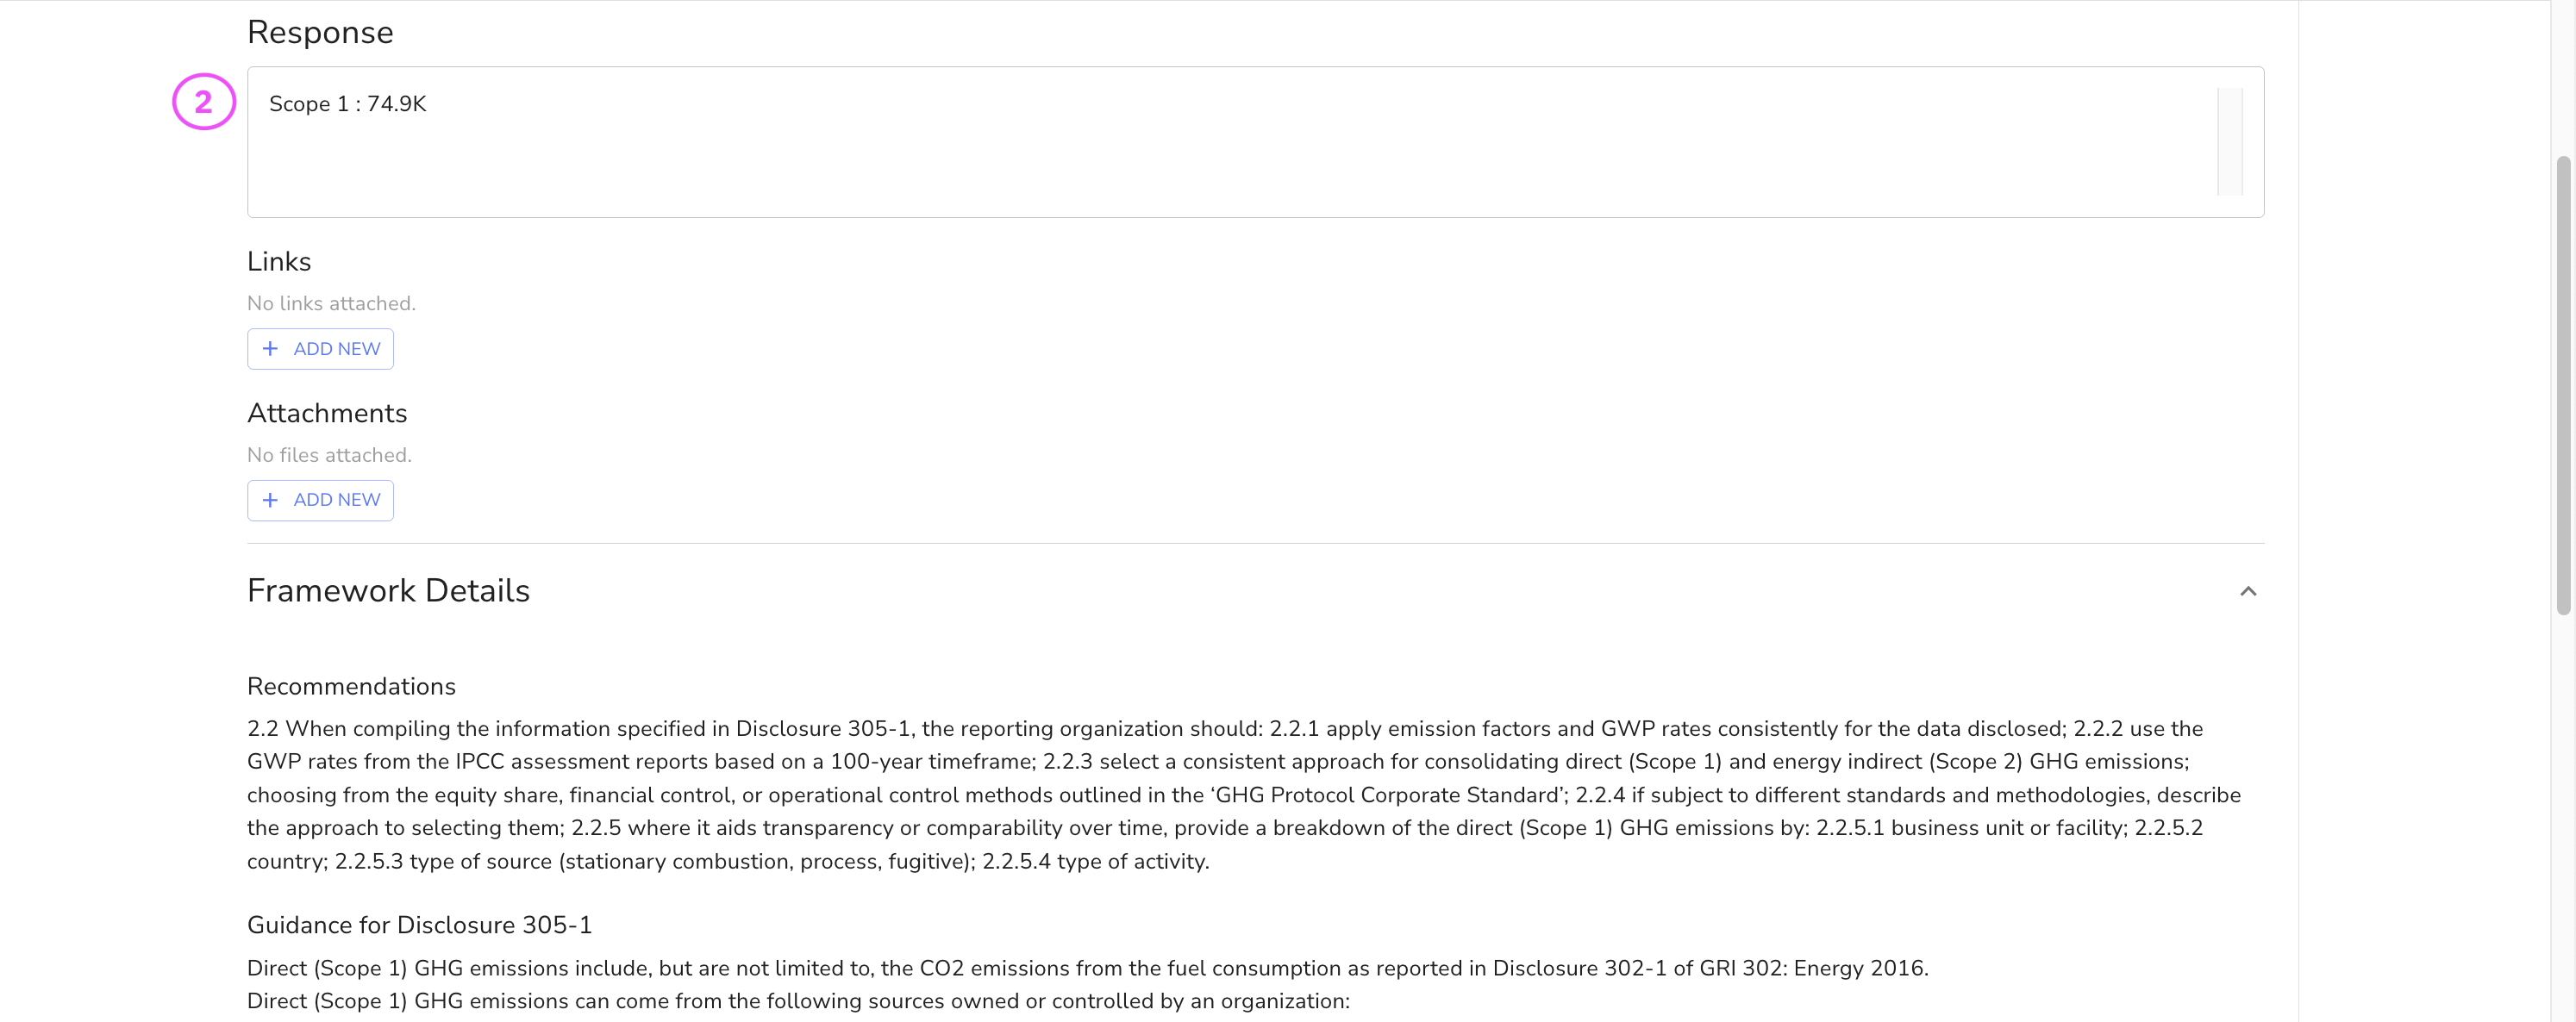
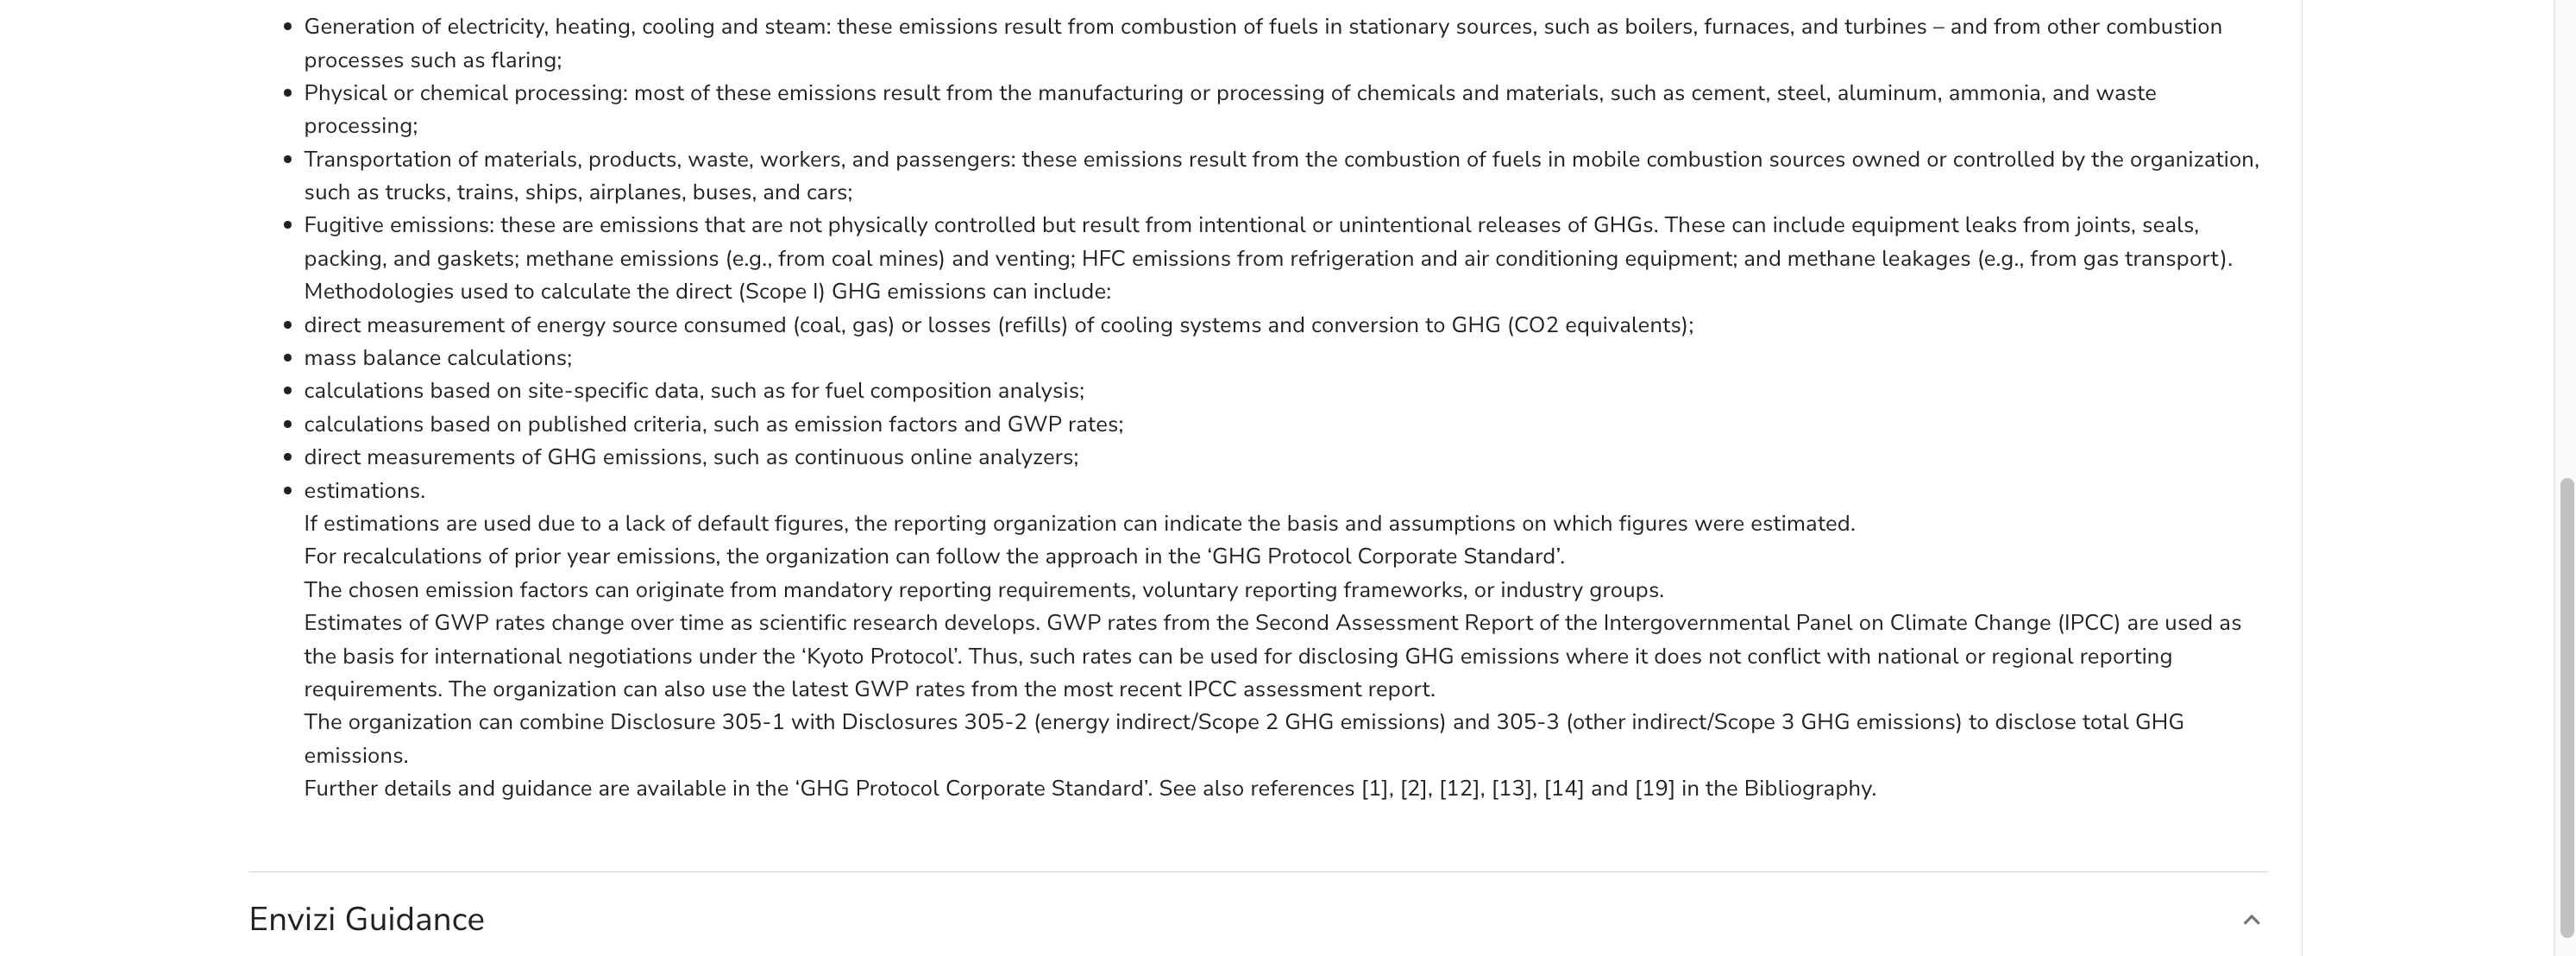
7.3 View question
Shows question details, including:
- Name/description (1)
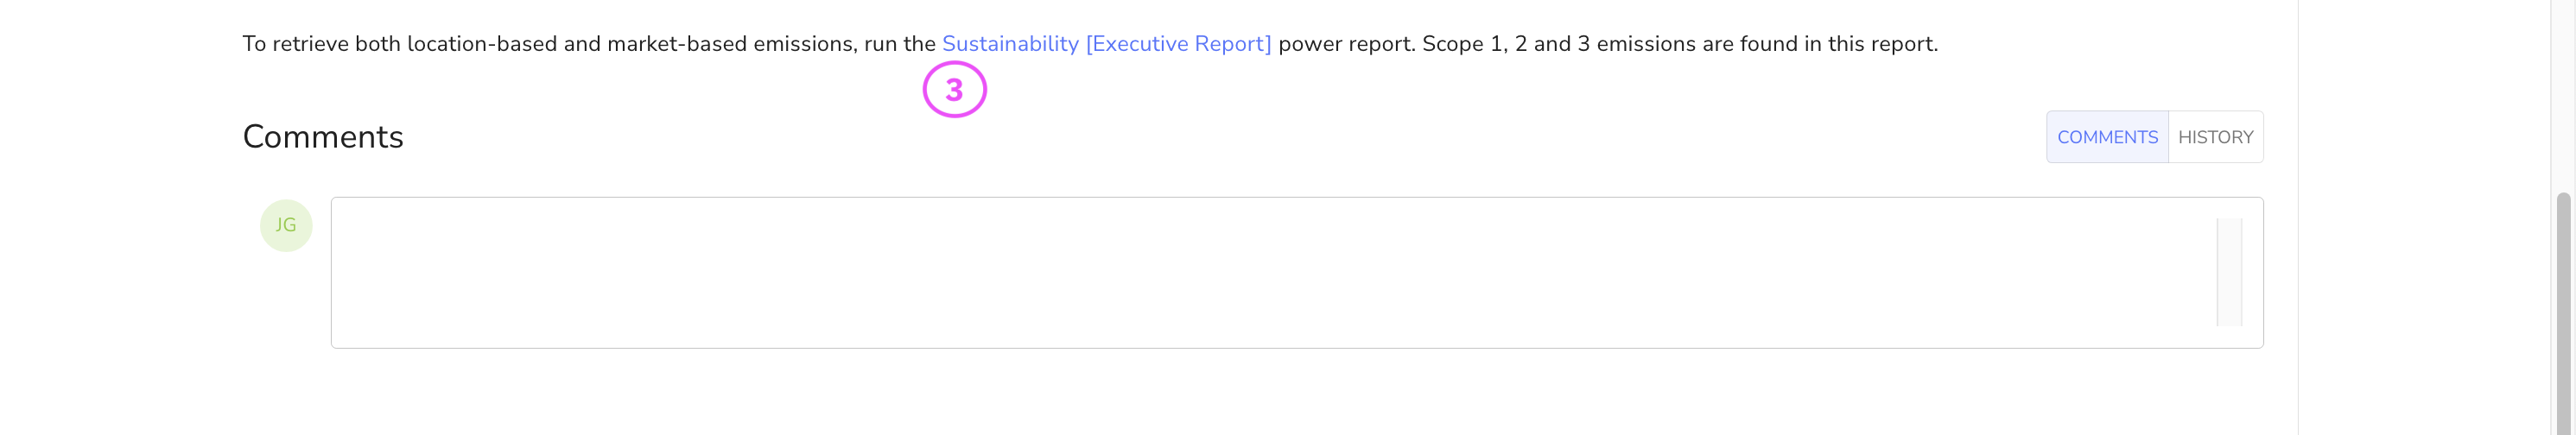
- Response field (2)
- Envizi guidance for answers (3)
8. View reports
8.1 Scope 3 emission report
The Scope 3 Emissions report provides insights into:
- Scope 3 emissions (1)
- Scope 1 emissions (2)
- Scope 2 emissions (3)
To explore specific details:
Select Category 7 - Employee Commuting (4).
Click "Select a category" to enable drill-through navigation (5).
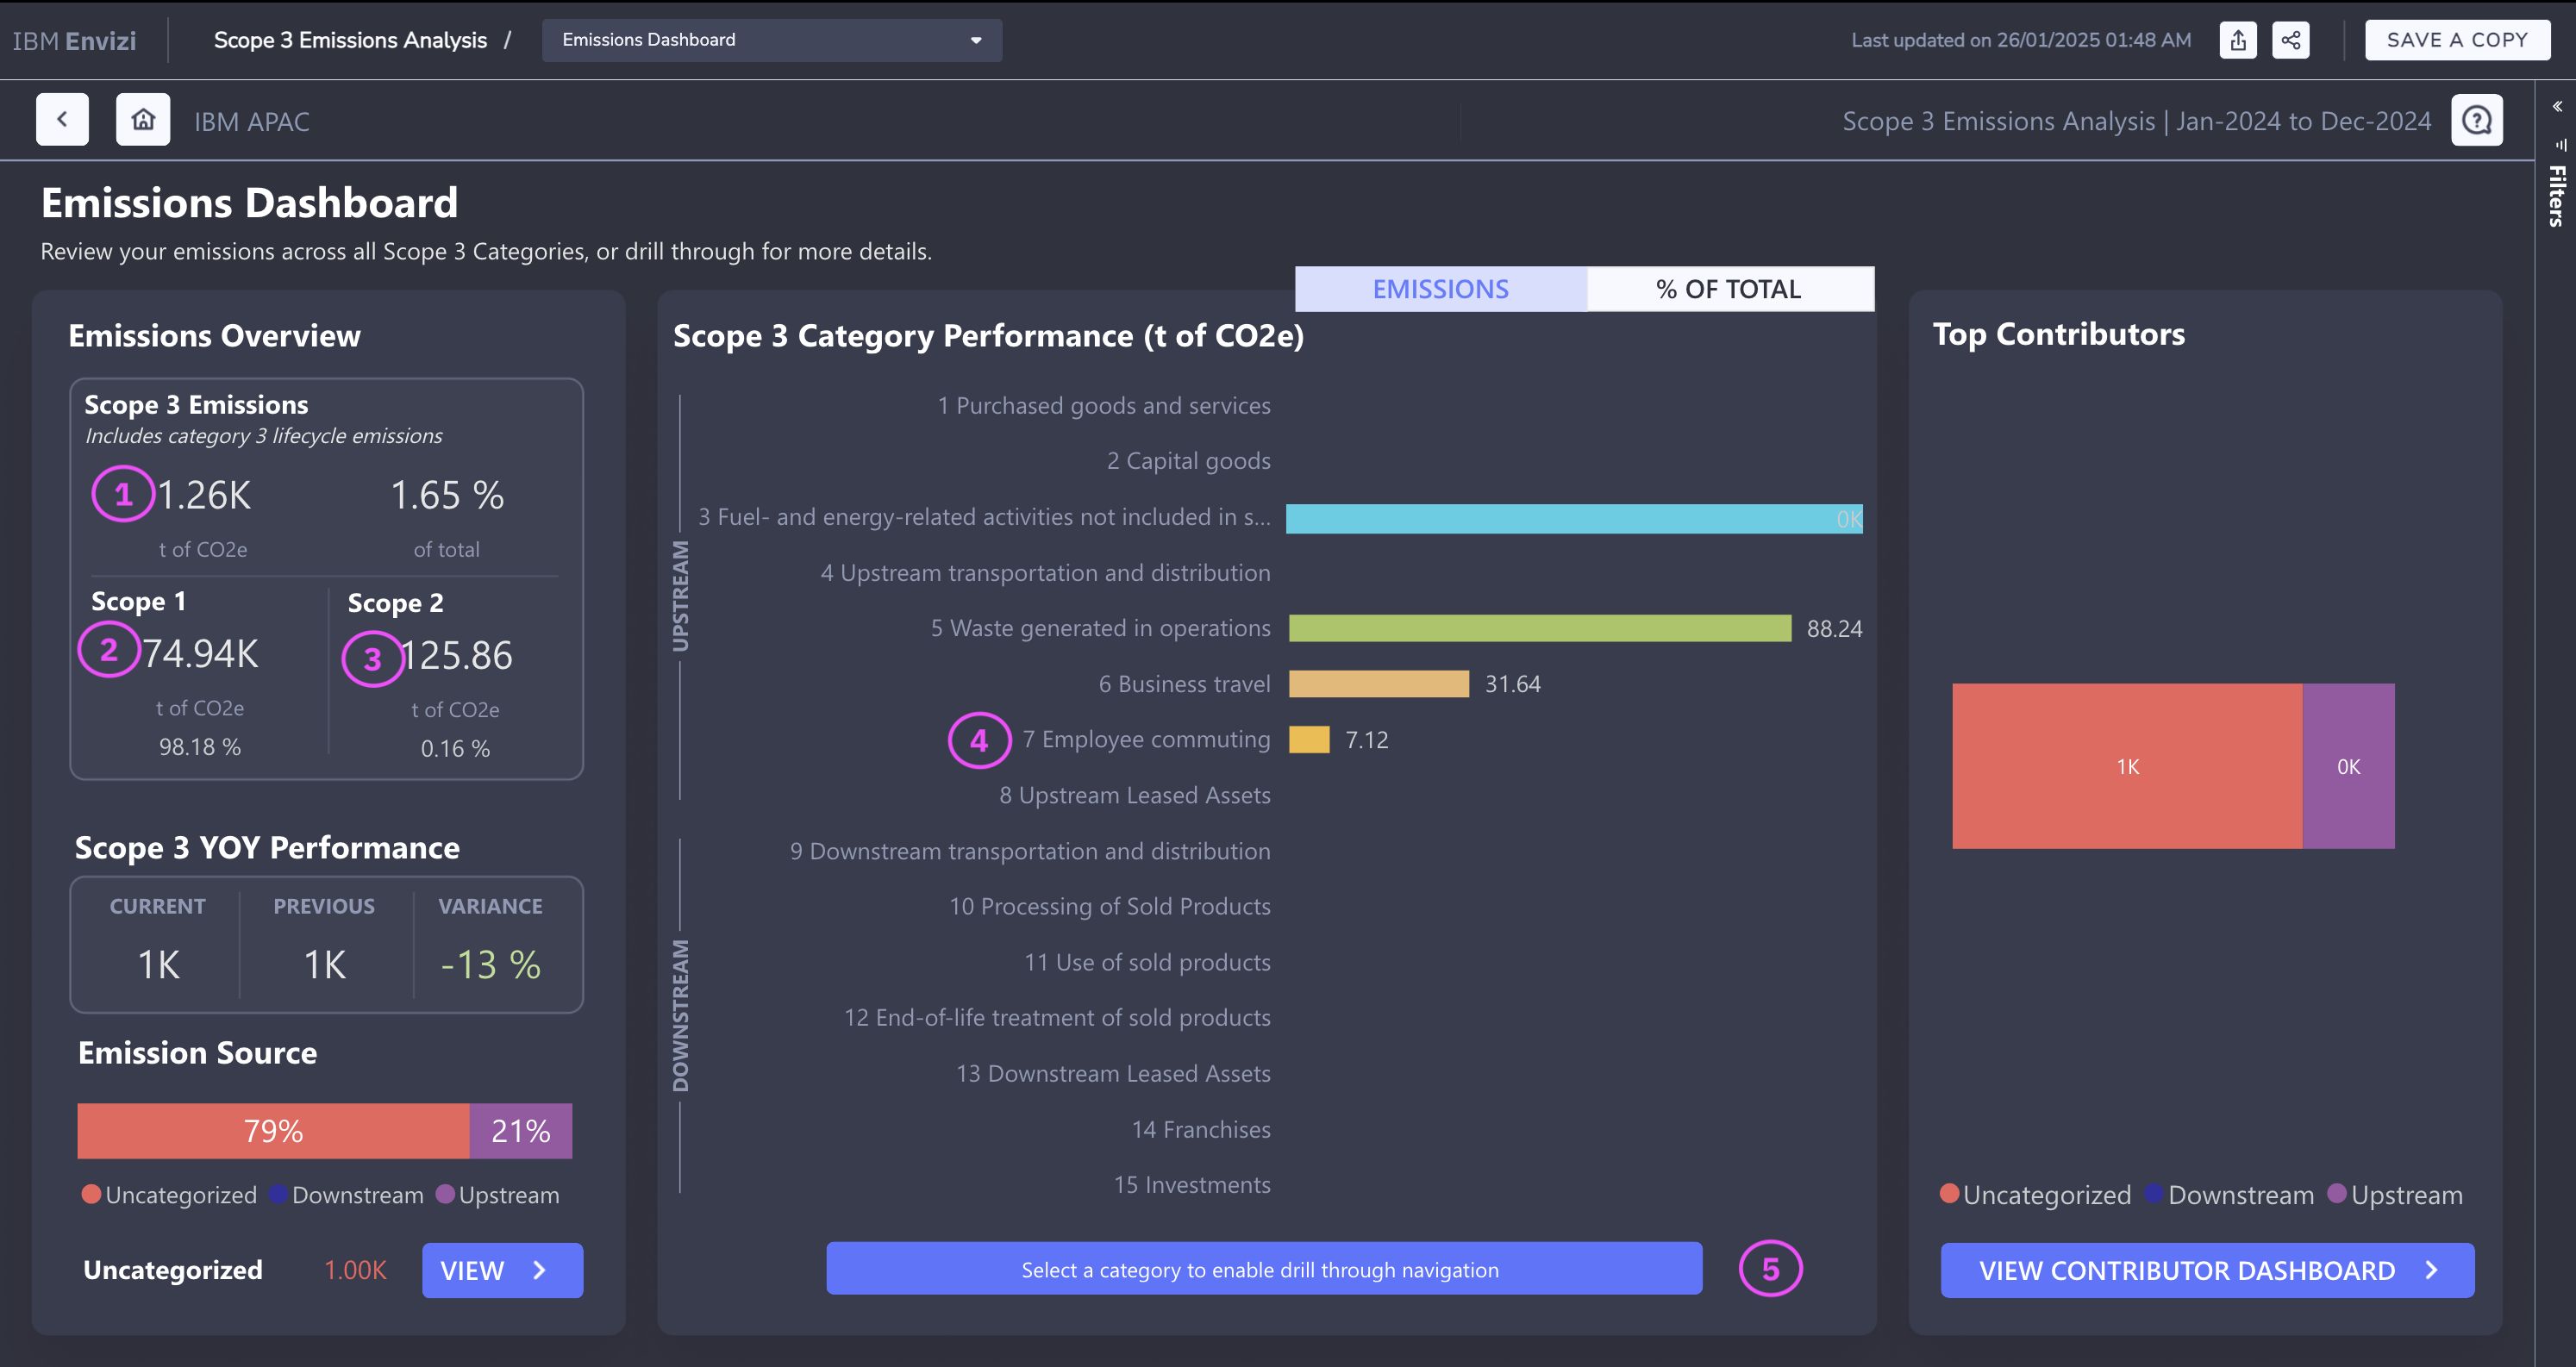
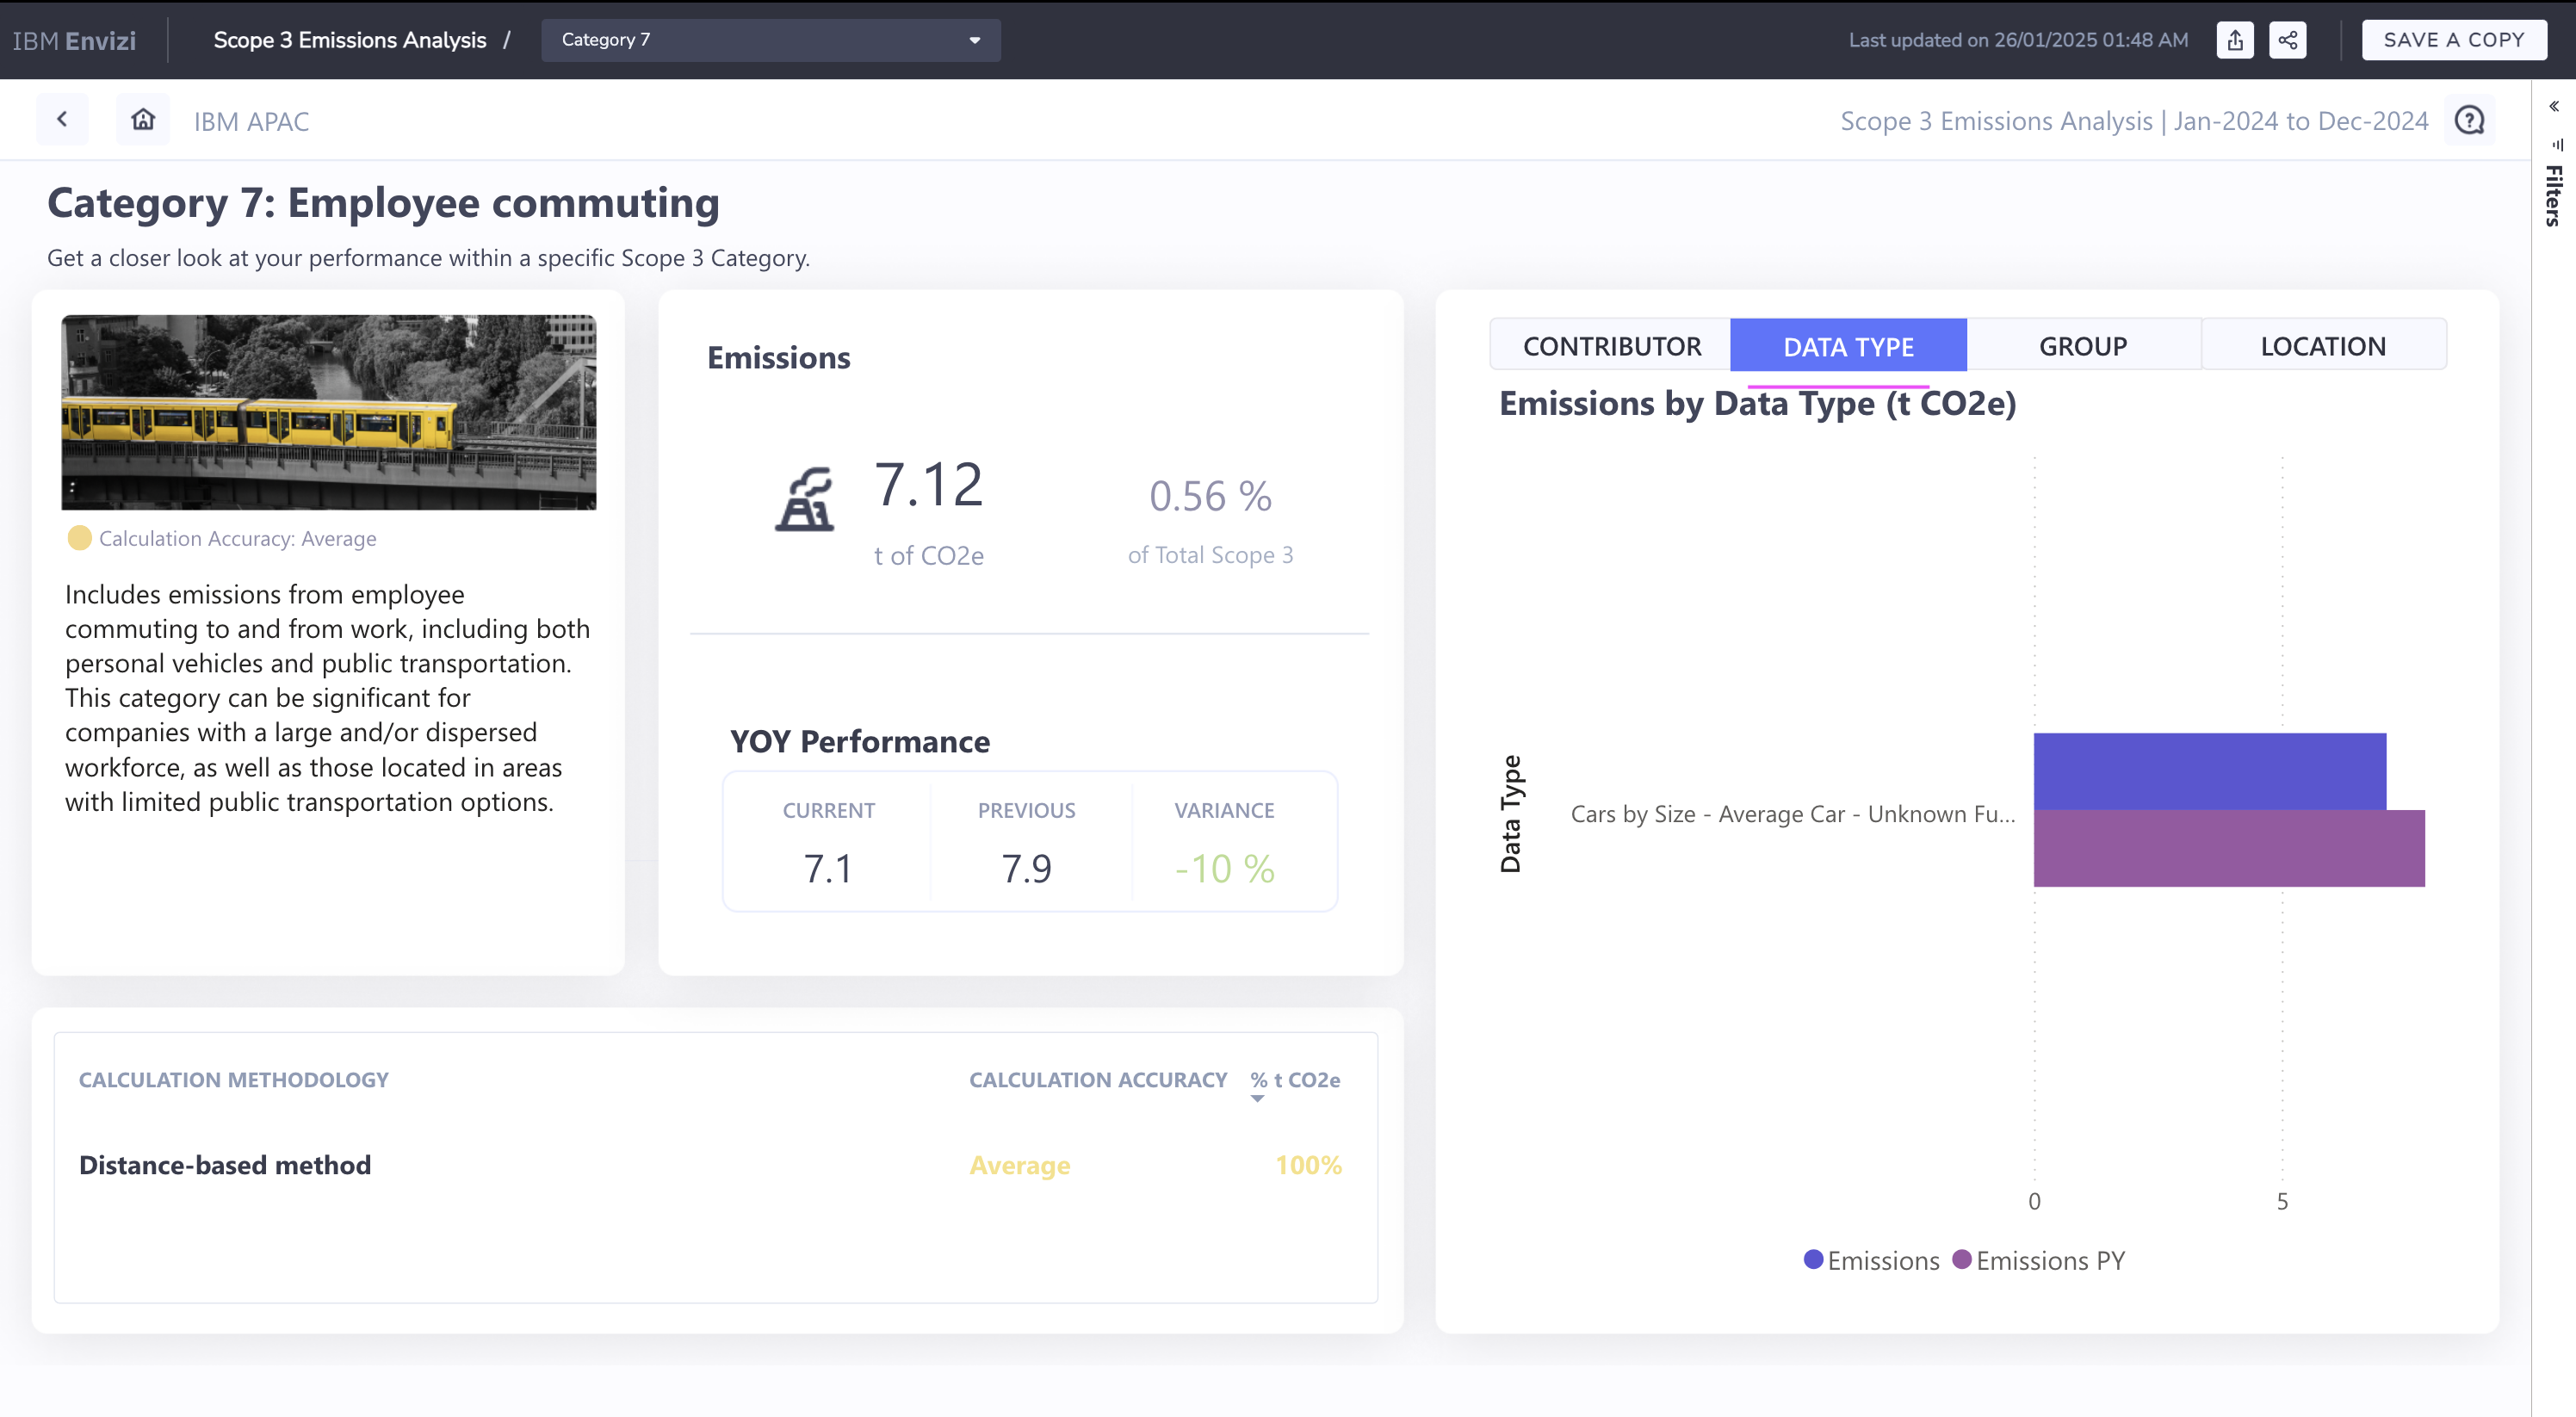
This will display:
Location-wise details
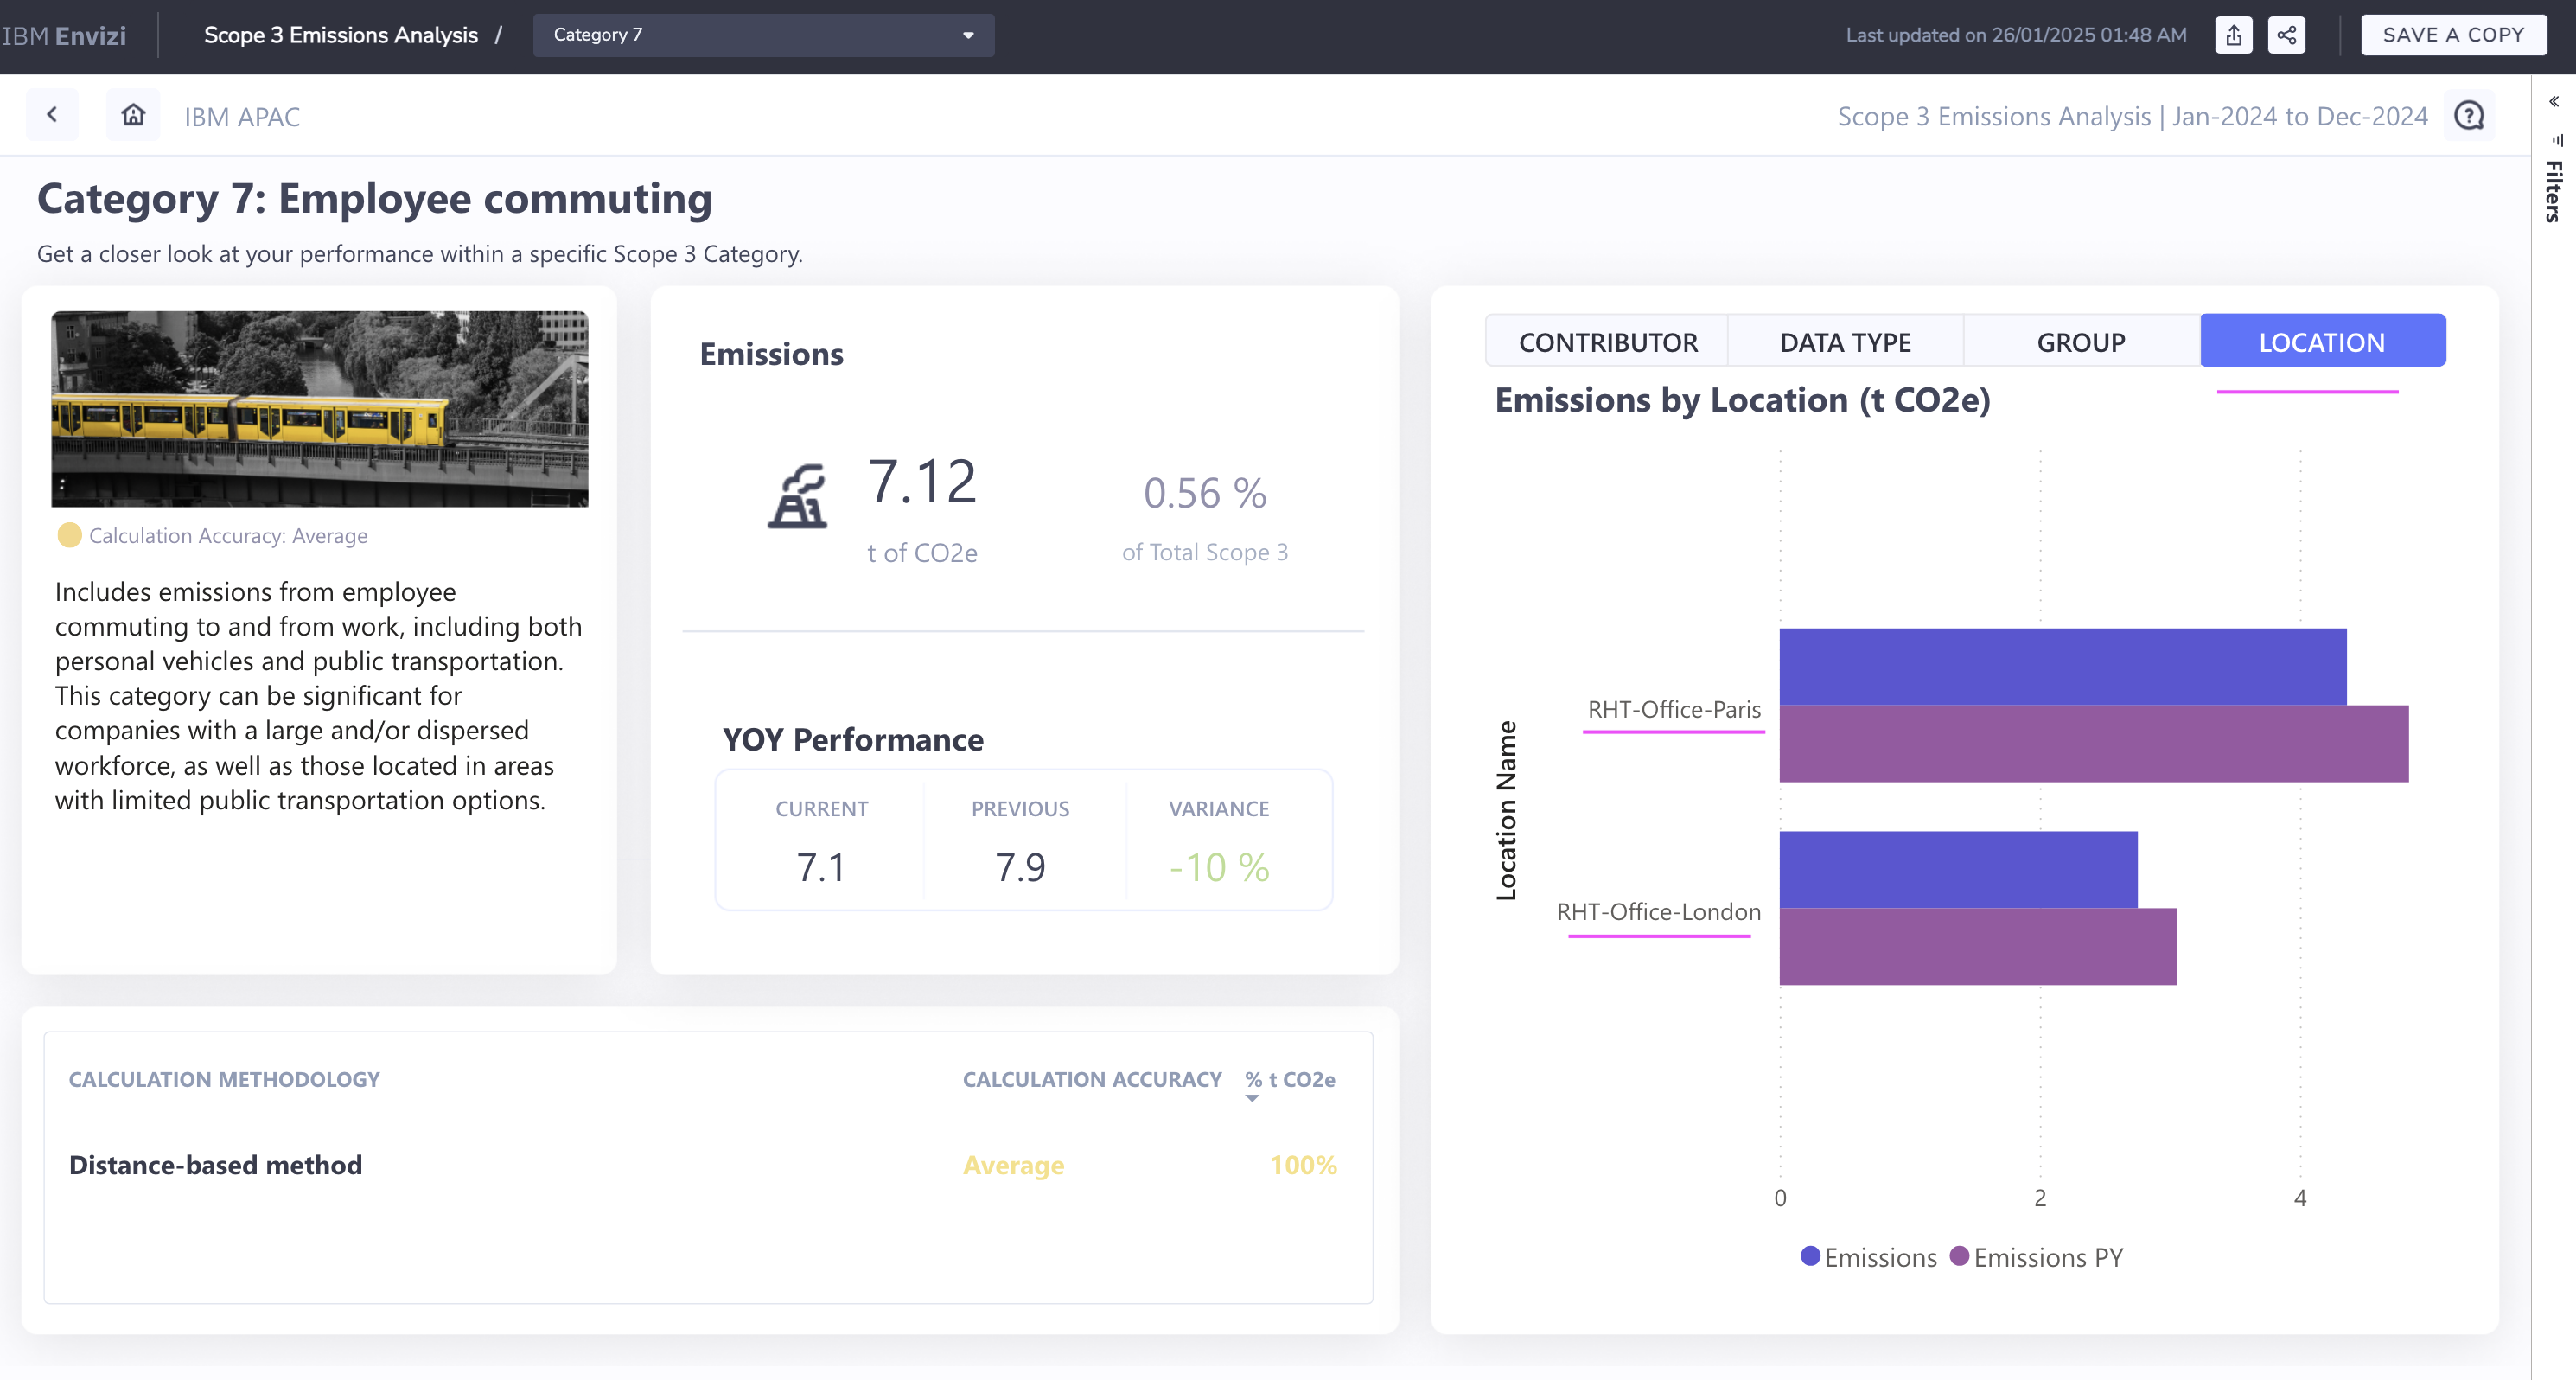
Data-type breakdown in graphical format
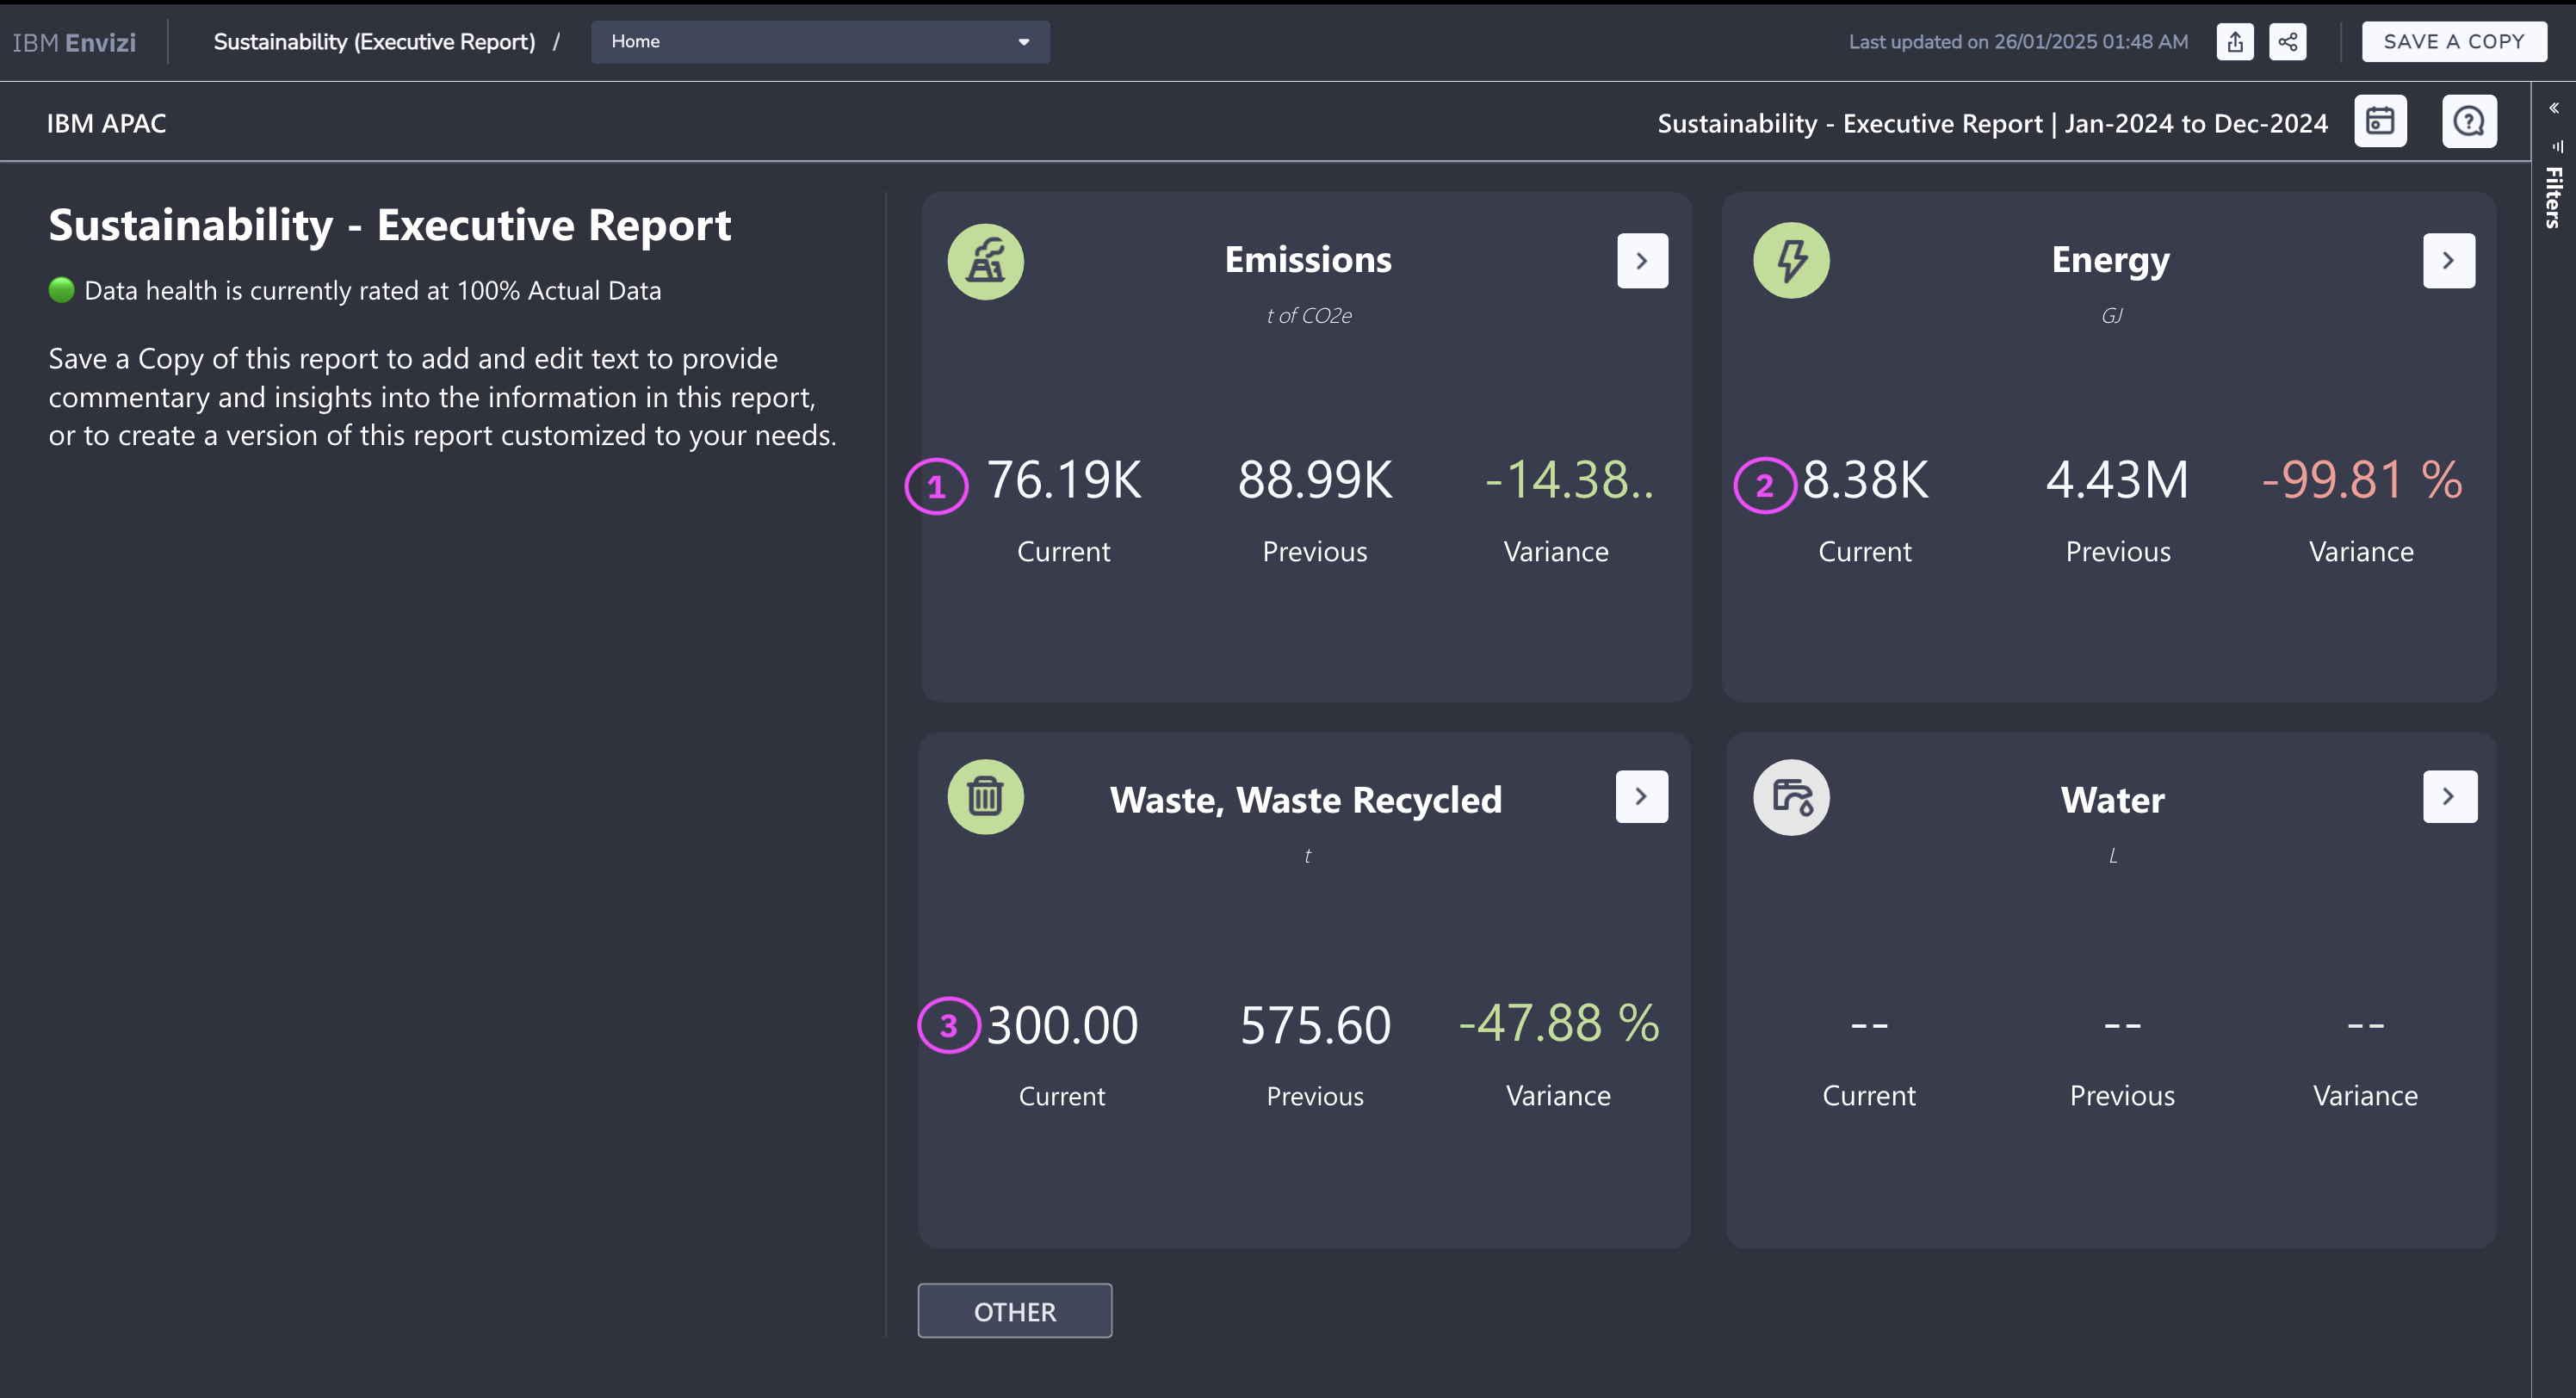
8.2 Sustainability executive report
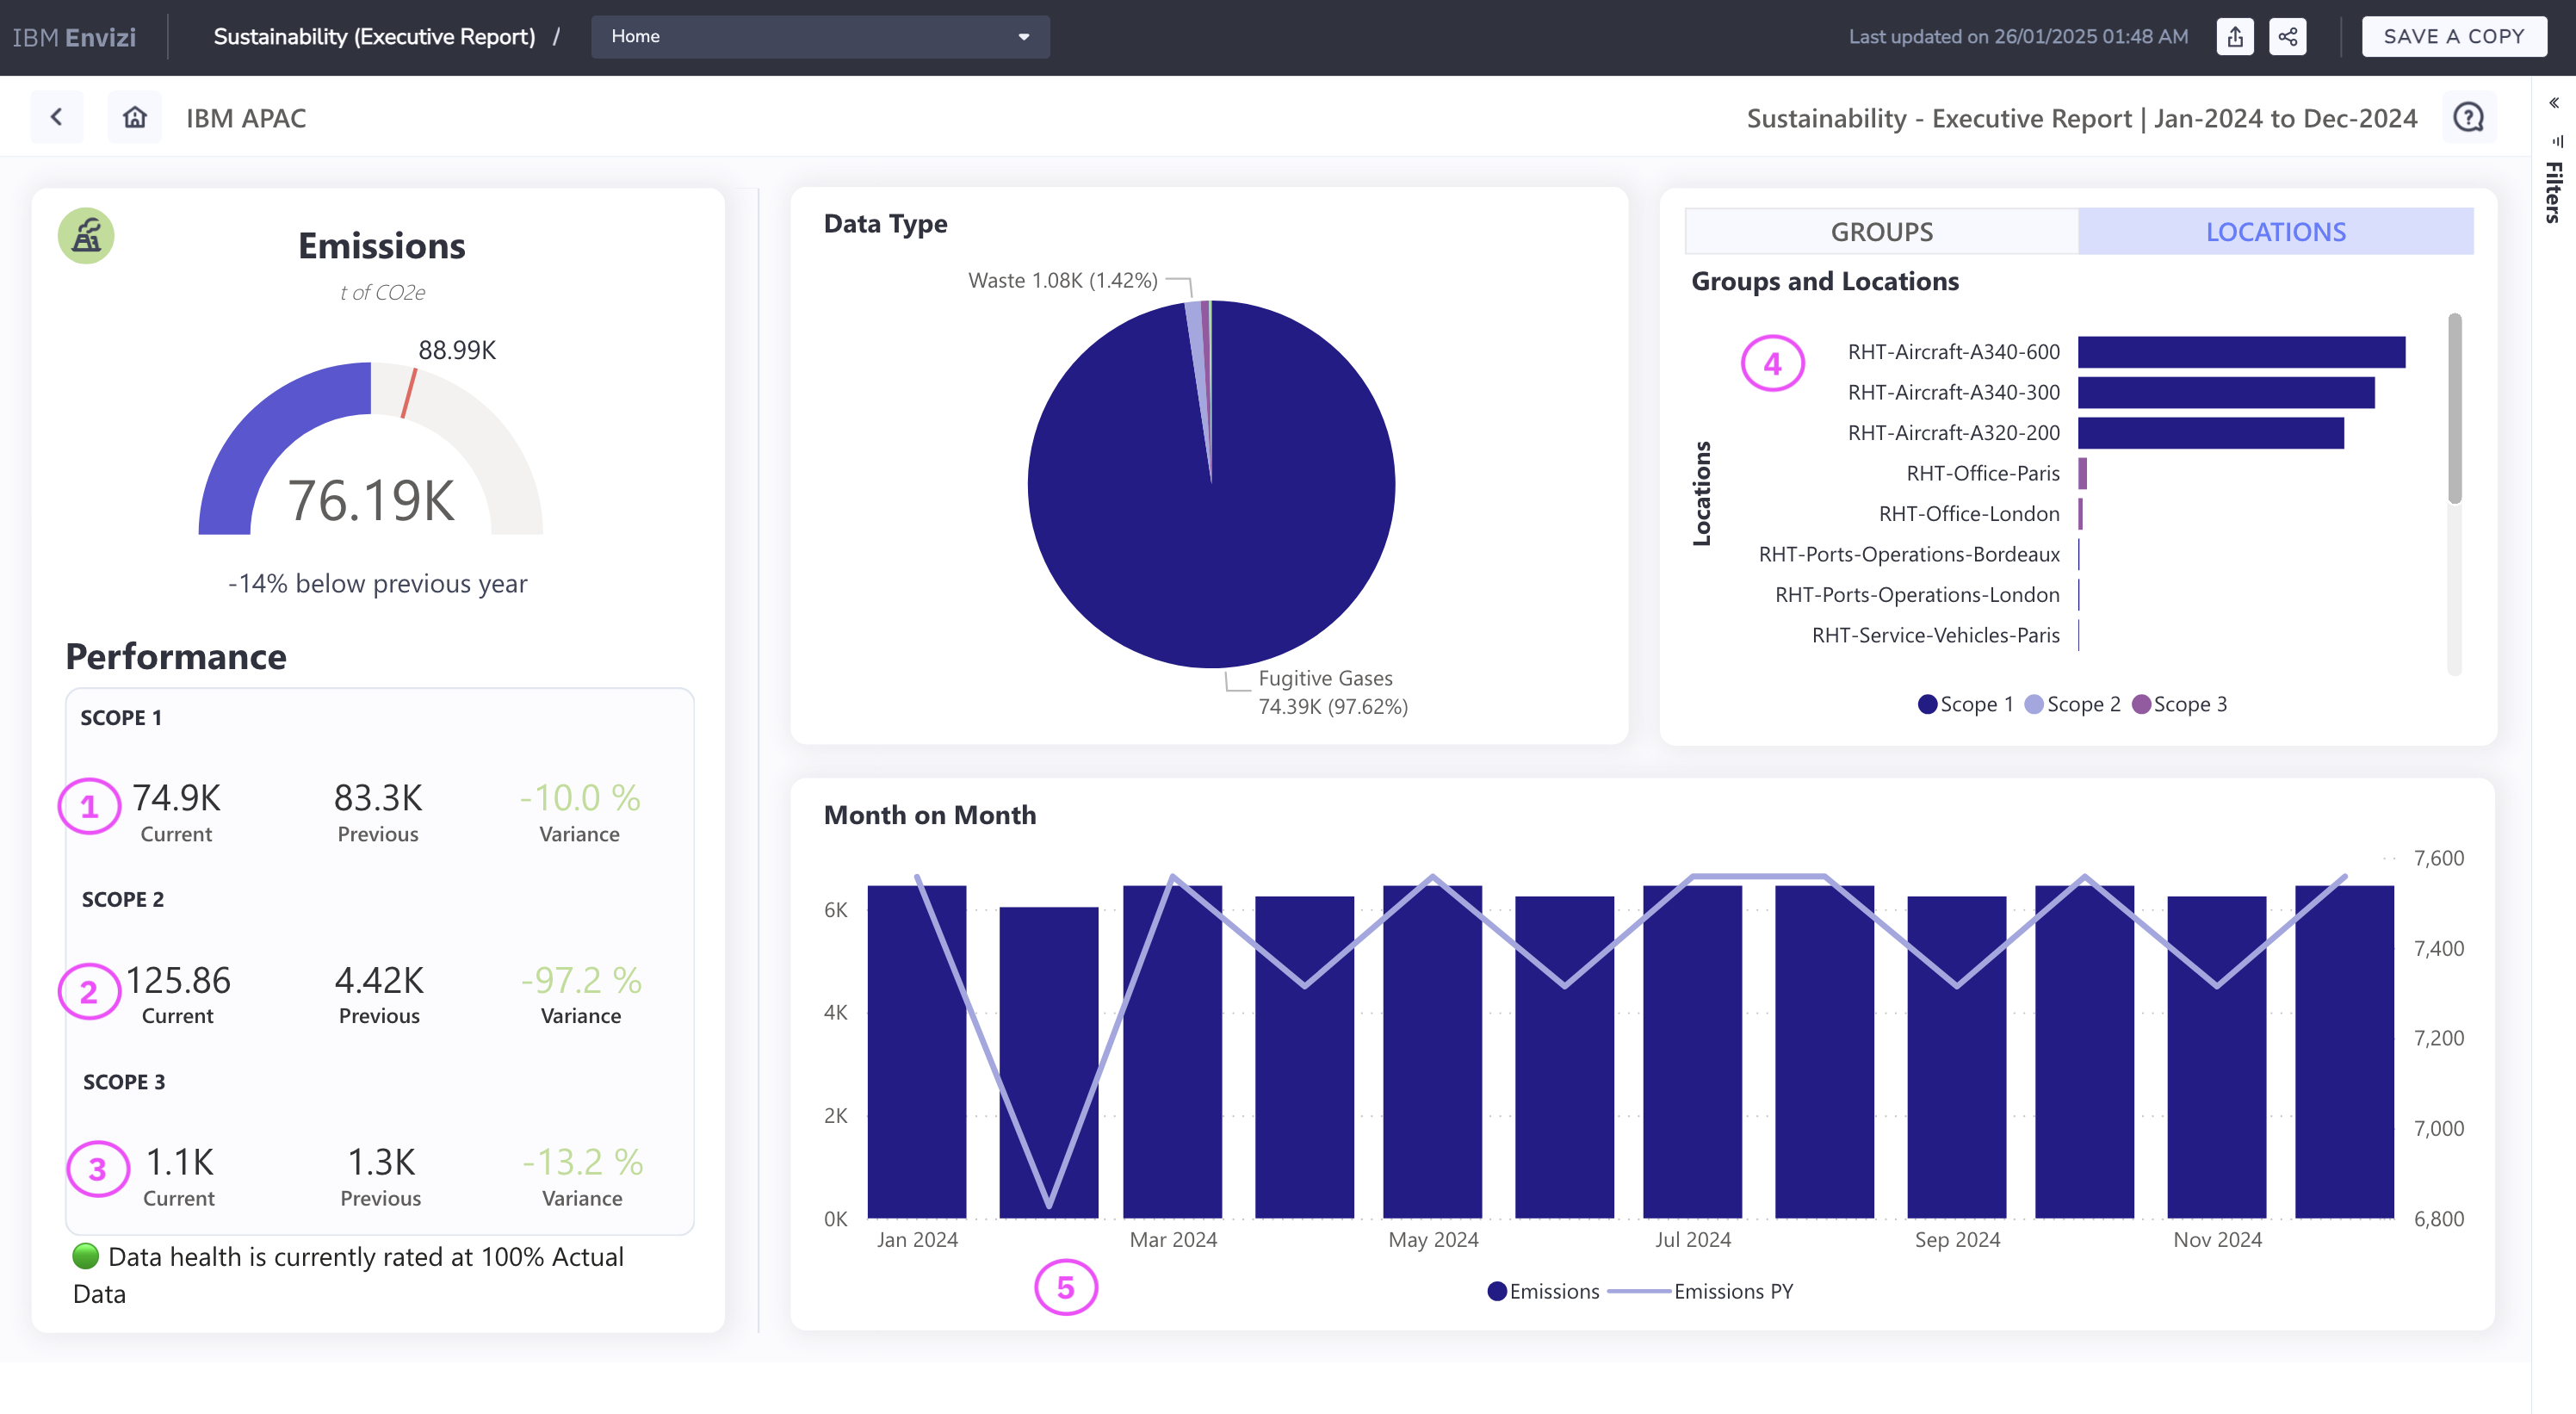
The Sustainability Executive Report provides a comprehensive overview of:
- Emissions (1)
- Energy consumption (2)
- Waste management (3)
The emissions section includes:
- Scope 1 emissions (1)
- Scope 2 emissions (2)
- Scope 3 emissions (3)
- Location-wise emission breakdown (4)
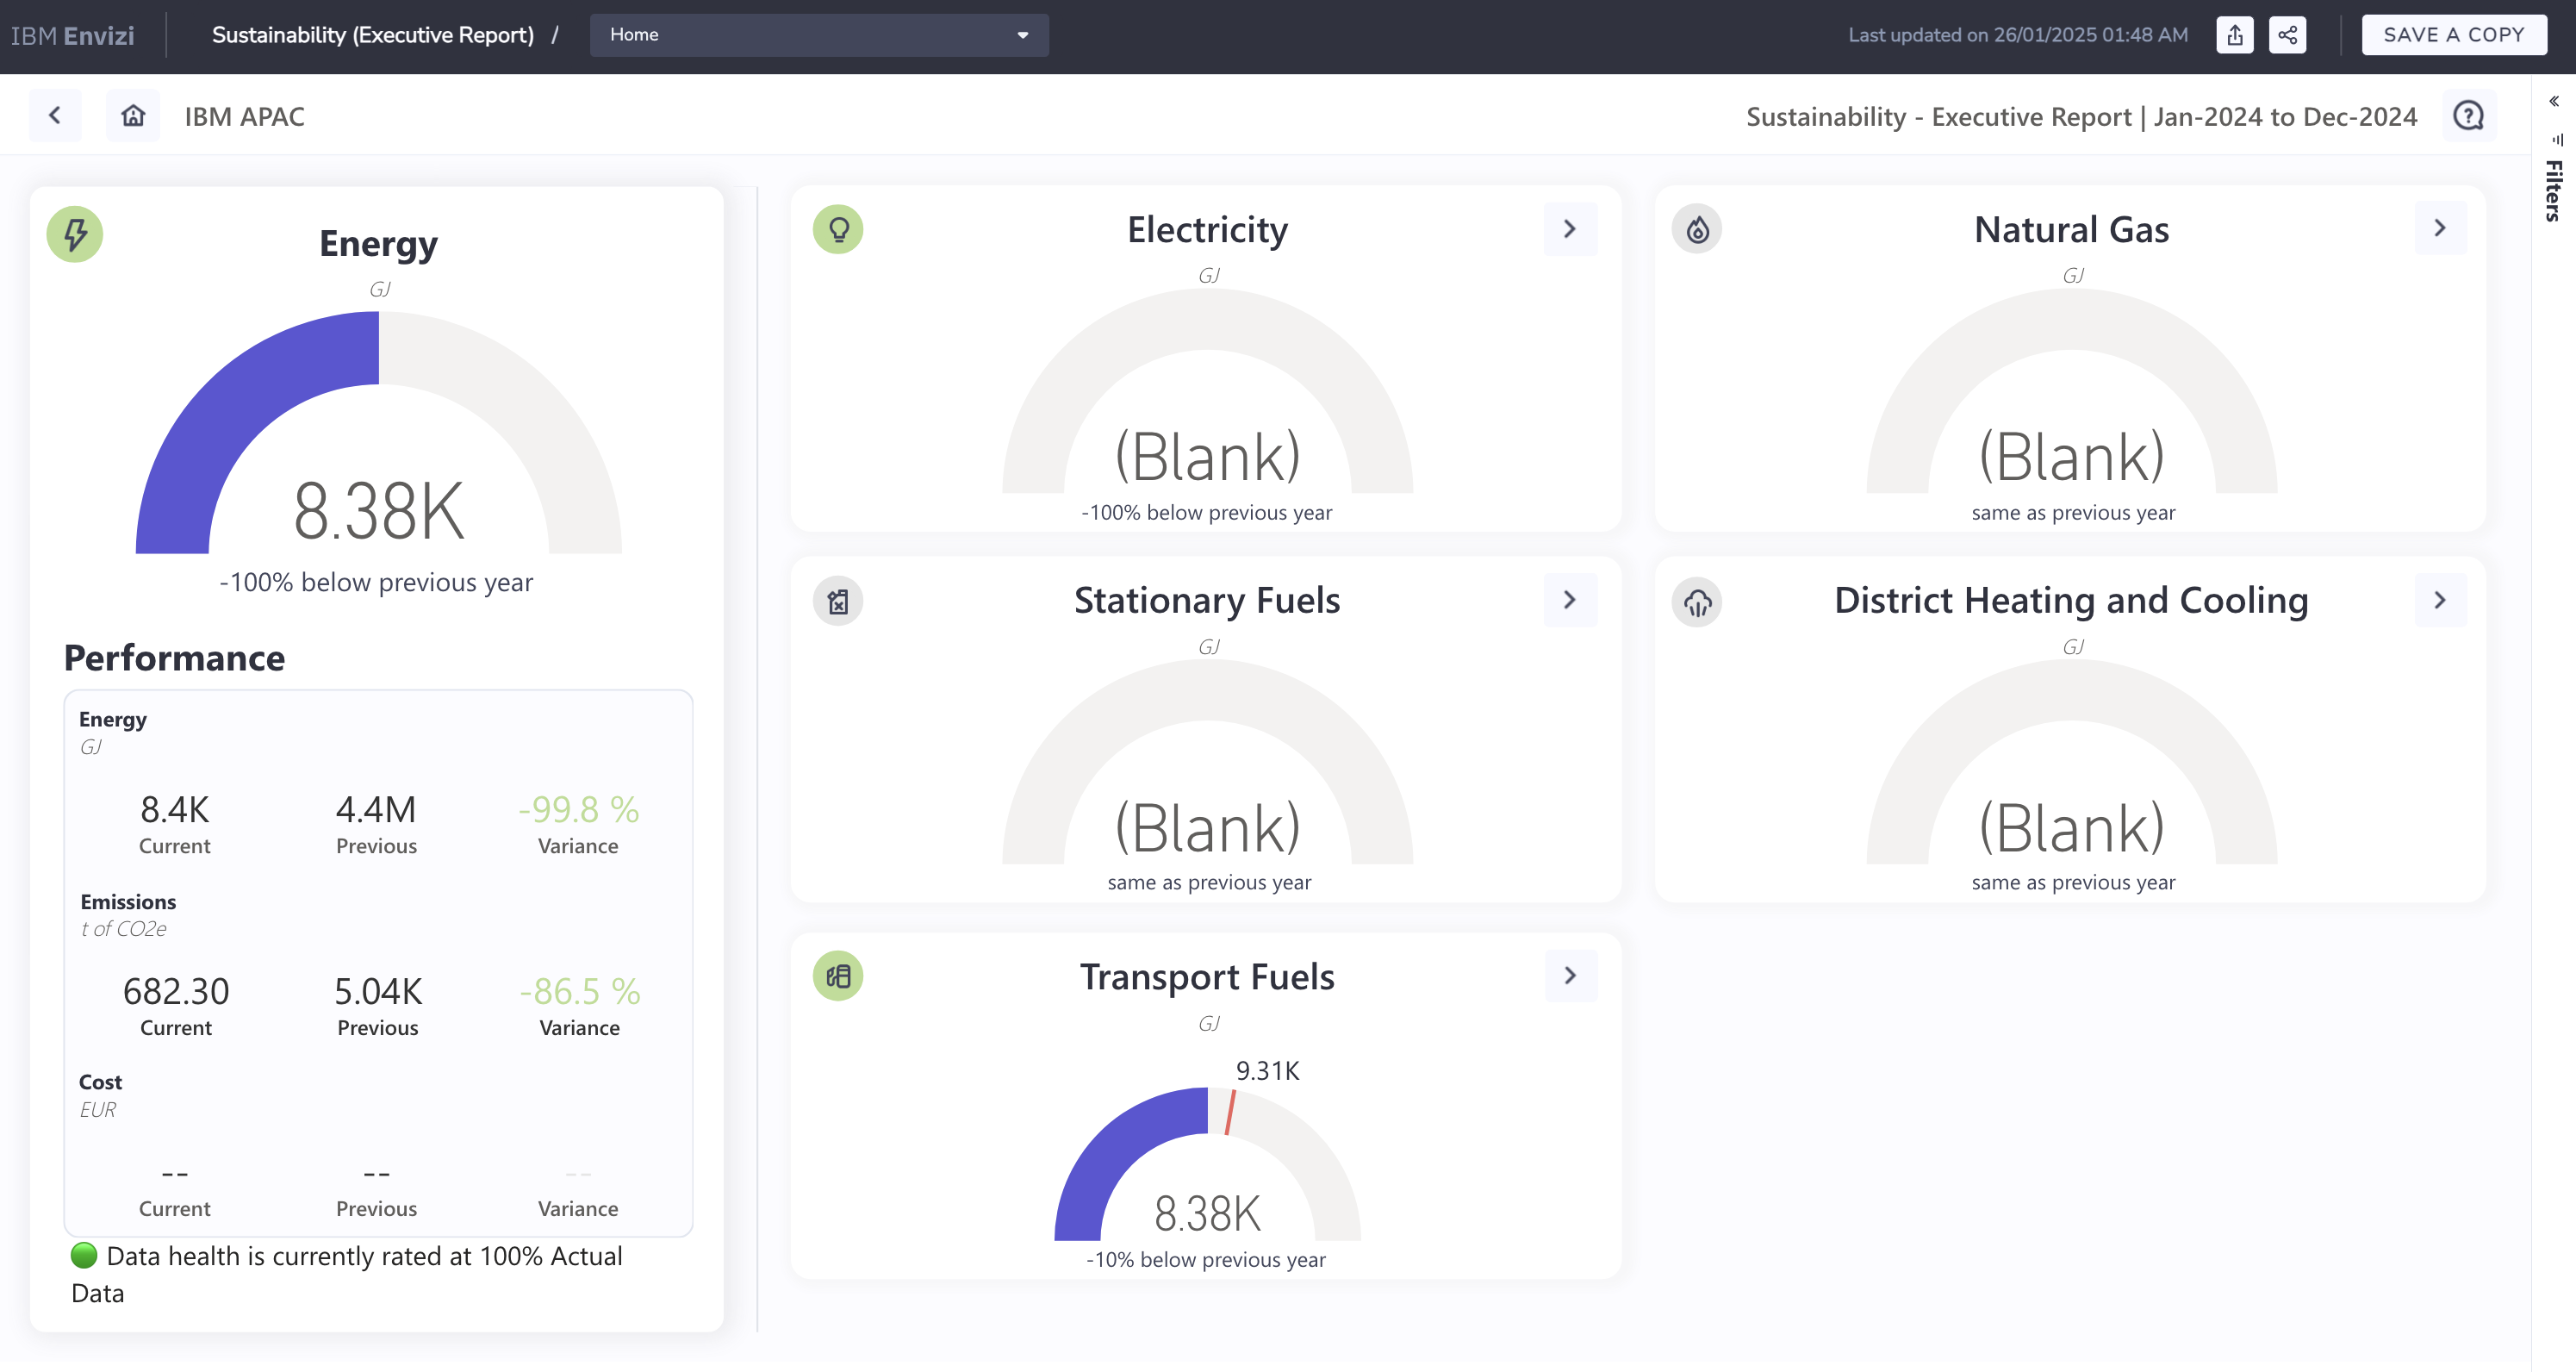
The Energy section displays energy consumption trends.
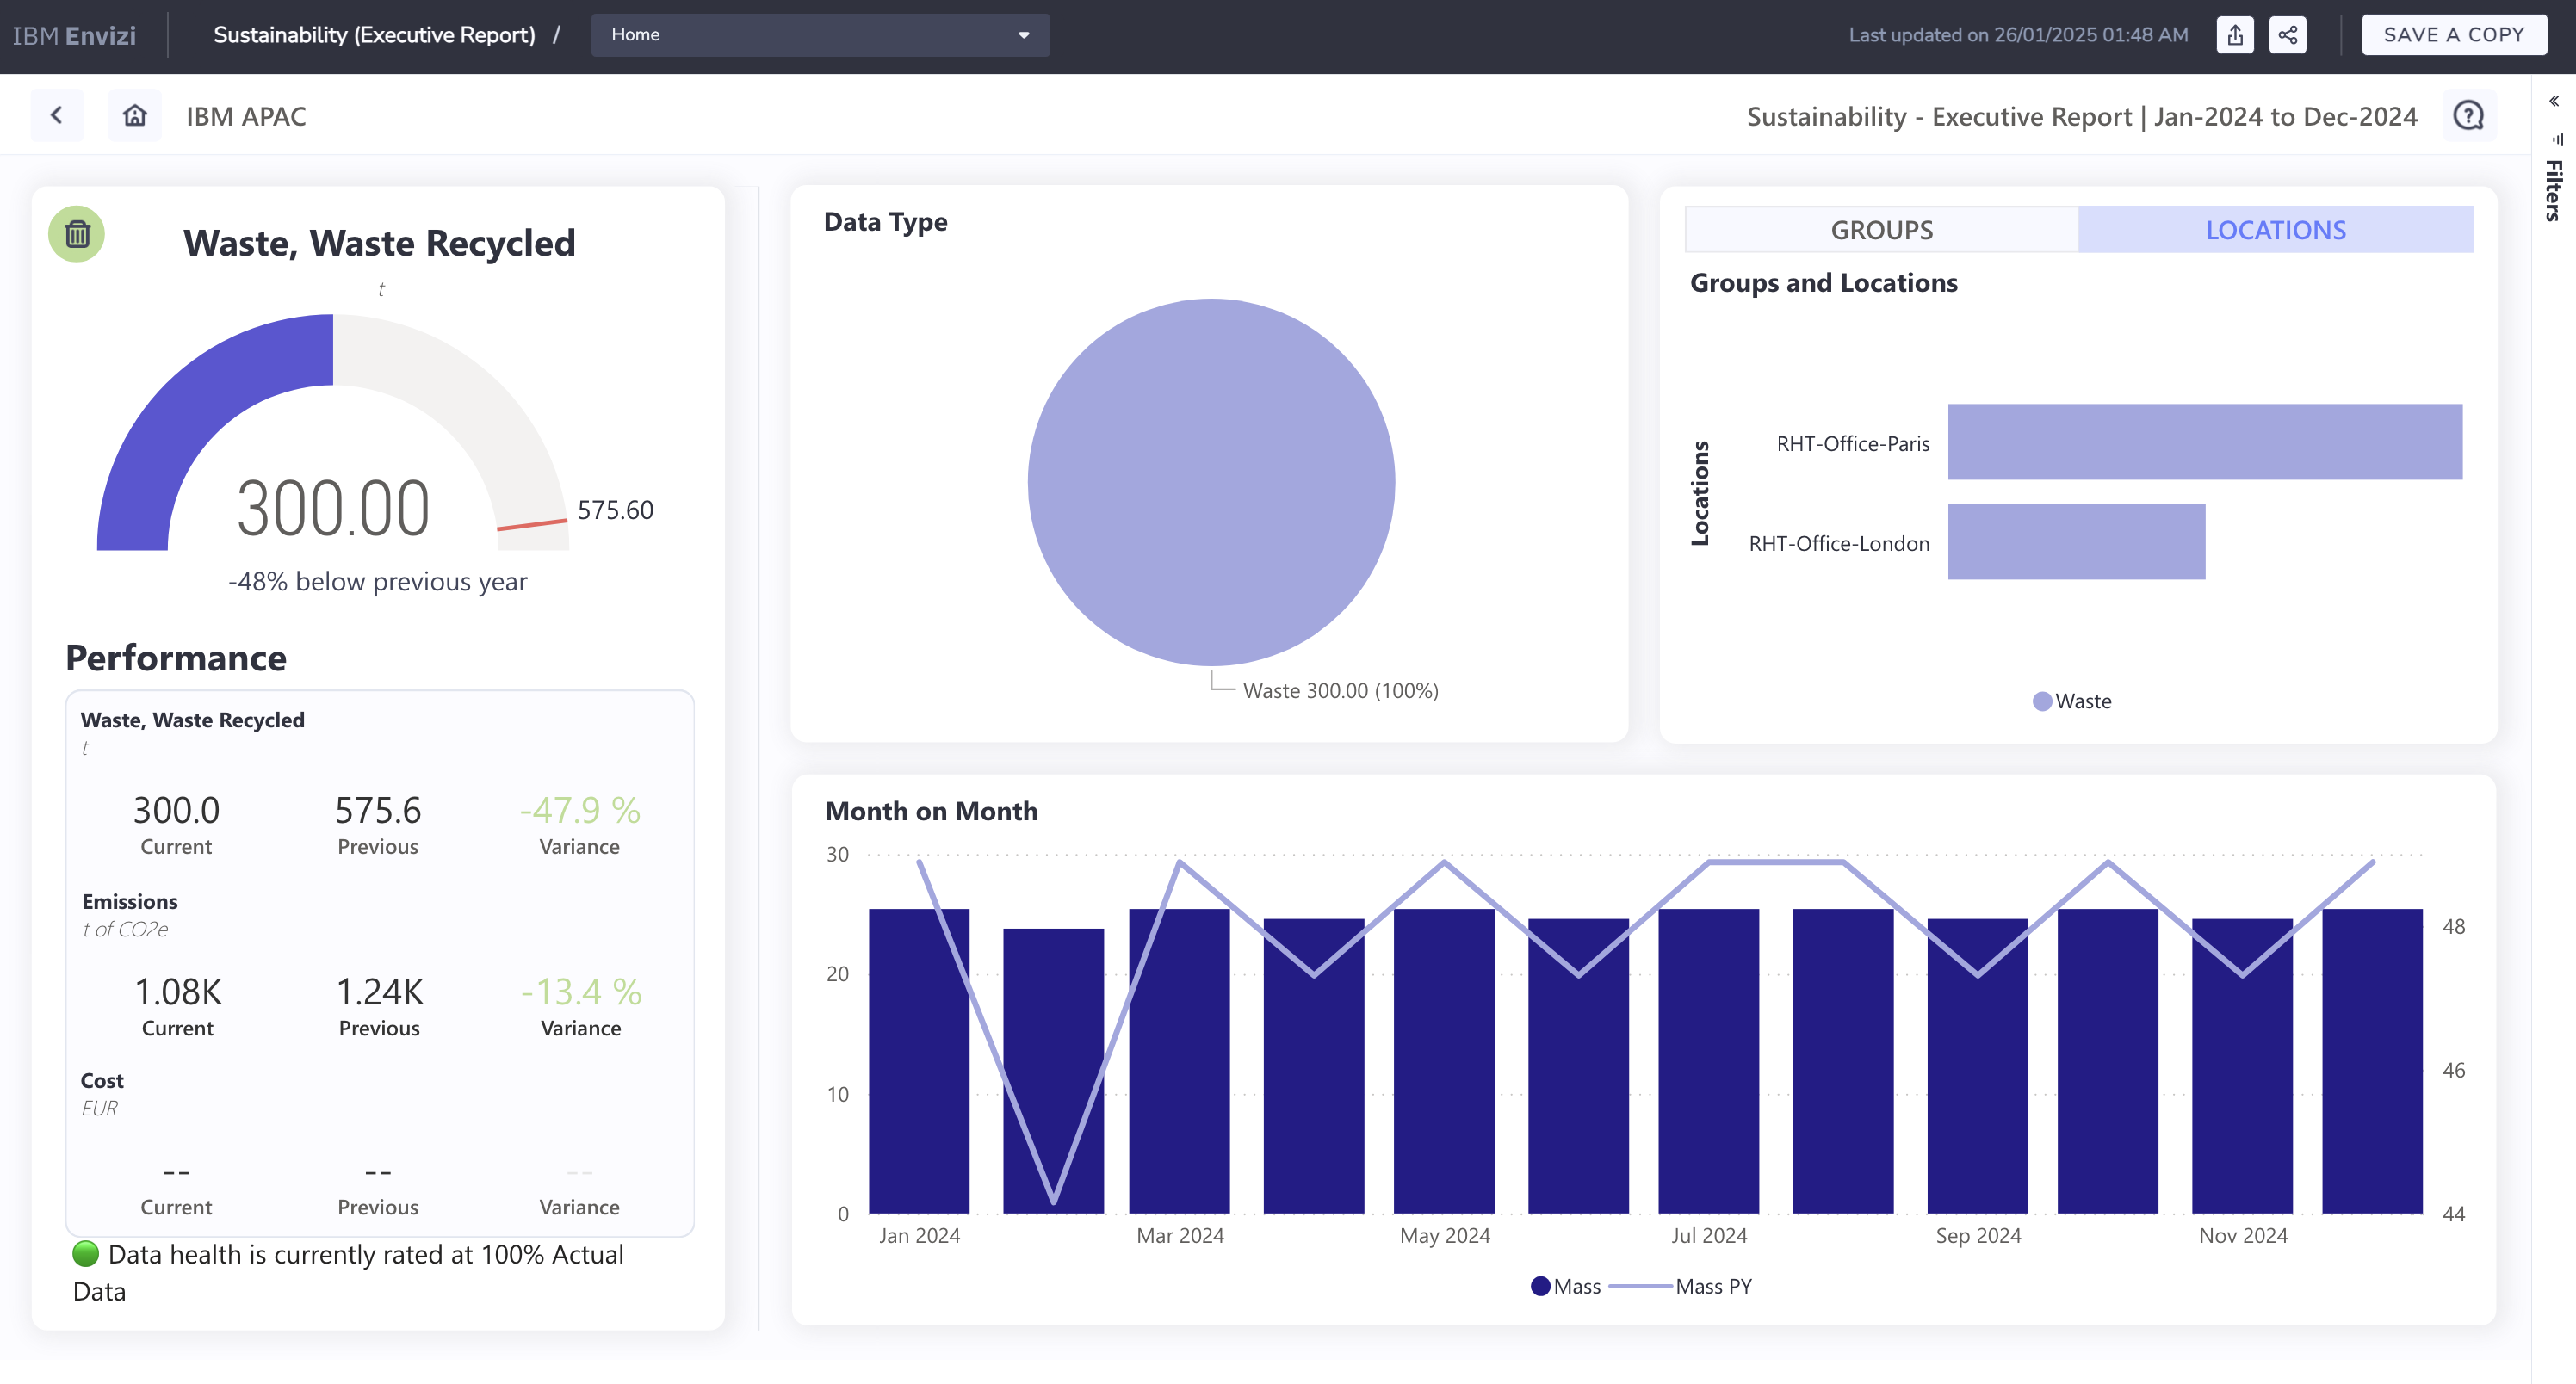
The Waste section provides insights into waste generation and management.
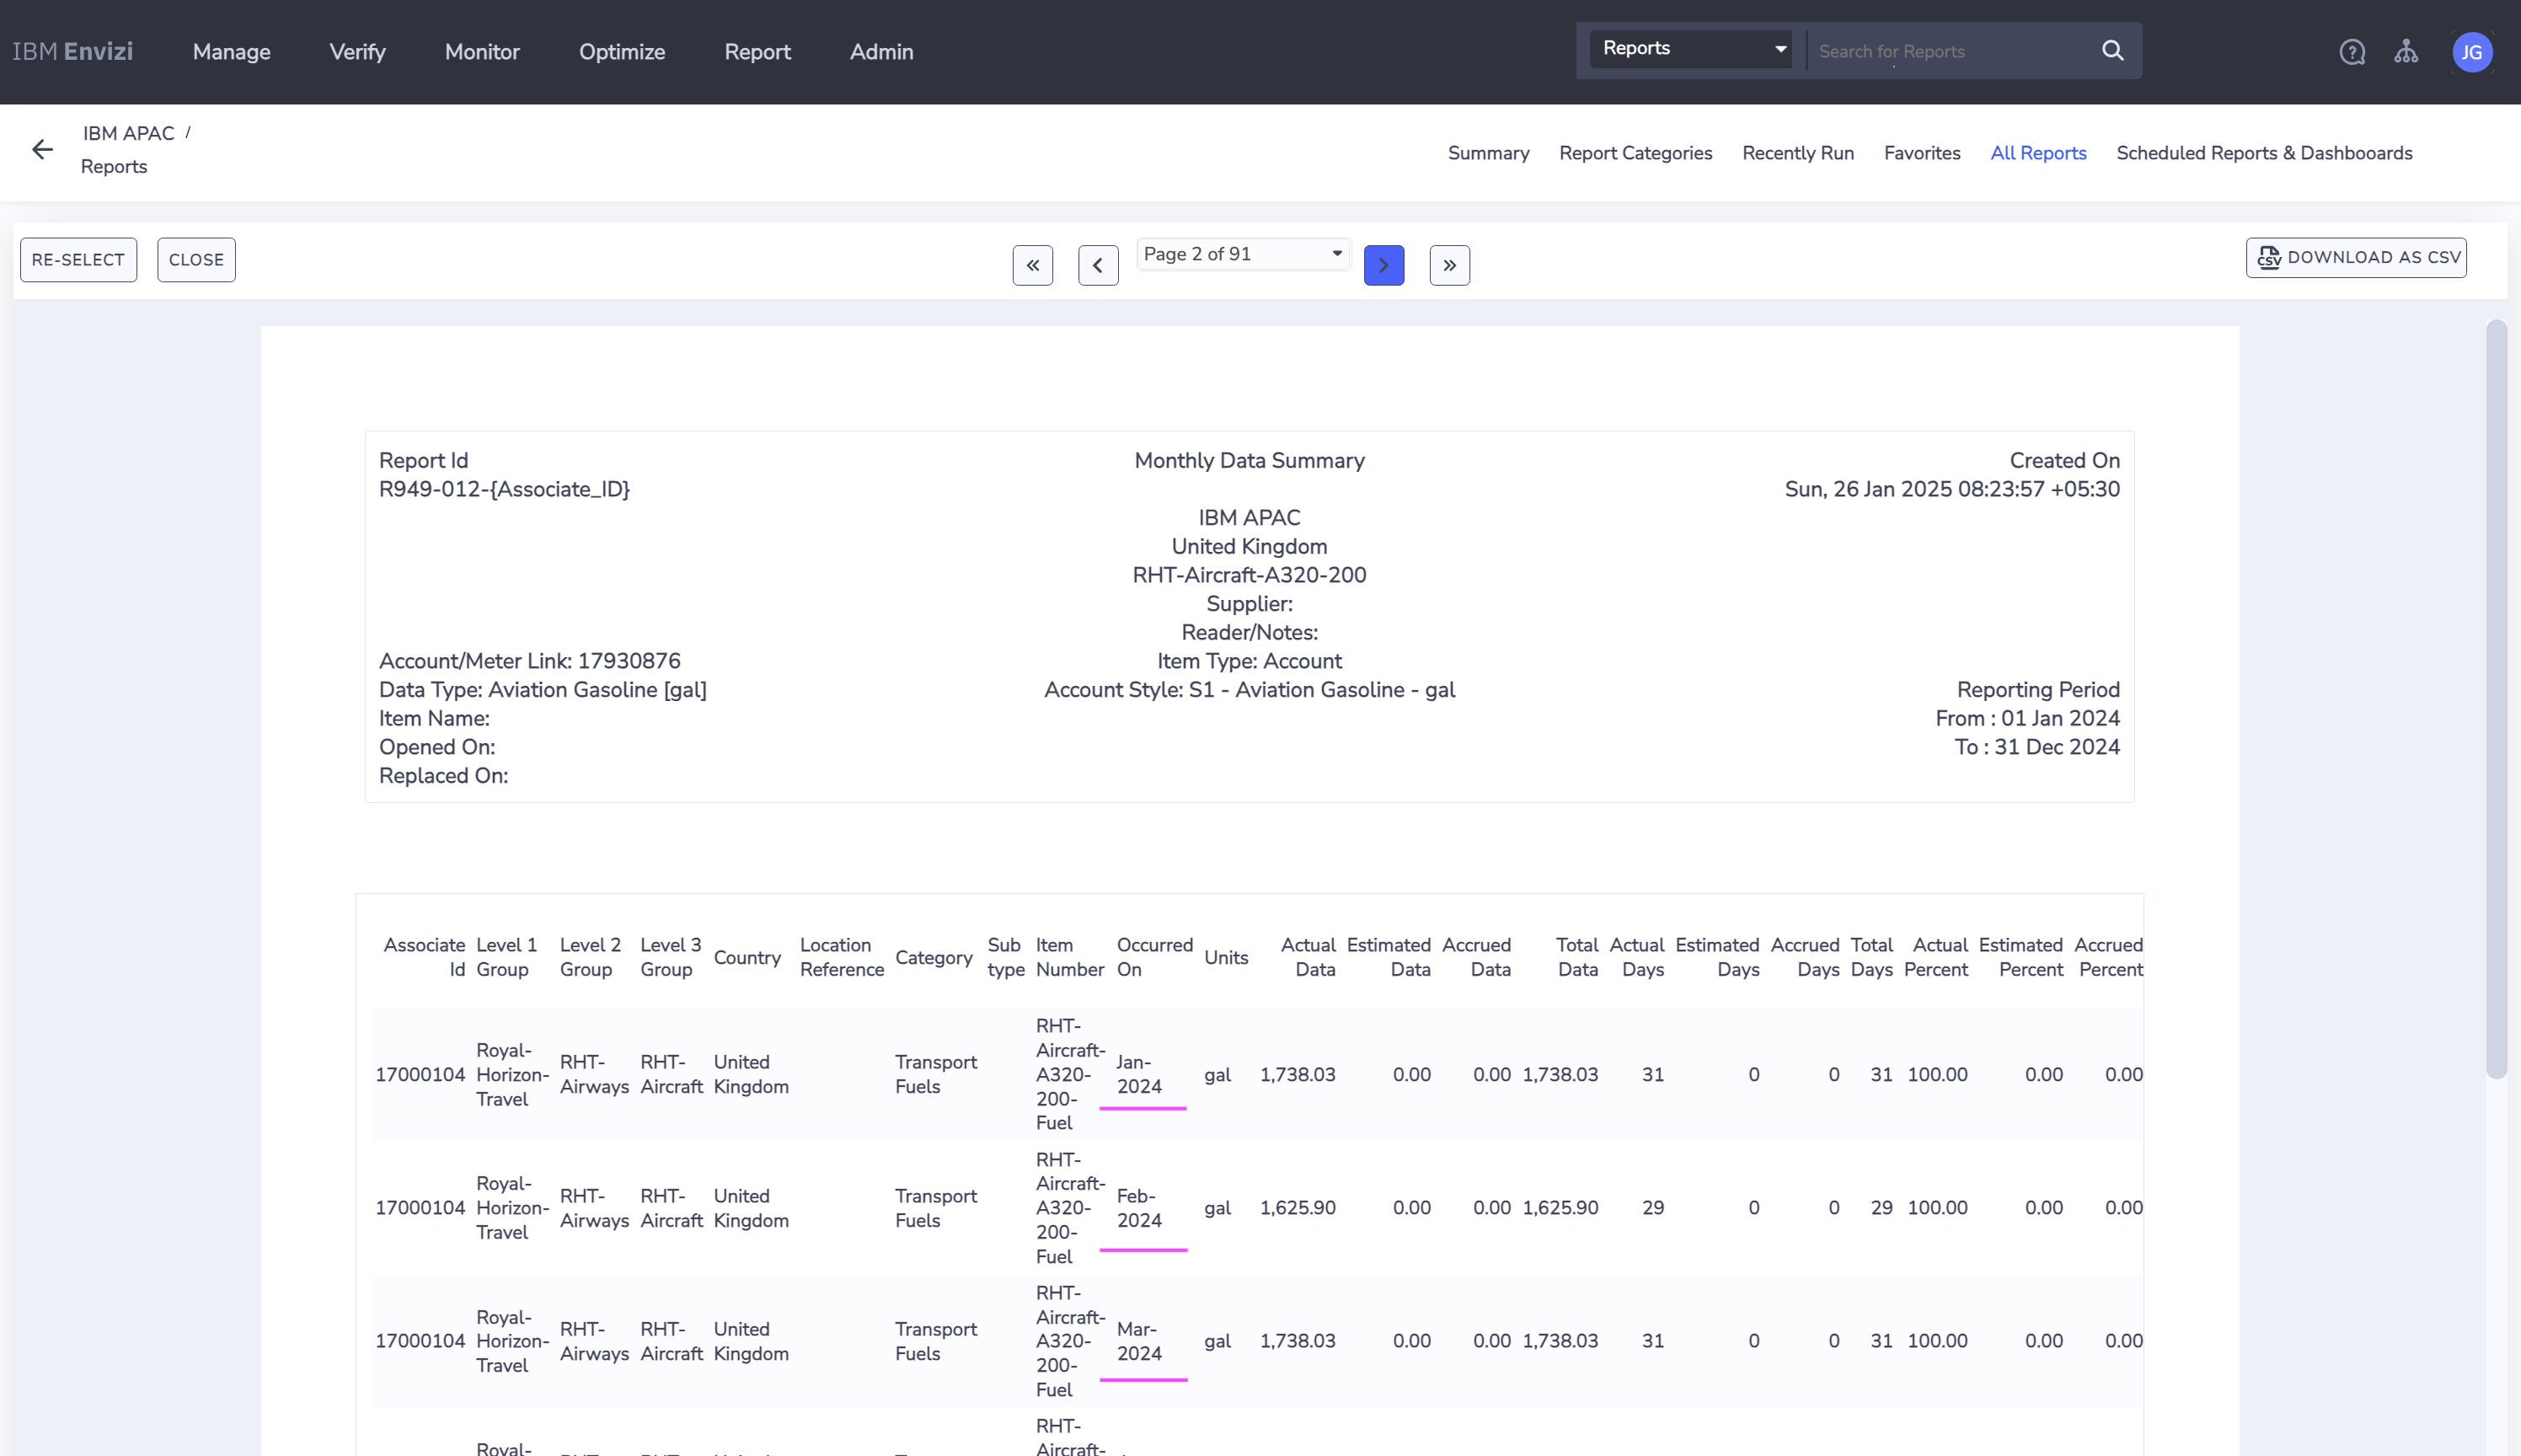
8.3 Monthly data summary report
You can apply filters to view the Monthly Data Summary Report.
The Royal Horizon Travel group is selected here.
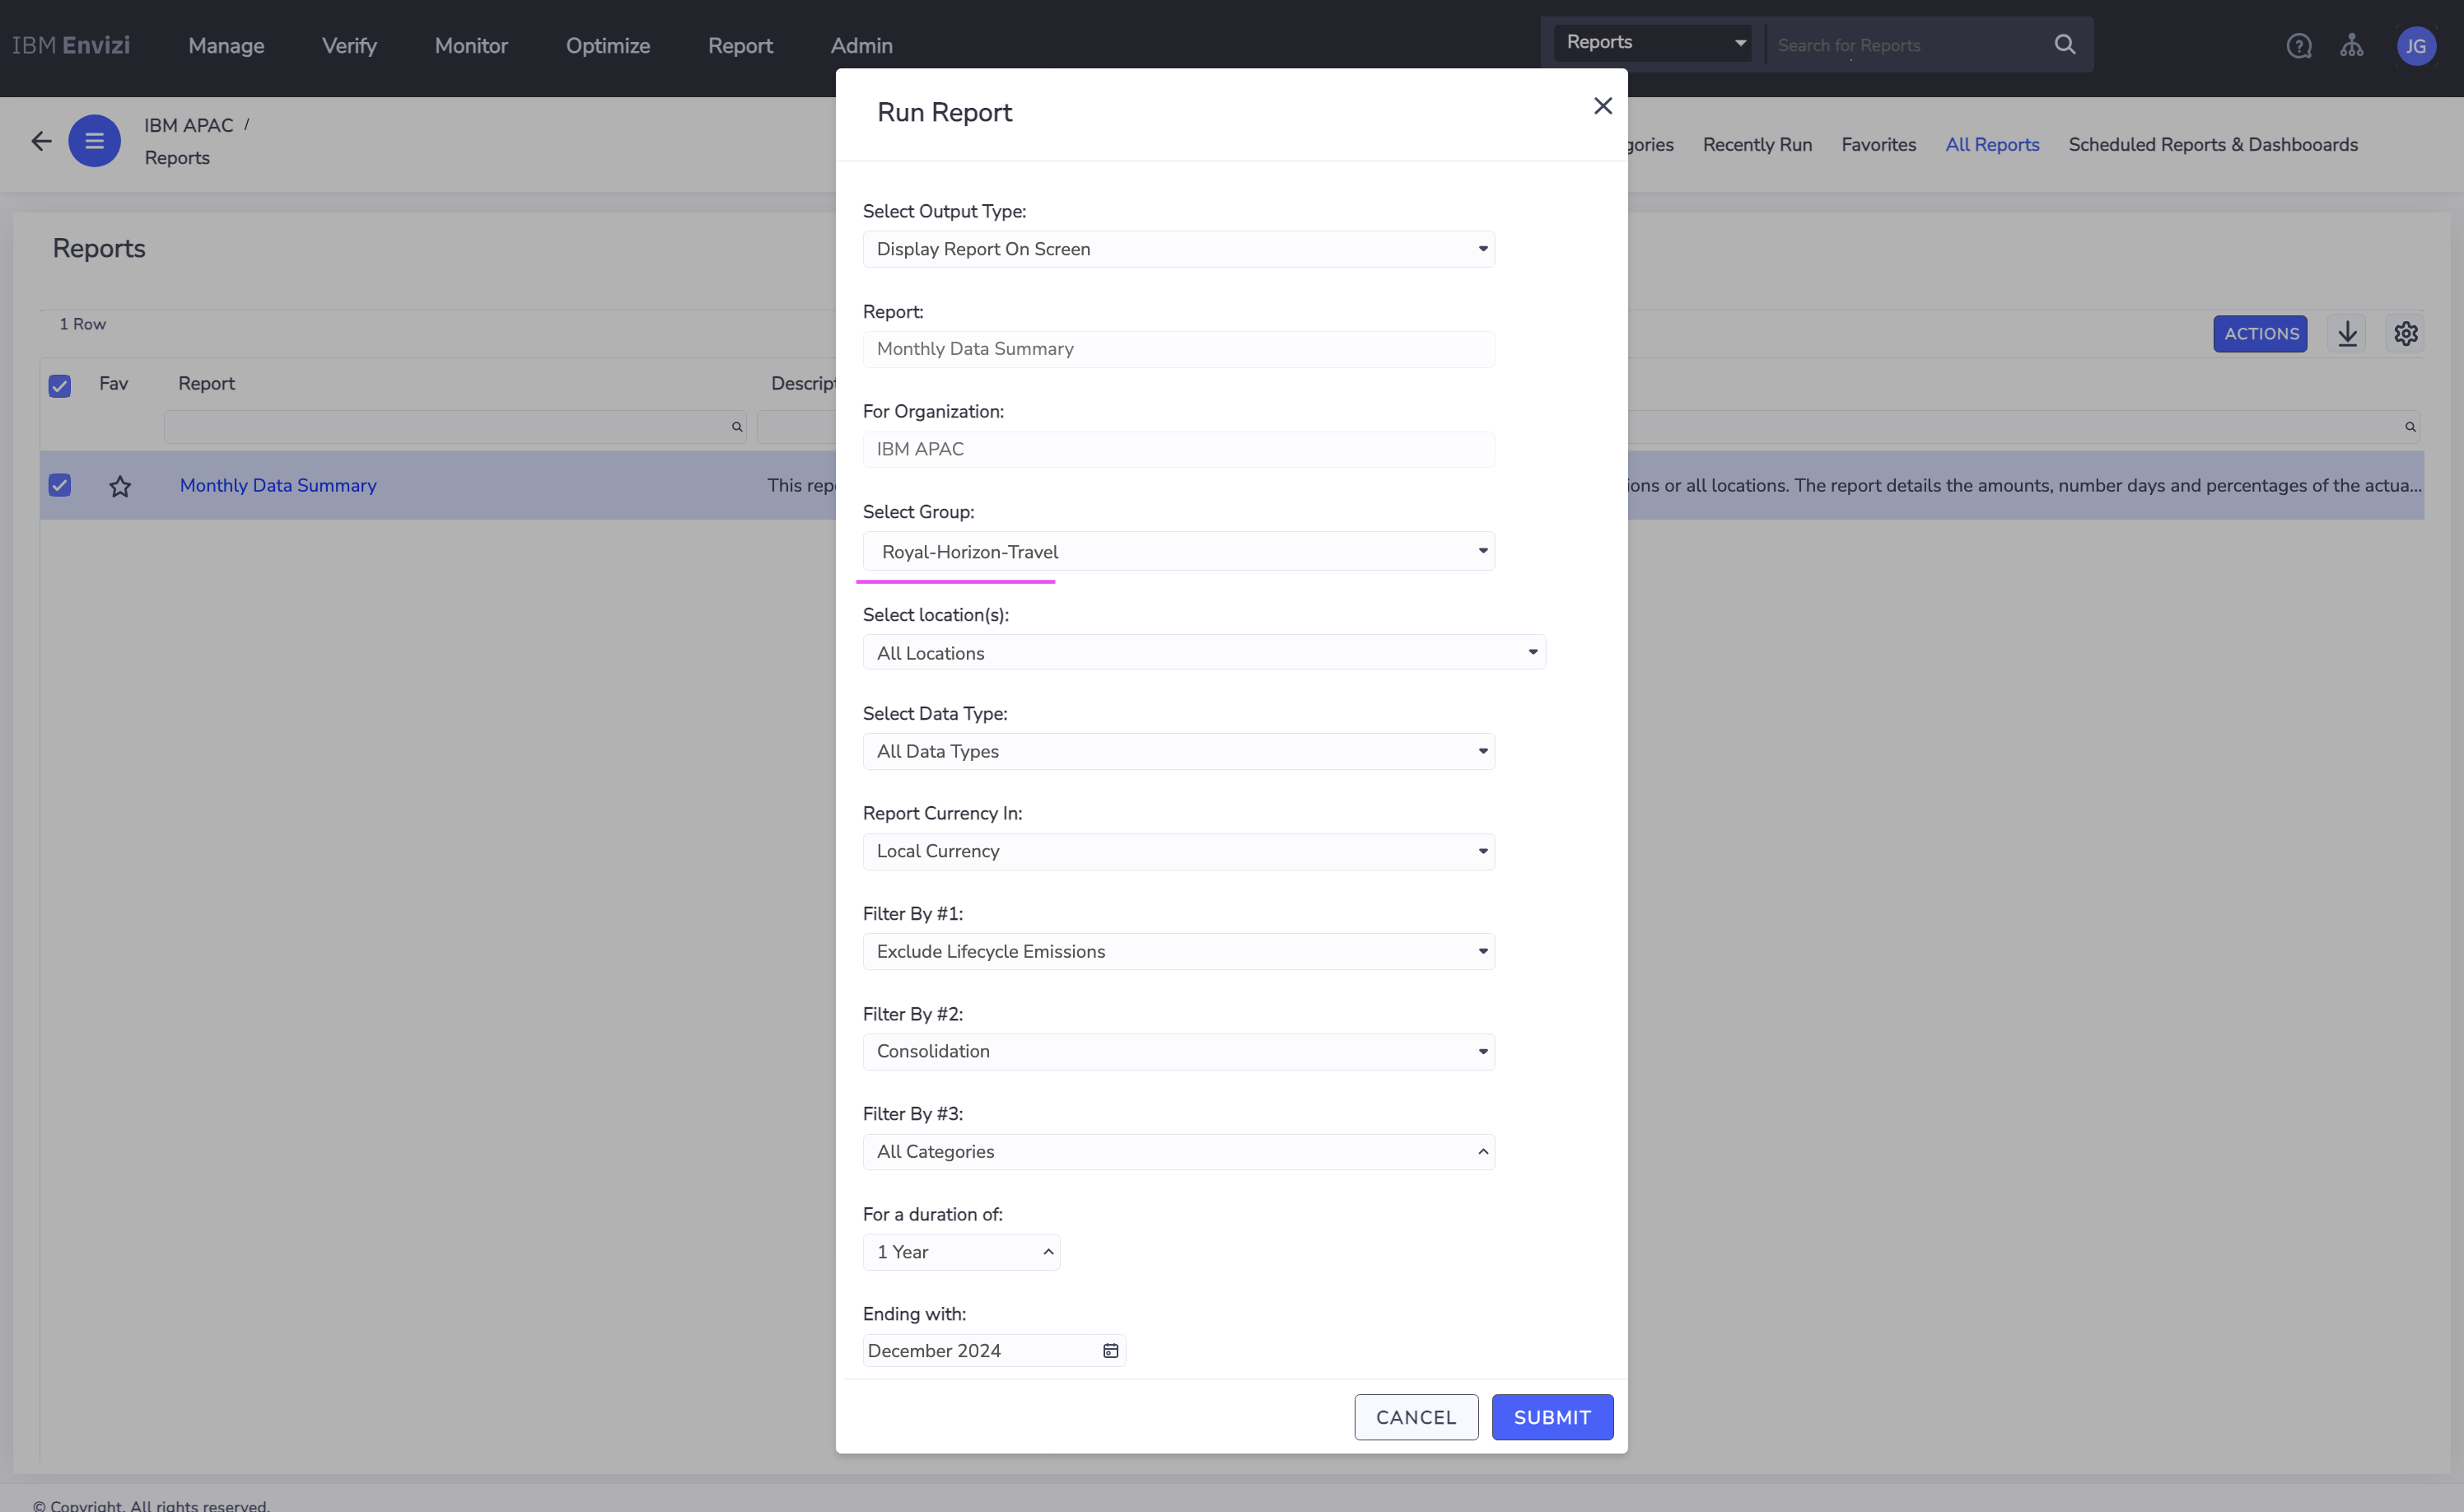
The report displays key data insights.
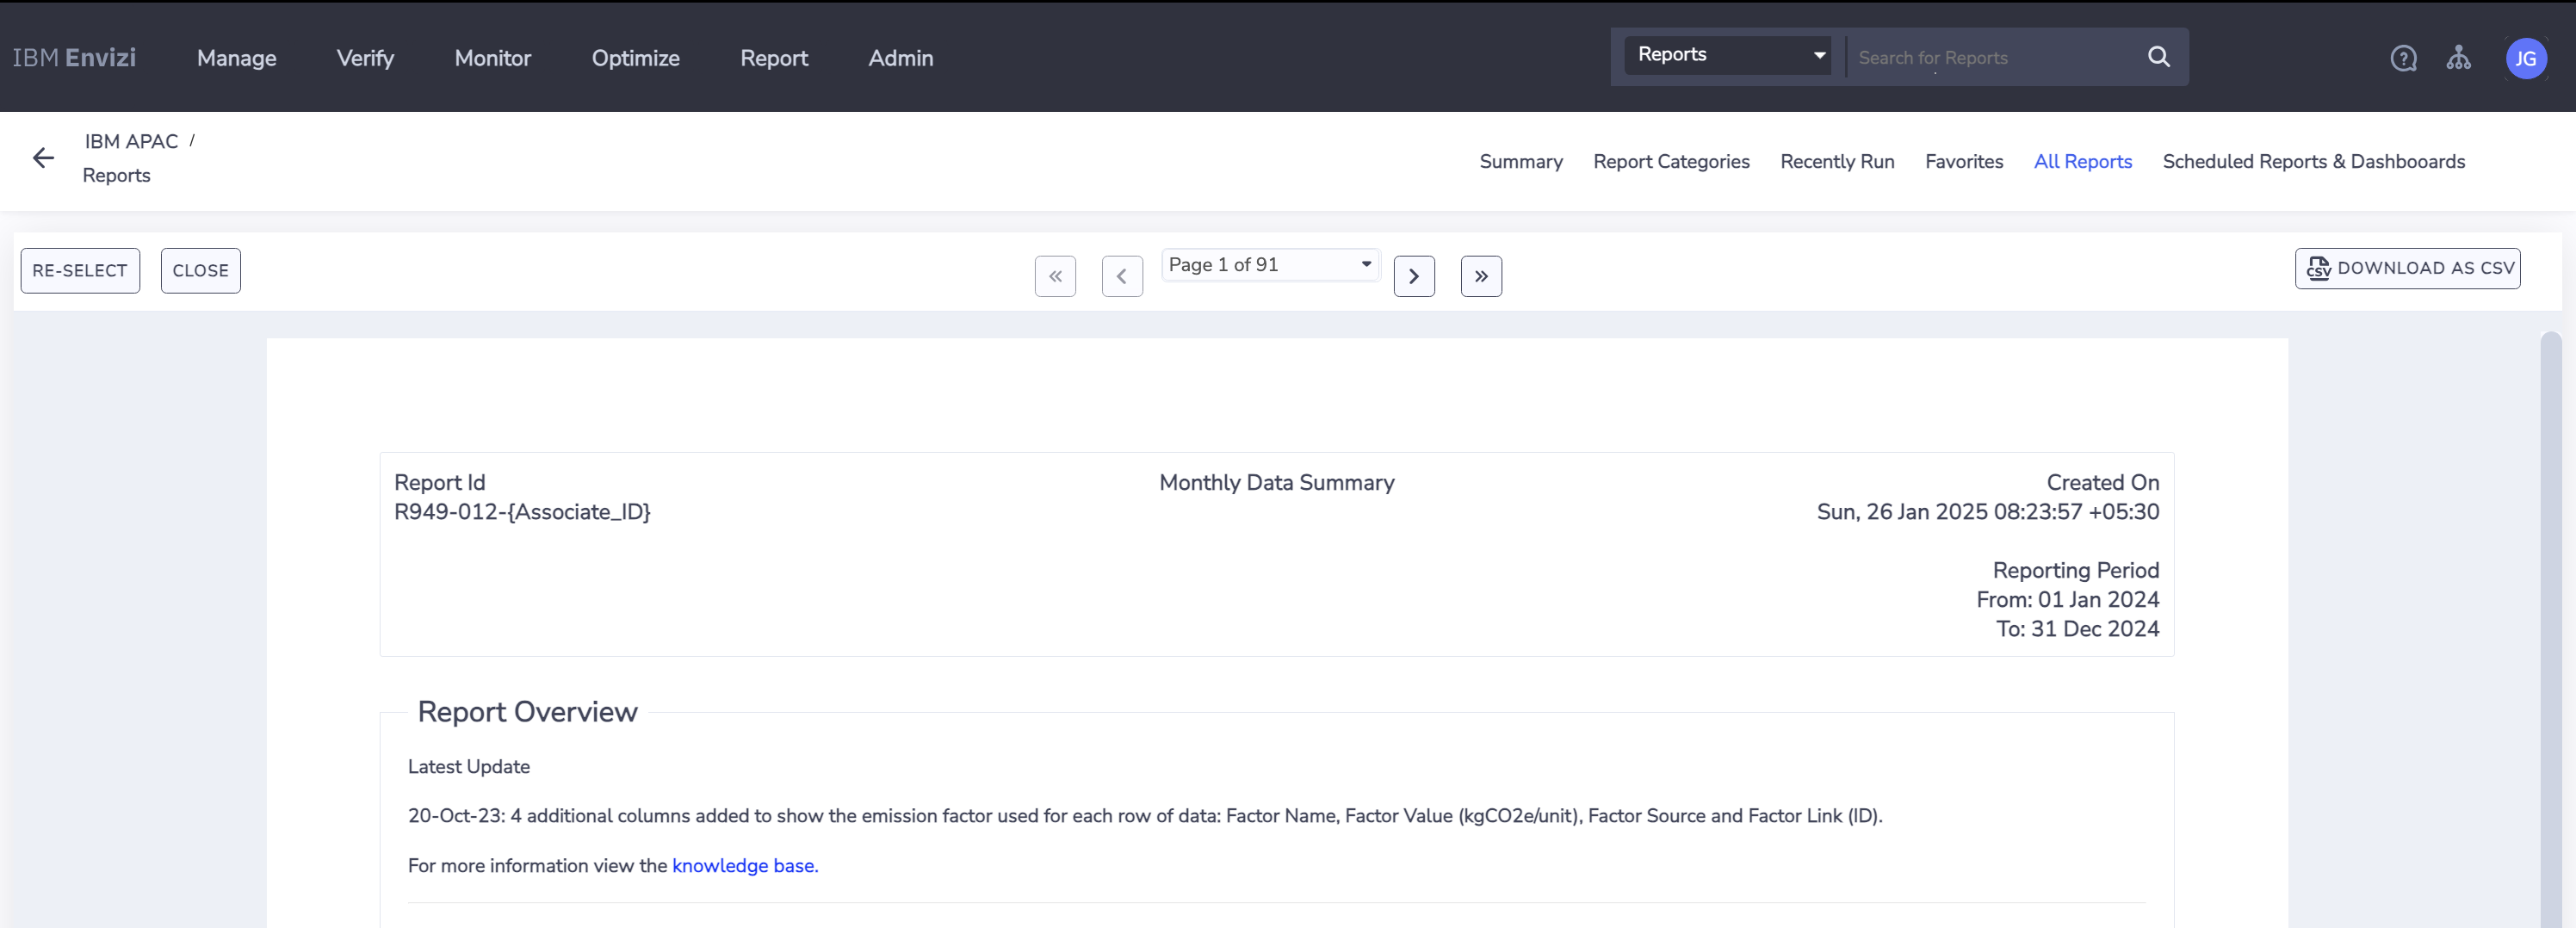
Monthly data trends are shown for analysis.
Summary and next steps
IBM Envizi ESG Suite offers features that the travel and transportation industry can use for their sustainability journey.
To get more information about IBM Envizi or to try it out yourself, start your 14-day IBM Envizi ESG Suite trial. You can also request a personalized IBM Envizi demo.