
What is OpenTelemetry?
OpenTelemetry definition
OpenTelemetry (OTel) is an open-source observability framework that allows development teams to generate, process, and transmit telemetry data in a single, unified format. It was developed by the Cloud Native Computing Foundation (CNCF) to provide standardized protocols and tools for collecting and routing metrics, logs, and traces to monitoring platforms.
OpenTelemetry provides vendor-neutral SDKs, APIs, and tools, so your data can then be sent to any observability back end for analysis.
OpenTelemetry is fast becoming the dominant observability telemetry standard in cloud-native applications. Adopting OpenTelemetry is considered critical for organizations that want to be prepared for the data demands of the future without being tied to a specific vendor or the limitations of their existing technologies.

So, what is telemetry data?
Telemetry data consists of the logs, metrics and traces collected from a distributed system. Known as the “pillars of observability,” these three categories of data helps, developers, DevOps and IT teams understand the behavior and performance of their systems.
Logs: A log is a text record of a discrete event that happened in a system at a particular point in time. Log entries are produced every time a block of code gets executed. They usually include a timestamp that shows when the event occurred along with a context payload. Log data comes in various formats, including plain text, structured, and unstructured. Logs are particularly helpful for troubleshooting, debugging, and verifying code.
Metrics: Metrics are numeric values measured over intervals of time, often known as time series data. They include attributes like a timestamp, the name of an event, and the value of an event. In modern systems, metrics allow us to monitor, analyze, and respond to issues and facilitate alerts. They can tell you things about your infrastructure or application like system error rate, CPU utilization, or the request rate for a service.
Traces: Traces represent the path of a request through a distributed system.Traces in OpenTelemetry are defined by their spans. A group of spans constitutes a trace. Tracing helps teams understand the end-to-end journey and behavior of requests through various services and components. Distributed tracing allows you to track a complete execution path and identify code causing issues. Traces provide visibility into the overall health of an application but limited visibility into its underlying infrastructure. To get a full picture of your environment, you need the other two pillars of observability: logs and metrics.
Brief history of OpenTelemetry
OpenTracing and OpenCensus were overlapping distributed tracing projects developed independently to address the lack of a standardized data format. OpenTelemetry was created to merge the codebases of the OpenTracing and OpenCensus projects, combining the strengths of each into a single project hosted by the Cloud Native Computing Foundation.
OpenTracing provides vendor-neutral APIs for sending data to a back end. OpenCensus was a collection of language-specific libraries developers used to instrument their code and send data to back ends. Both were open source, meaning the source code for the software is developed collaboratively and available for anyone to use, modify and distribute.
With OpenTelemetry, developers no longer have to choose between OpenTracing and OpenCensus. OpenTelemetry provides a unified set of libraries, APIs, agents and collector services for collecting and transferring data.
How does OpenTelemetry work?
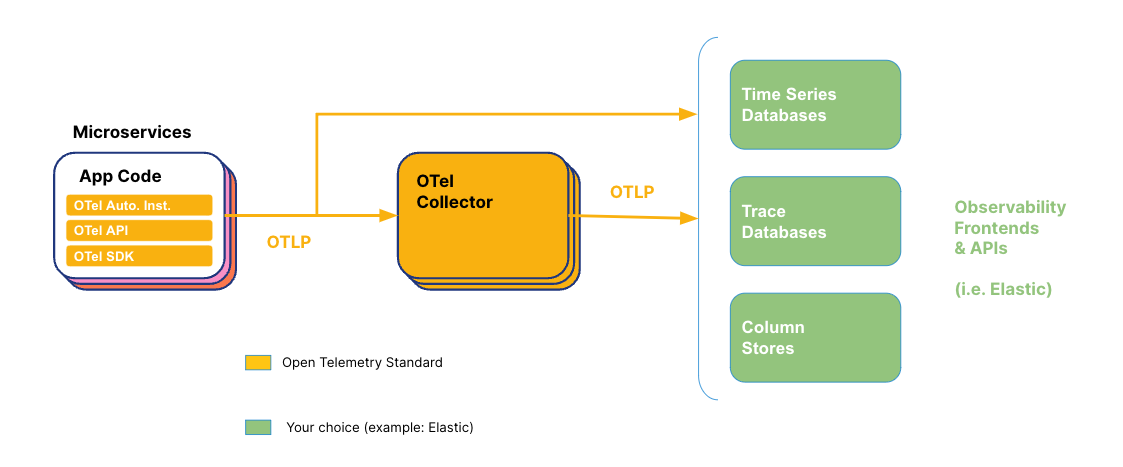
OpenTelemetry provides a common framework for collecting telemetry data and exporting it to an Observability back end of your choice. It uses a set of standardized, vendor-agnostic APIs, SDKs, and tools for ingesting, transforming, and transporting data.
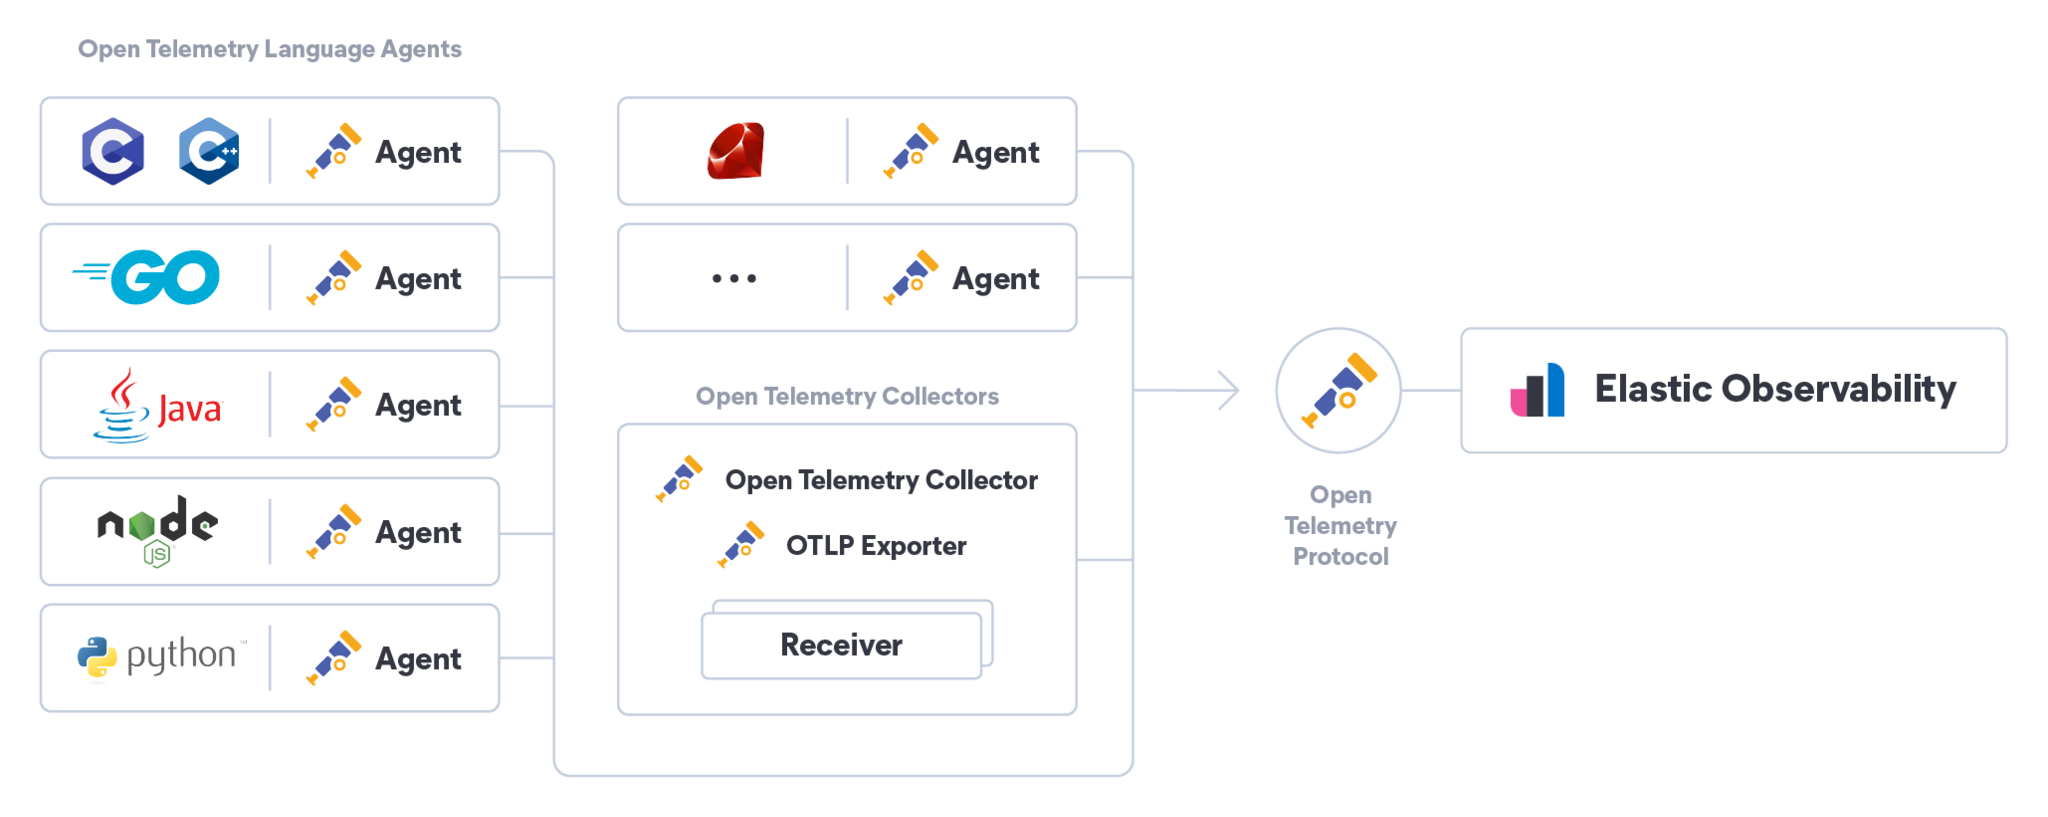
Language-specific OpenTelemetry APIs coordinate telemetry data collection across your system and instrument your code. OpenTelemetry SDKs implement and support APIs through libraries that help with data collection, processing, and exporting. OpenTelemetry also provides automatic instrumentation of services and supports custom instrumentation. You can export your telemetry data using either a vendor-provided exporter or the OpenTelemetry protocol (OTLP).

Core components of OpenTelemetry
The core components of OpenTelemetry include:
Collector
The OpenTelemetry Collector is a vendor-agnostic proxy that receives, processes, and exports telemetry data. It supports receiving telemetry data in multiple formats as well as processing and filtering telemetry data before it gets exported.
Language SDKs
OpenTelemetry language SDKs allow you to use the OpenTelemetry API to generate telemetry data with a language and export the data to a back end.
Instrumentation libraries
OpenTelemetry supports a wide array of components that generate relevant telemetry data from popular libraries and frameworks for supported languages.
Automatic instrumentation
A language-specific implementation of OpenTelemetry can provide a way to instrument your application without having to change your source code.
Exporters
By decoupling the instrumentation from your back end configuration, exporters make it easier to change back ends without changing your instrumentation. They also allow you to upload telemetry to more than one back end.
Benefits of OpenTelemetry
The benefits of OpenTelemetry are data standardization and future-proof flexibility that results in improved observability, increased efficiency, and reduced costs.
Standardization in data collection
OpenTelemetry provides a solution for DevOps teams looking for a consistent way to collect and export telemetry data to back ends like Splunk, New Relic, Dynatrace, and Datadog without having to change instrumentation. With open standards and standardized data collection, OpenTelemetry creates increased visibility and simplified observability. With observability that’s easier to set up, teams can better understand system health, identify performance issues, and reduce the time needed to fix root causes before service interruptions occur. Organizations that use OpenTelemetry don’t need to waste time developing in-house solutions or researching individual tools for multiple applications. By reducing noise, costs, and the need for configuration changes, OpenTelemetry allows organizations to focus on leveraging their data, rather than how it’s collected. And insights can be delivered to teams using the tools or formats that make the most sense, resulting in improved collaboration.
Avoiding vendor lock-in
OpenTelemetry frees up teams to choose any back end they want without being tied to a particular vendor, future-proofing their investments. It can accommodate changes to systems, back ends, and processes, so you’re never locked into a single platform, solution, or contract, allowing organizations to expand and adapt as their technology needs evolve. That independence and flexibility means you can base your business decisions on what's best for your bottom line and customers — not the limitations of your technology.
With OpenTelemetry, you get scalability for growth, compatibility across platforms, and easy integration with your existing monitoring and observability tools.
OpenTelemetry with Elastic
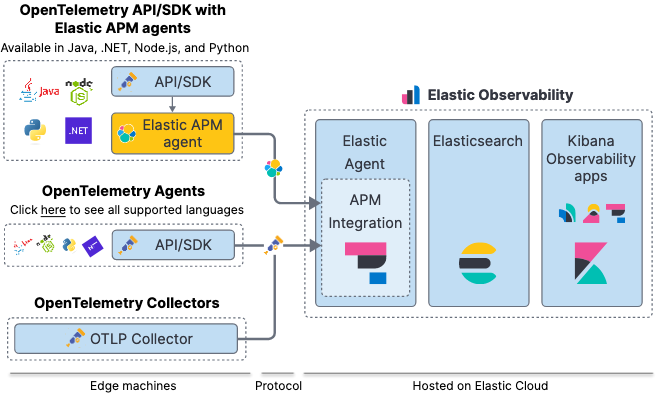
OpenTelemetry provides a standard way to instrument applications with a unified telemetry format, but it doesn’t provide back end or analytics components. Elastic Observability seamlessly integrates OpenTelemetry data into an open and extensible elasticsearch platform.
Elastic natively supports the OpenTelemetry protocol, allowing us to pull in logs, metrics, and traces across many languages. It makes it that much easier to take advantage of Elastic's powerful analytics and visualization capabilities at scale.
In April 2023, Elastic contributed its Elastic Common Schema (ECS) to OpenTelemetry with the long-term goal of converging Semantic Conventions with ECS for a common telemetry data schema. Elastic plans to standardize on OpenTelemetry for its data architecture and will be increasing its investment in and collaboration with the OpenTelemetry project in the future.

Elastic is also a strong contributor to the OpenTelemetry project. To help administrators monitor and troubleshoot their CI/CD platform and help developers increase the speed and reliability of their CI/CD pipelines, Elastic Observability provides visibility into CI/CD processes. To provide monitoring dashboards, alerting, and root cause analysis on pipelines, Elastic works with the communities of the most popular CI/CD platforms, including Jenkins, Ansible, and Maven, to instrument tools with OpenTelemetry.
Elastic Observability is an enterprise-grade solution that enables organizations to directly send data collected by OpenTelemetry instrumentation to Elastic deployments. It gives you complete visibility into your hybrid cloud applications and the ability to store, analyze, and visualize it all. You can also use Elastic's powerful machine learning capabilities to reduce analysis and recovery time.
OpenTelemetry FAQ
Is OpenTelemetry a standard?
Yes. OpenTelemetry is an open-source project and a unified standard for logs, traces, and metrics.
What are examples of telemetry?
Examples of telemetry data include logs, metrics, and traces used in system monitoring and observability.
What is the difference between OpenTelemetry and Jaeger?
OpenTelemetry helps you process and export data to a variety of open source and commercial back ends, but it is not an observability back end like Jaeger. While OpenTelemetry provides a set of APIs, SDKs and tools to help generate and manage telemetry data, Jaeger is an open-source distributed tracing tool. IT teams use Jaeger to monitor and troubleshoot applications based on microservices architecture. Jaeger does not support logs and metrics.
What is the difference between OpenTelemetry API and SDK?
OpenTelemetry APIs, or Application Programming Interfaces, coordinate telemetry data collection across your system and instrument your code. Because APIs are language-specific, they must match the language of your code. OpenTelemetry SDKs, or Software Development Kits, implement and support APIs through libraries that help with data collection, processing, and exporting to an observability back end.