About cookies on this site Our websites require some cookies to function properly (required). In addition, other cookies may be used with your consent to analyze site usage, improve the user experience and for advertising. For more information, please review your options. By visiting our website, you agree to our processing of information as described in IBM’sprivacy statement. To provide a smooth navigation, your cookie preferences will be shared across the IBM web domains listed here.
Article
Optimizing Java applications with JFR
A comprehensive guide to performance tuning and resolving thread contention and CPU issues
On this page
Have you ever struggled to debug a performance issue in your Java application? Perhaps your code works perfectly on your local machine but as soon as you deploy it is very sluggish. Maybe CPU spikes come and go without warning or thread contention slowly creeps up before everything grinds to a halt. You’re not alone. Debugging performance issues in Java apps can feel like chasing ghosts, especially when tools add more overhead than insight. That’s where JDK Flight Recorder (JFR) comes in.
JFR is a low-overhead, always-on profiler that is built into the JVM; no agents, no setup nightmares. JFR lets you record detailed events from deep inside the JVM: CPU sampling, garbage collection stats, thread contention, I/O bottlenecks, heap summaries, class loading, and more, all without dragging your app’s performance down. Additionally, JFR integrates seamlessly with JDK Mission Control (JMC), a powerful GUI for real-time monitoring and historical analysis. (JDK Mission Control (JMC) can be downloaded from the Oracle site.)
setting up our environment
Before we dive into some examples, here is how to get started:
We’ll be using a container with Java 17 and Open Liberty set up on it. We're using Podman as the container runner, but you could use Docker.
podman run -ti -d -p 9080:9080 -p 9443:9443 icr.io/appcafe/open-liberty:full-java17-openj9-ubi
podman ps // To find the name of the container
podman exec -it [container Name] /bin/bash
After you run these commands, you should be greeted with a standard bash prompt. Now, we can continue with trying out JFR.
Trying out JFR
To turn on JFR event logging on a running Java instance, we'll need the PID of that process. We'll be using jcmd to find that PID.
jcmd -l
The output should look something like this:
1 /home/test/JFR-BLOG/liberty/target/liberty/wlp/bin/tools/ws-server.jar defaultserver
1626 <no information available>
The first one is the one we’re interested in in this case, because it corresponds to the Liberty instance we’re running. If you use the help command with the process ID, you'll see additional info about what jcmd options that that instance accepts.
jcmd [pid] help
sample output:
Dump.heap
Dump.java
Dump.snap
Dump.system
GC.class_histogram
GC.heap_dump
GC.run
JFR.dump
JFR.start
JFR.stop
JVMTI.agent_load
Thread.print
help
jstat.class
We can see that the JFR commands are available for that running process so we can go ahead now and start JFR logging.
jcmd [pid] JFR.start filename=jfr-blog.jfr duration=60s
To make the data a little more interesting, we’re going to query the server for some info by using curl.
for i in `seq 1 10`; do curl -s -w ''%{http_code}'' http://localhost:9080/crud/fruits; echo $i; sleep 1; done
The previous JFR start command includes a duration that will make it stop after a minute. There’s also the option to let it run by only giving it a filename and then stopping it at a later time by doing the following.
jcmd [pid] JFR.start filename=jfr-blog.jfr
jcmd [pid] JFR.stop
Analyzing the JFR file
We now need to copy the JFR file over to our local machine so we can analyze it.
podman cp [container Name]:/liberty/jfr-blog.jfr ./
Once we have the recording, we can view it in JDK Mission Control (JMC). (We used Version 9.1 for this tutorial). When you first open up the file in JMC, you’ll see some automated analysis info. Clicking on the various alerts will display more information about them.
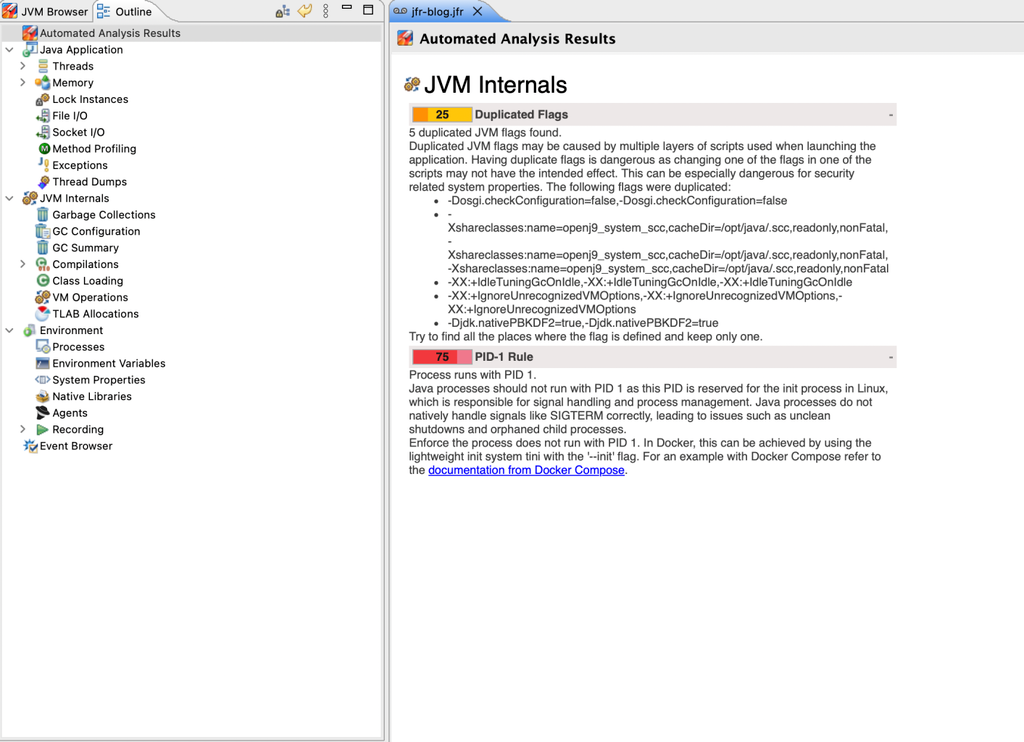
On the left side of the window, you’ll see various views that are available. The Java Application view is the holistic view of the application run.
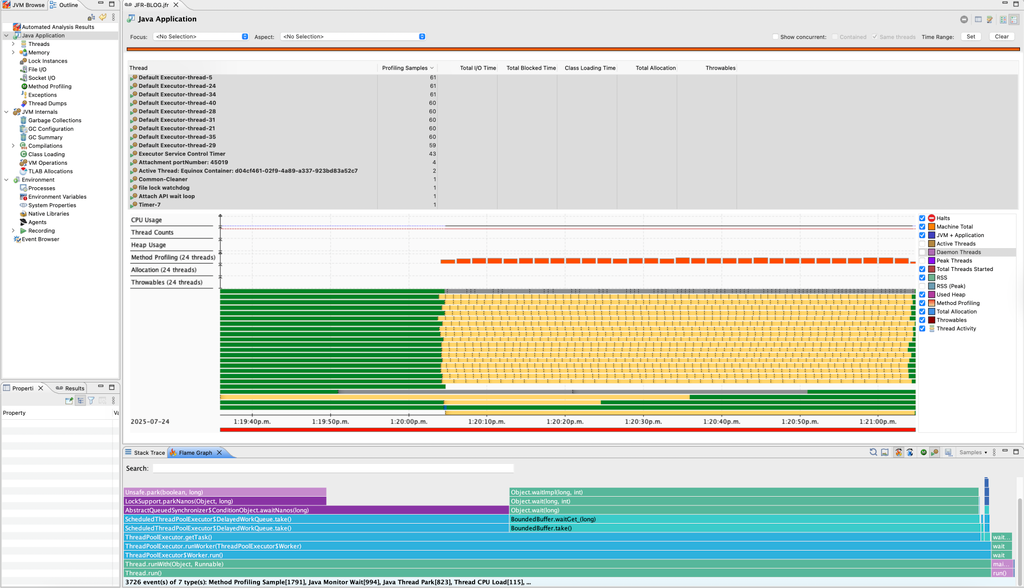
All threads are selected in the example above which makes the overall flame graph for this run visible in the bottom. Hovering over a specific entry in the graph will provide additional information about that method.
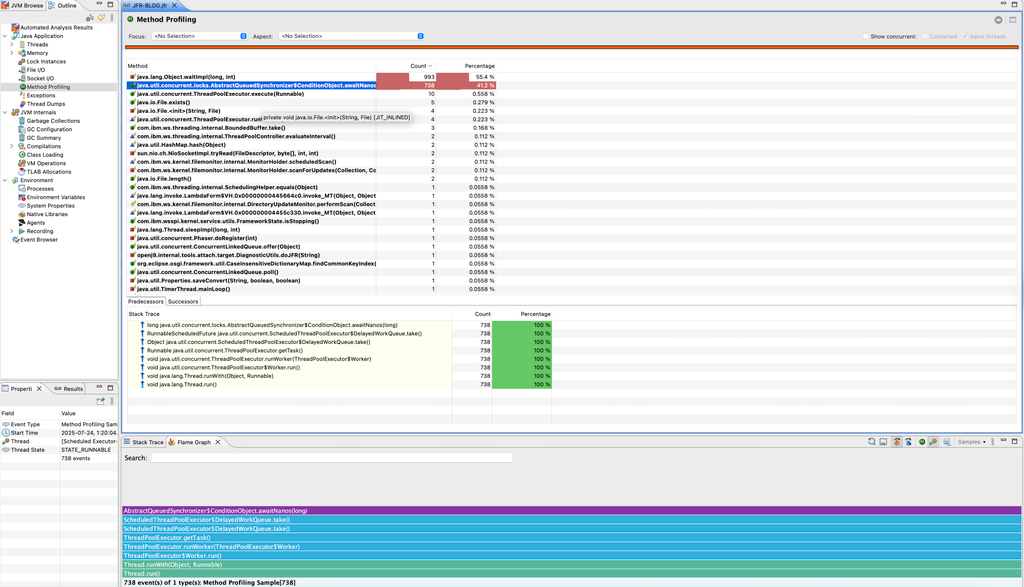
The method profiling view allows for more in depth analysis of where the application is spending its time.
We’ve gone over some basic setup and usage of JFR and JMC. We’ll now move on to some more specific examples.
Using JFR to debug performance issues
Here are some examples on how to use JFR to debug performance issues:
Thread contention
One common issue is thread contention, this typically occurs when multiple threads are attempting to acquire a shared resource like entering a monitor. JFR has an automated analysis that informs you when this might be the case.
When there is high thread contention, it is often the case that threads will spend a lot of time blocked or there will be a high rate of context switches, or both. JMC identifies these cases in the summary of the automated analysis. One can dig a little deeper and get more details by expanding the entries.
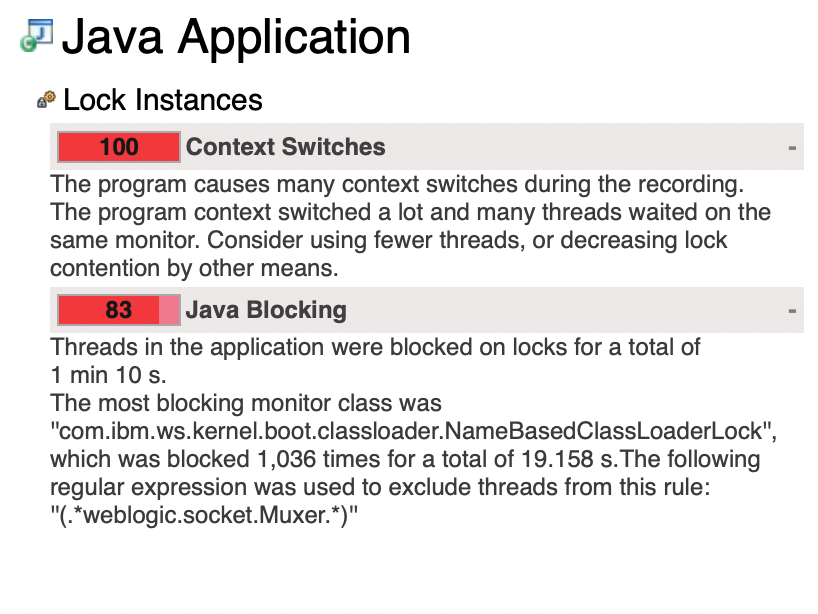
The lock instances view helps to identity which threads are involved in high contention.
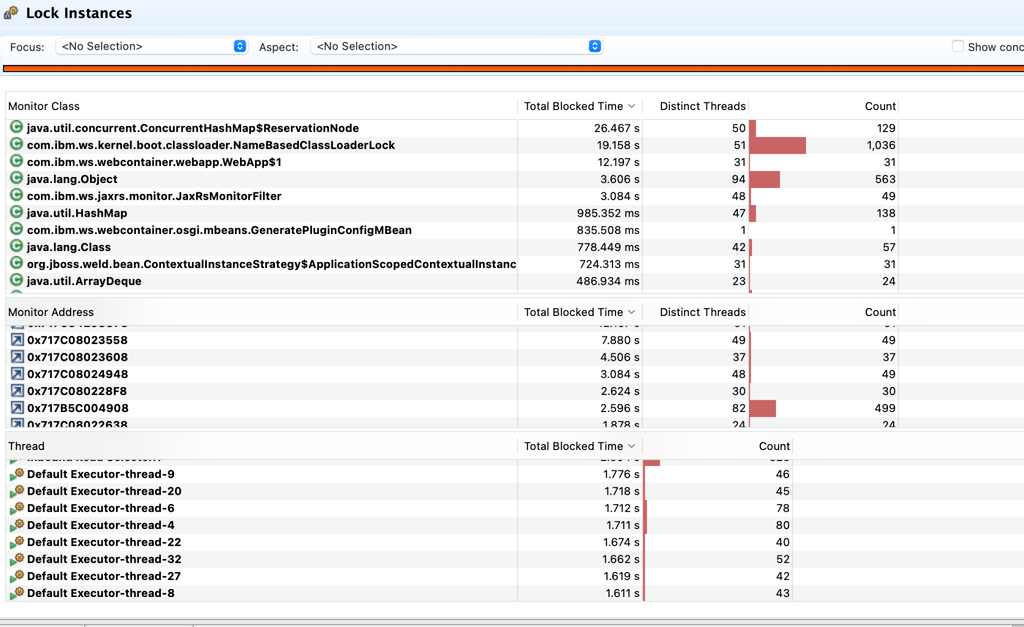
The top section shows the monitor classes involved, the second section shows the addresses of the specific monitor instances associated with the selected monitor class and the third section shows all the threads that have contended on monitors from the selected monitor class. In this case, the suggested course of action by JMC would be to reduce the number of threads that are running in the application. streamlining thread usage and the logic of the application is likely necessary to reduce contention further.
CPU contention
Another issue that can occur in production systems is CPU contention. This is the case where the JVM application of interest suffers as its unable to get enough CPU resources. similar to thread contention, the JMC automated analysis results can flag this scenario.
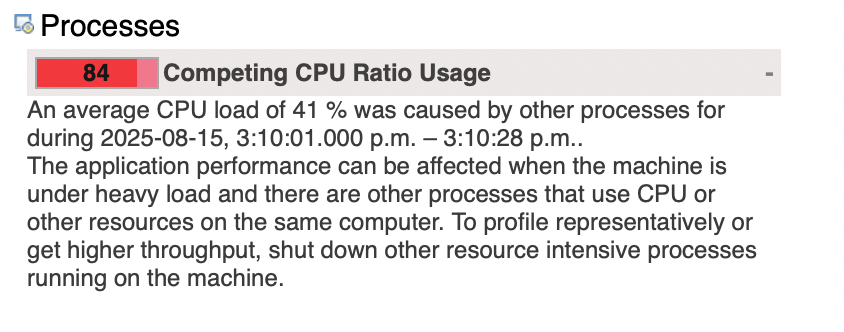
To investigate this case further, one can look at the processes view.
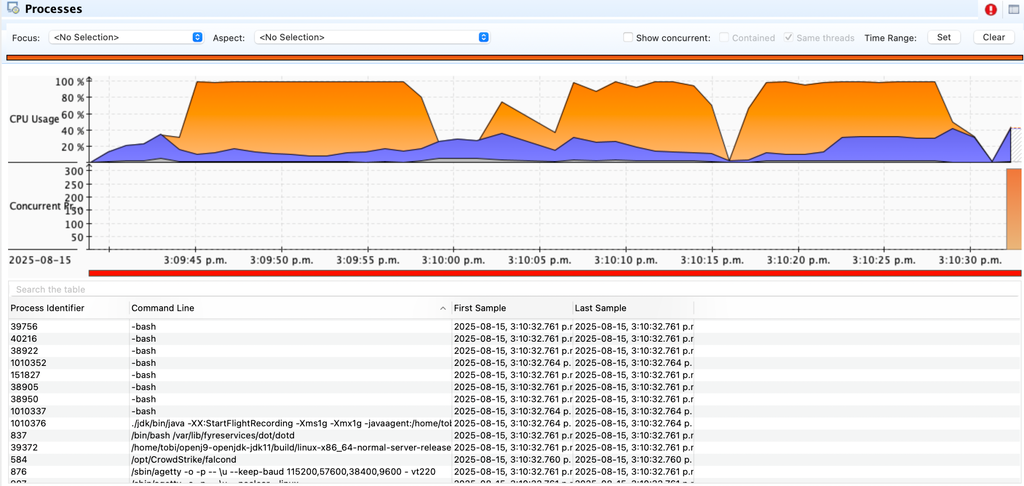
The top view illustrates the CPU usage. It shows JVM in purple, kernel in grey and system in orange. In this case, it is clear that JVM is competing with other process for CPU time. The bottom section shows all the other processes that are currently running on the machine, this can help to identify the processes that are consuming CPU resources. Reducing the amount of other processes running on the machine as is suggested in the automated analysis can help alleviate some the CPU contention in this case.
summary
JFR is a powerful addition to the performance analysis toolset available in IBM semuru Runtimes. Because JFR is built into the JVM, it affords low-overhead and easy usage. No extra agents or other configurations are needed. JFR output can be visualized in JMC to debug a variety of perfomance issues and bottlenecks, including thread and CPU contention.
Next steps
For more information about JFR in IBM semeru Runtimes, check out the docs.
Check out this article, "Collecting and transporting a JFR dump from a containerized environment," for information about how to configure and record a JFR dump from a running semeru application in a containerized environment (specifically an Openshift environment) and transport it to your local system.
Download IBM semeru Runtimes today!