Accelerate transformation with cloud‑native architectures

Cloud native means continuous integration and continuous delivery of software on dynamic, ephemeral, and autoscaling workloads. Your observability solution needs the ability to ingest telemetry from your dynamic and evolving ecosystem. Elastic Observability delivers unified and actionable observability for your cloud-native tech stack, pulling all of your logs, metrics, and traces together, in context.

Quick start guide to Elastic Observability

Find out more

Learn why observability is fast becoming a strategic imperative for organizations.

Watch now

Elastic was named a leader in the GigaOm Radar Report for Cloud Observability — read the report to learn why.

Learn more

Seamlessly connect cloud providers and cloud-native services

Ingest telemetry data from all major cloud providers and unify the monitoring of your complex hybrid or multi-cloud ecosystem using out-of-the-box visualizations.
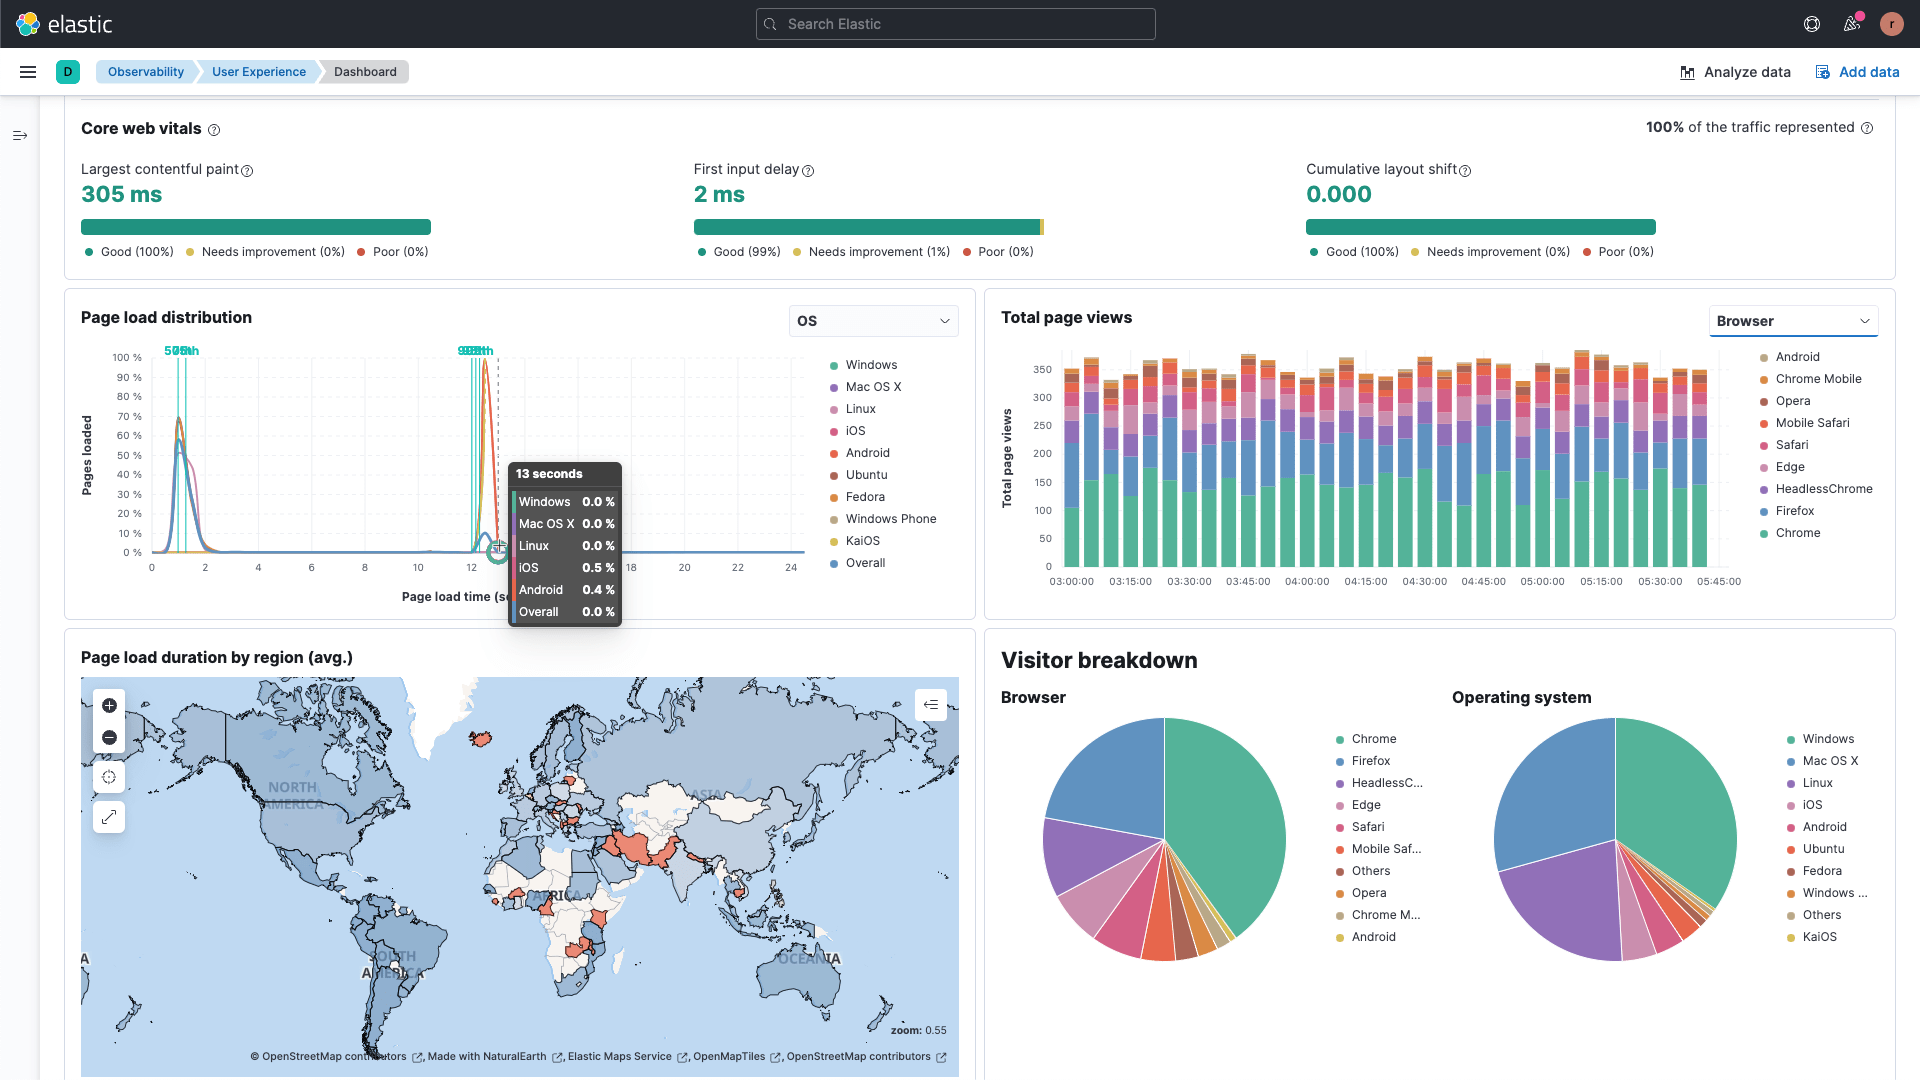
Screenshot

Correlate Kubernetes infrastructure with application performance

Centralize the logs, metrics, and traces from your Kubernetes clusters, wherever you run them, whether it's vanilla k8s, on-prem OpenShift, Amazon EKS, Azure AKS, or Google GKE. Understand how nodes, pods, and containers impact application performance and investigate issues with a single click.
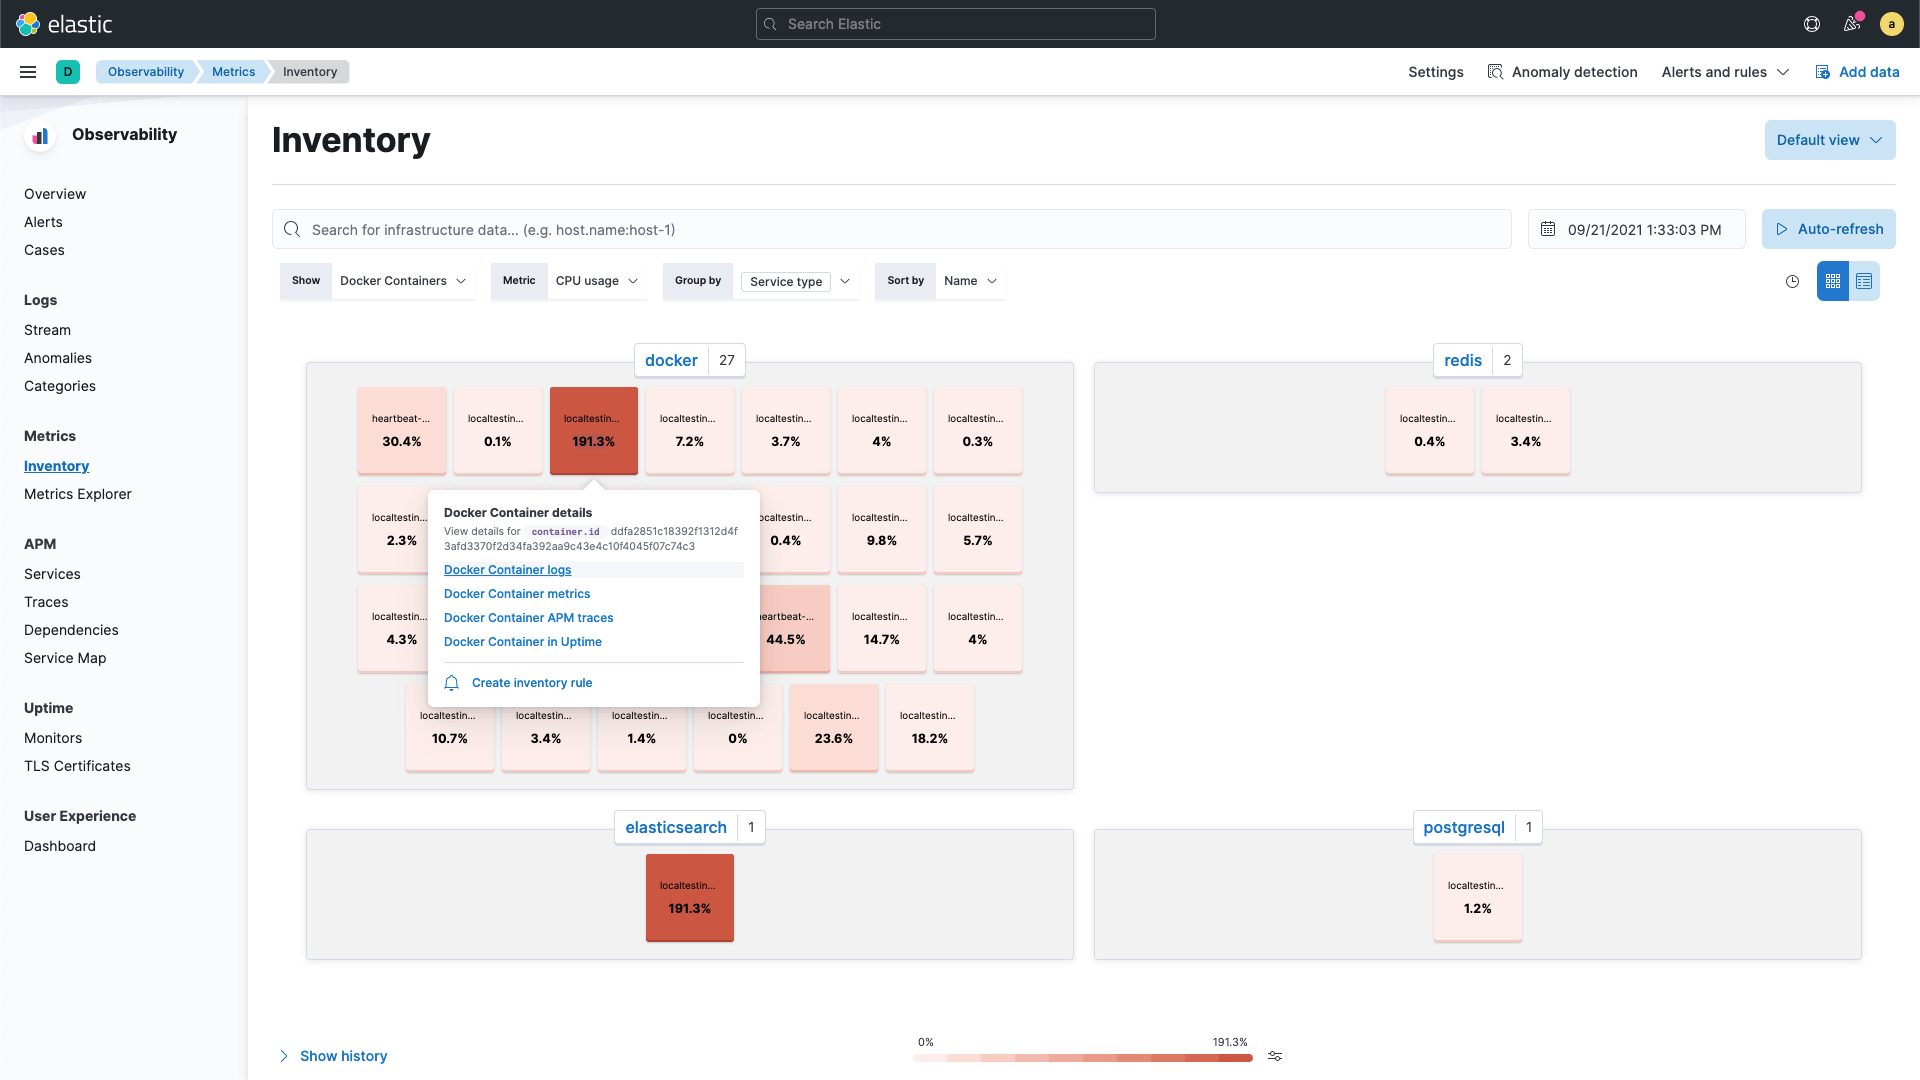
Screenshot

In-depth insights into your serverless environment

Serverless architectures take on-demand process execution to the next level with event-driven scheduling of workloads. Get the same insights into your serverless environment as the rest of your infrastructure on a single dashboard.
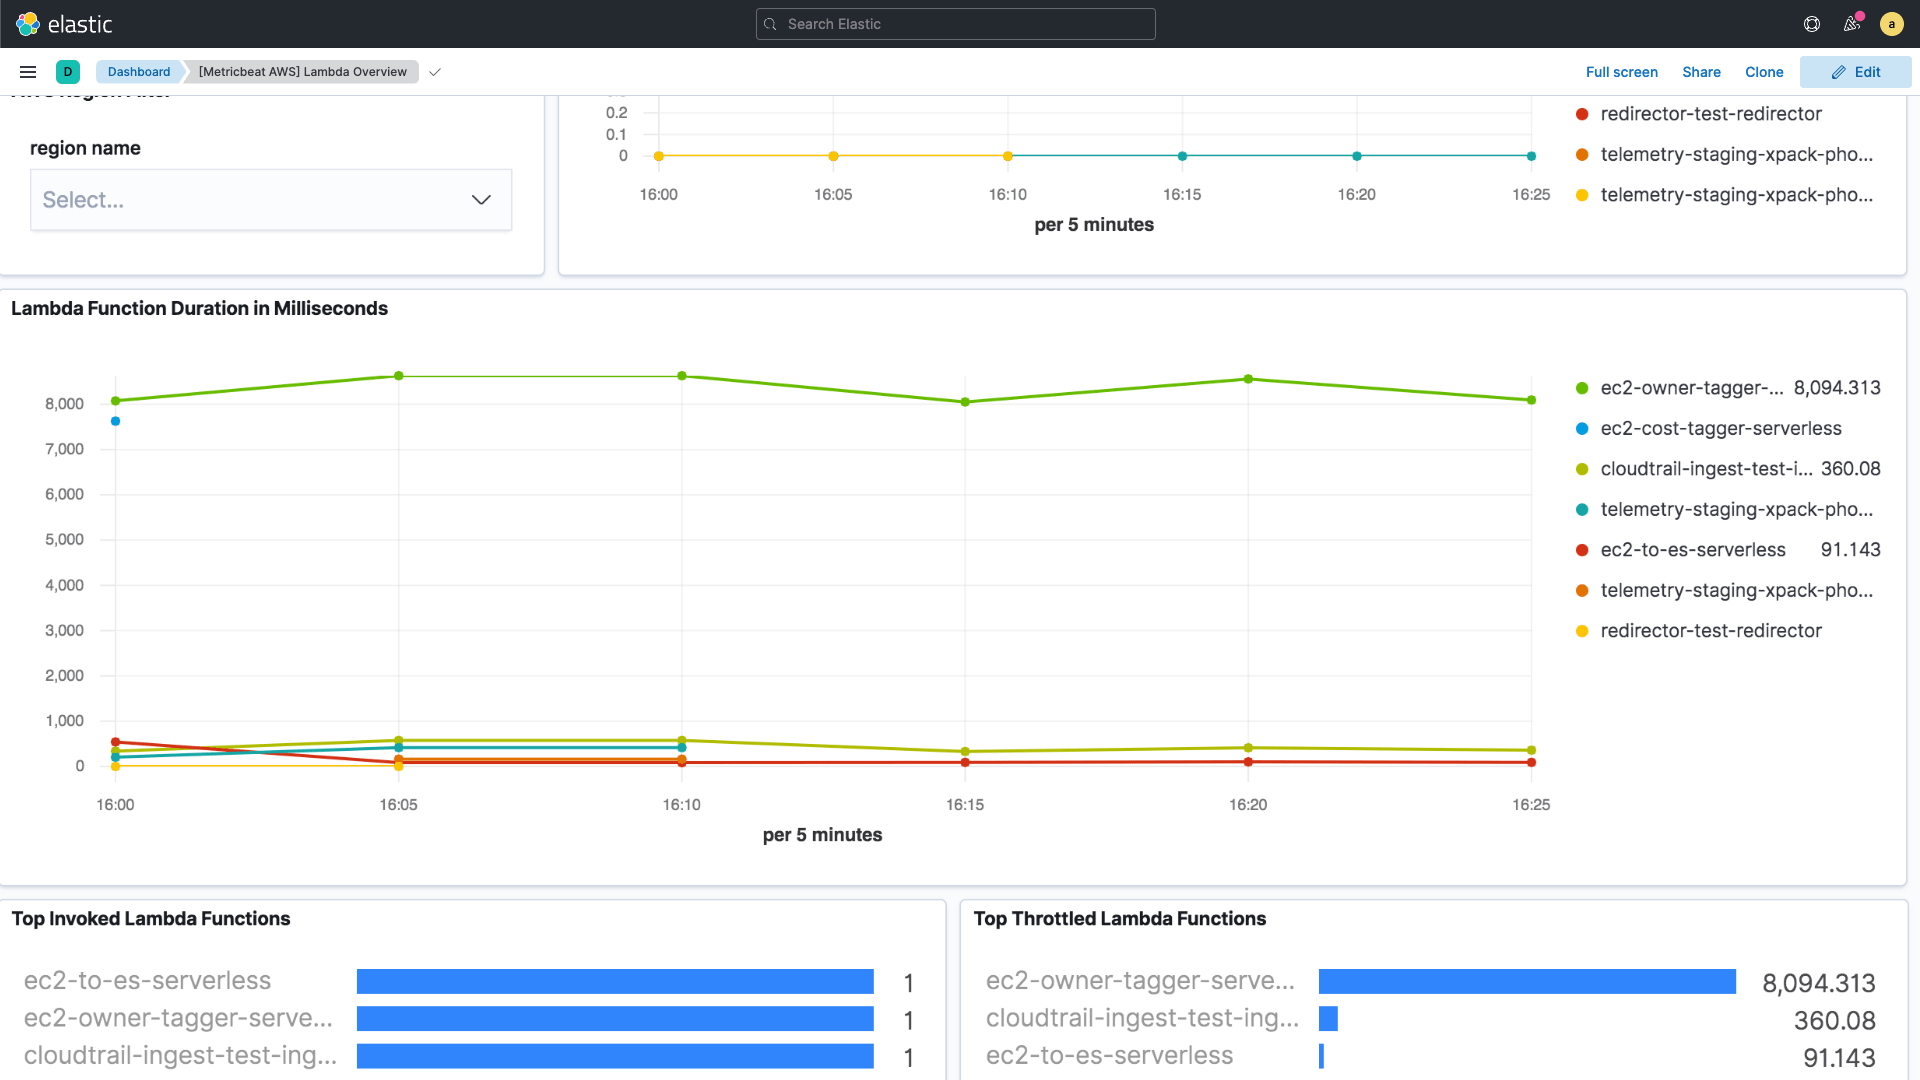
Screenshot

Get deeper insights into your cloud‑native services

Elastic Observability has out-of-the-box integrations for services commonly associated with Kubernetes and cloud-native deployments. Gather telemetry from all layers, including network, load balancers, and orchestration, along with services like message buses and data storage.

  • Service mesh and DNS

    Pods and containers communicate with each other. Gathering telemetry data from the underlying connectivity frameworks, such as Istio and CoreDNS, can help troubleshoot and resolve name resolution, connectivity, and proxy issues.

  • Load balancing and messaging

    Whether you are simply distributing the load between instances or peeling off a percentage of requests to compare deployments, monitoring your load balancing layer with the Envoy or NGINX integrations is just as easy as monitoring ActiveMQ or Kafka messaging.

  • Key-value and data storage

    Your workloads are ephemeral, but odds are that your data isn't. Quickly identify issues with popular data stores like Redis or etcd, relational databases like MySQL and Postgres, or check on the status of your Ceph-managed storage.

Build, deploy, and operate highly reliable cloud-native applications

Achieve full-stack observability of your cloud-native applications with Elastic Observability, including Kubernetes and serverless monitoring.

  • Cloud monitoring

    Proactively detect and resolve issues in an increasingly complex hybrid and multi-cloud ecosystems.

  • Kubernetes monitoring

    Gain real-time visibility into your Kubernetes ecosystem.

  • Serverless monitoring

    Get unified visibility of your serverless applications.