About cookies on this site Our websites require some cookies to function properly (required). In addition, other cookies may be used with your consent to analyze site usage, improve the user experience and for advertising. For more information, please review your options. By visiting our website, you agree to our processing of information as described in IBM’sprivacy statement. To provide a smooth navigation, your cookie preferences will be shared across the IBM web domains listed here.
Tutorial
Local LLM observability with Instana
Monitor LLM applications with local-hosted observation with IBM Instana
On this page
Large language models (LLMs) are driving a new era of AI applications, from chatbots and virtual assistants to automated document processing and beyond. As these systems scale, maintaining visibility into their performance, reliability, and cost becomes critical. Traditional monitoring tools often struggle to capture the dynamic and complex behavior of LLM-based workflows. We can monitor our LLM application in one of two ways:
- Local-hosted observation
- Cloud-hosted observation
In this tutorial, we will cover local-hosted observation. (We cover cloud-hosted observation in this other tutorial.)
IBM Instana is a powerful application performance monitoring (APM) tool and observability platform that is built to deliver real-time, enterprise-grade insights across modern, distributed applications.
- Delivers accurate, real-time data with full contextual visibility for all teams.
- Provides high-fidelity telemetry with no sampling, 1-second metric granularity, and end-to-end tracing.
- Helps reduce alert noise through intelligent issue detection and automation
- Enables clear visibility into dependencies across mobile, web, applications, and infrastructure, supporting 300+ technologies.
- Offers a user-friendly, quick-to-deploy solution with no specialized expertise required and transparent, predictable pricing.
With Instana, organizations can achieve deep observability into LLM workloads—enabling proactive performance tuning, faster troubleshooting, and better cost control.
Architecture overview
Observability is crucial for understanding the behavior, performance, and cost of generative AI applications. IBM Instana makes this possible by capturing and visualizing telemetry from large language model (LLM) workflows in real time.
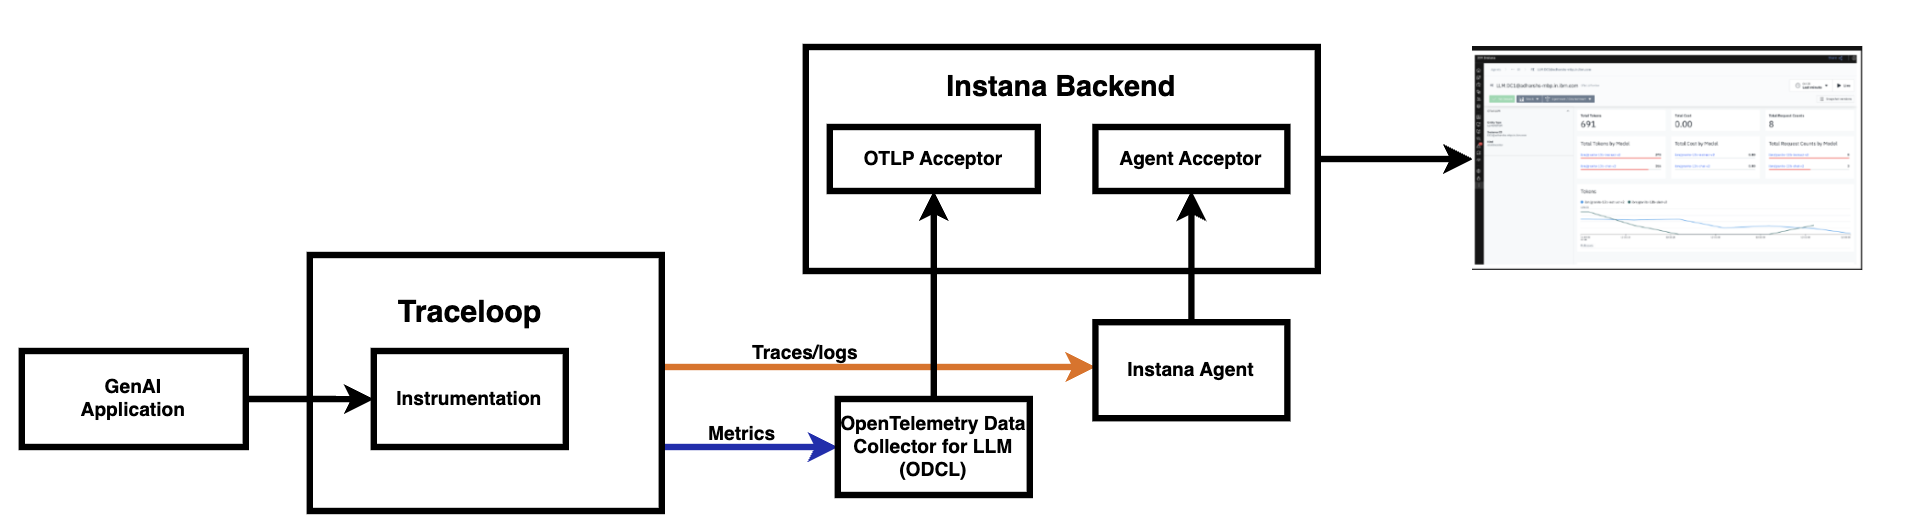
In this local-hosted setup, the generative AI application is instrumented using the Traceloop SDK, which collects key telemetry signals—traces, logs, and LLM-specific metrics, as the model processes requests. These signals are then exported to Instana using one of two supported modes: agent mode or agentless mode, depending on your deployment needs.
Instana supports two flexible telemetry pipelines:
Agent Mode. Telemetry data is routed through a local Instana Agent, which enriches the data before forwarding it to the Instana backend. LLM-specific metrics like token usage, latency, and request cost are collected via a dedicated OTel Data Collector for LLM (ODCL) and sent through the same agent for unified processing.
Agentless Mode: For lighter-weight deployments, traces and logs are sent directly to Instana's OTLP acceptor, bypassing the agent entirely. This mode is ideal for containerized, serverless, or edge environments where deploying an agent just isn’t feasible.
This tutorial walks you through the Agent Mode telemetry pipeline to set up observability for LLM applications using IBM Instana. Instead of relying on pre-packaged frameworks, we’ll go step-by-step through how to set up your local environment, instrument a sample LLM application, and monitor its behavior thereby providing full visibility into the runtime performance of your model interactions.
Specifically, in this tutorial, you’ll learn how to:
- Install and configure the Instana agent on your local machine.
- Set up the OpenTelemetry (OTel) Data Collector for LLM (ODCL) to funnel trace and metric data into Instana.
- Instrument your LLM application using Traceloop SDK, enabling detailed tracing of model invocations, latency, and token usage.
- Run the application and view traces, logs, and metrics in the Instana UI, enabling deep insights into execution flows, bottlenecks, and system health.
Whether you're experimenting with small-scale LLM prototypes or preparing your stack for production-grade deployments, this setup provides a strong foundation for transparent, actionable observability into your AI workflows—using open standards and robust IBM tooling.
We’ll begin by setting up everything in agent mode, where telemetry flows through the Instana Agent for enrichment and forwarding, and visualize the resulting metrics and traces in the IBM Instana UI.
Setting up the key components
Let’s walk through the setup process for each of the key components that are required to enable observability in our LLM application.
In our example, we’re using a MacBook Pro running macOS, equipped with an M3 processor and 24 GB of RAM.
Install and configure Java
We need Java 8 for the Instana Agent and Java 11 for the OTel Data Collector for LLM (ODCL). Use either of the following links to download the Java 8 & 11 based on your machine's config and install it.
Install and configure the Instana Agent
The Instana Agent enables seamless ingestion of OpenTelemetry data by automatically collecting and enriching it with infrastructure context. It simplifies observability by correlating telemetry from instrumented applications and forwarding it to the Instana backend for analysis.
Follow the steps in the documentation to set up the Instana Agent for your environment. In my case, that is MacOS.
Install and configure OTel Data Collector for LLM (ODCL)
ODCL is the tool or template to generate OpenTelemetry metrics for various LLMs and LLM applications. All implementation are based on predefined OpenTelemetry semantic conventions.
Follow the steps in the Instana docs to install and configure ODCL.
Now our ODCL is set to collect the traces and send the metrics to the Instana Agent. And in case of any difficulty with setup kindly visit here for more info.
Install and configure the Traceloop SDK
The Traceloop SDK is a lightweight observability toolkit designed to capture detailed execution traces, logs, and metadata from LLM applications. It provides deep visibility into prompt flows, model responses, and performance metrics, making it easier to monitor and debug AI-driven workflows. We will use version v0.38.7 of traceloop-sdk.
We will install this SDK when we instrument the LLM application.
Instrumenting the LLM application
Instrumentation involves adding code to your LLM application to capture detailed insights into its LLM API calls. This process enables the collection of both trace and metric data. Trace data is sent directly to the Instana Agent, while metric data is first sent to ODCL for aggregation before being forwarded to the agent.
Verify that Python 3.10+ is installed in your machine. If not installed, download and install it from the Python site or install it using terminal.
(Optional) It is recommended to create a virtual environment for your applications. This helps keep your dependencies organized and prevents conflicts with other applications. To create a virtual environment, run these commands
python3 -m venv venv # to create a virtual environment named as venv. source venv/bin/activate # to activate the virtual environment.Install the required libraries using this command:
pip install traceloop-sdk==0.38.7 ibm-watsonx-ai==1.0.5 ibm-watson-machine-learning==1.0.357 langchain-ibm==0.1.7 langchain==0.2.2 langchain-community==0.2.3 langchain-core==0.2.4 langchain-text-splitters==0.2.1 openai==1.99.3In your LLM app, initialize the Traceloop tracer:
from traceloop.sdk import Traceloop Traceloop.init()If your application involves complex workflows or chains, you can annotate them to gain clearer visibility into their execution. By doing so, you’ll be able to view the full trace of your workflow in Traceloop or any compatible observability dashboard. To simplify this process, you can use decorators such as
@workflowfor synchronous functions or@aworkflowfor asynchronous ones around functions that render prompts and invoke LLMs. For example:from traceloop.sdk.decorators import workflow @workflow(name="suggest_answers") def suggest_answers(question: str):
To quickly verify the instrumentation, you can use any of the following code to generate a sample application named sample_app.py.
Instrumenting the sample watsonx application
Use this code to generate a sample watsonx application.
import os, types, time, random
from ibm_watsonx_ai.metanames import GenTextParamsMetaNames
from ibm_watsonx_ai.foundation_models import ModelInference
from pprint import pprint
from traceloop.sdk import Traceloop
from traceloop.sdk.decorators import workflow
from langchain_ibm import WatsonxLLM
from dotenv import load_dotenv
load_dotenv()

Traceloop.init(app_name="watsonx_llm_langchain_question",disable_batch=True)

def watsonx_llm_init() -> ModelInference:
    """
    Initialize the WatsonxLLM model with predefined parameters.

    Returns:
        ModelInference: An instance of the WatsonxLLM model configured with specified parameters.
    """
    watsonx_llm_parameters = {
        GenTextParamsMetaNames.DECODING_METHOD: "sample",
        GenTextParamsMetaNames.MAX_NEW_TOKENS: 100,
        GenTextParamsMetaNames.MIN_NEW_TOKENS: 1,
        GenTextParamsMetaNames.TEMPERATURE: 0.5,
        GenTextParamsMetaNames.top_K: 50,
        GenTextParamsMetaNames.top_P: 1,
    }
    # Randomly select a model from available IBM Watsonx models
    models = ['meta-llama/llama-3-3-70b-instruct', 'ibm/granite-13b-instruct-v2']
    model = random.choice(models)

    # Initialize WatsonxLLM with API credentials and model parameters
    watsonx_llm = WatsonxLLM(
        model_id=model,
        url=os.getenv("WATSONX_URL"),
        apikey=os.getenv("API_KEY"),
        project_id=os.getenv("PROJECT_ID"),
        params=watsonx_llm_parameters,
    )
    return watsonx_llm

@workflow(name="watsonx_llm_langchain_question")
def watsonx_llm_generate(question):
    """
    Generate a response from the watsonxLLM model based on the given question.

    Args:
        question (str): The input query for the model.
    Returns:
        str: The model-generated response.
    """
    watsonx_llm = watsonx_llm_init()
    return watsonx_llm.invoke(question)

# Generate responses for a set of predefined questions
for i in range(10):
    question_multiple_responses = [ "What is AIOps?", "What is Gitops?"]
    question = random.choice(question_multiple_responses)
    response = watsonx_llm_generate(question)
    # Handle generator response type if applicable
    if isinstance(response, types.GeneratorType):
         for chunk in response:
             print(chunk, end='')
    pprint(response)
    time.sleep(2)
Instrumenting an OpenAI application
Use this code to generate a sample OpenAI application.
import os, time, random
from openai import OpenAI
from traceloop.sdk import Traceloop
from traceloop.sdk.decorators import workflow

client = OpenAI(api_key=os.getenv("OPENAI_API_KEY"))

Traceloop.init(app_name="openai_sample_service", disable_batch=True)

@workflow(name="streaming_ask")
def ask_workflow():
    models = [ "gpt-3.5-turbo", "gpt-4-turbo-preview" ]
    mod = random.choice(models)
    questions = [ "What is AIOps?", "What is Gitops?" ]
    question = random.choice(questions)
    stream = client.chat.completions.create(
        model=mod,
        messages=[{"role": "user", "content": question}],
        stream=True,
    )
    for part in stream:
        print(part.choices[0].delta.content or "", end="")
for i in range(10):
    ask_workflow()
    time.sleep(3);
Running the application and sending metrics and traces
With everything set up, we’re now ready to launch the full observability stack. We’ll start by running the Instana Agent and the ODCL, followed by our sample LLM application. Once everything is running, we’ll head over to the IBM Instana UI to explore the collected traces and metrics, giving us real-time insights into the application's behavior and performance.
Export the credentials for the sample watsonx application
You need an IBM Cloud account to create a watsonx.ai project and get an API key. (Read more about managing API keys in the IBM Cloud docs.)
To enable access to the LLMs in the sample watsonx application, export your watsonx credentials.
export WATSONX_URL="<watsonx-url>"
export PROJECT_ID="<watsonx-project-id>"
export API_KEY="<watsonx-api-key>"
Export the credentials for the sample OpenAI application
To create an API key to access the OpenAI API or use the existing one, log in to OpenAI and go to OpenAI.
To enable access to the LLMs in the sample OpenAI application, export your OpenAI credentials.
export OPENAI_API_KEY=<openai-api-key>
Run the app in Agent Mode
In this case, we first run Instana agent using command this command:
./bin/karaf
Then, run ODCL using this command:
./bin/otel-dc-llm
Before running our sample app, sample_app.py, export the following credentials in the terminal from where you are going to run it.
export TRACELOOP_BASE_URL=localhost:4317
export TRACELOOP_LOGGING_ENABLED=true
export TRACELOOP_LOGGING_ENDPOINT=$TRACELOOP_BASE_URL
export TRACELOOP_METRICS_ENABLED=true
export TRACELOOP_METRICS_ENDPOINT=localhost:8000
export OTEL_EXPORTER_OTLP_METRICS_INSECURE=true
export OTEL_METRIC_EXPORT_INTERVAL=10000
export OTEL_EXPORTER_OTLP_INSECURE=true
You can also keep theese credentials in an .env file within same directory as the sample app and then run the application using the command:
python3 sample_app.py
Run the app in Agentless Mode
In this mode, you send the metrics directly to the Instana backend instead of using a local Instana Agent. To do this, we need few modifications in the config.yaml file of ODCL and the credentials that we are using while running the sample application.
In
config.yamlfile of ODCL, change the value ofotel.agentless.modetotrue, and the value ofotel.backend.urltohttp://<instan-otlp-endpoint>:4317. For more information, see the Endpoints of the Instana backend otlp-acceptor) docs page.Once done with the above changes, run ODCL using this command:
./bin/otel-dc-llmExport the necessary credentials for your chosen LLM provider in your application to enable access to the models specified in it.
Run the sample_app.py using these credentials:
export TRACELOOP_BASE_URL=<instana-otlp-endpoint>:4317
 export TRACELOOP_HEADERS="x-instana-key=<agent-key>,x-instana-host=<instana-host>"
 export TRACELOOP_LOGGING_ENABLED=true
 export TRACELOOP_LOGGING_ENDPOINT=$TRACELOOP_BASE_URL
 export TRACELOOP_METRICS_ENABLED=true
 export TRACELOOP_METRICS_ENDPOINT=localhost:8000
 export OTEL_EXPORTER_OTLP_METRICS_INSECURE=true
 export OTEL_METRIC_EXPORT_INTERVAL=10000
 export OTEL_EXPORTER_OTLP_INSECURE=false
View the collected traces and metrics
Once ODCL and the Instana Agent are running, and once your LLM application is instrumented and running, you can view the collected metrics directly in the Instana UI. To access the LLM observability dashboard:
- Open the Instana UI, and navigate to Infrastructure.
- Click Analyze Infrastructure.
- From the list of entity types, select OTEL LLMonitor.
- Choose the relevant OTEL LLMonitor instance to open its dashboard. (In our case it should be something like
LLM:DC1@<your_mac_username>).
Here, you’ll find key LLM observability metrics, including: Total Tokens, Total Cost, Total Requests, Average Latency, and many more. These metrics provide valuable insights into your LLM application's performance and usage. See below images for reference.
For more information about viewing traces, see the Analyze Calls and Traces docs page.
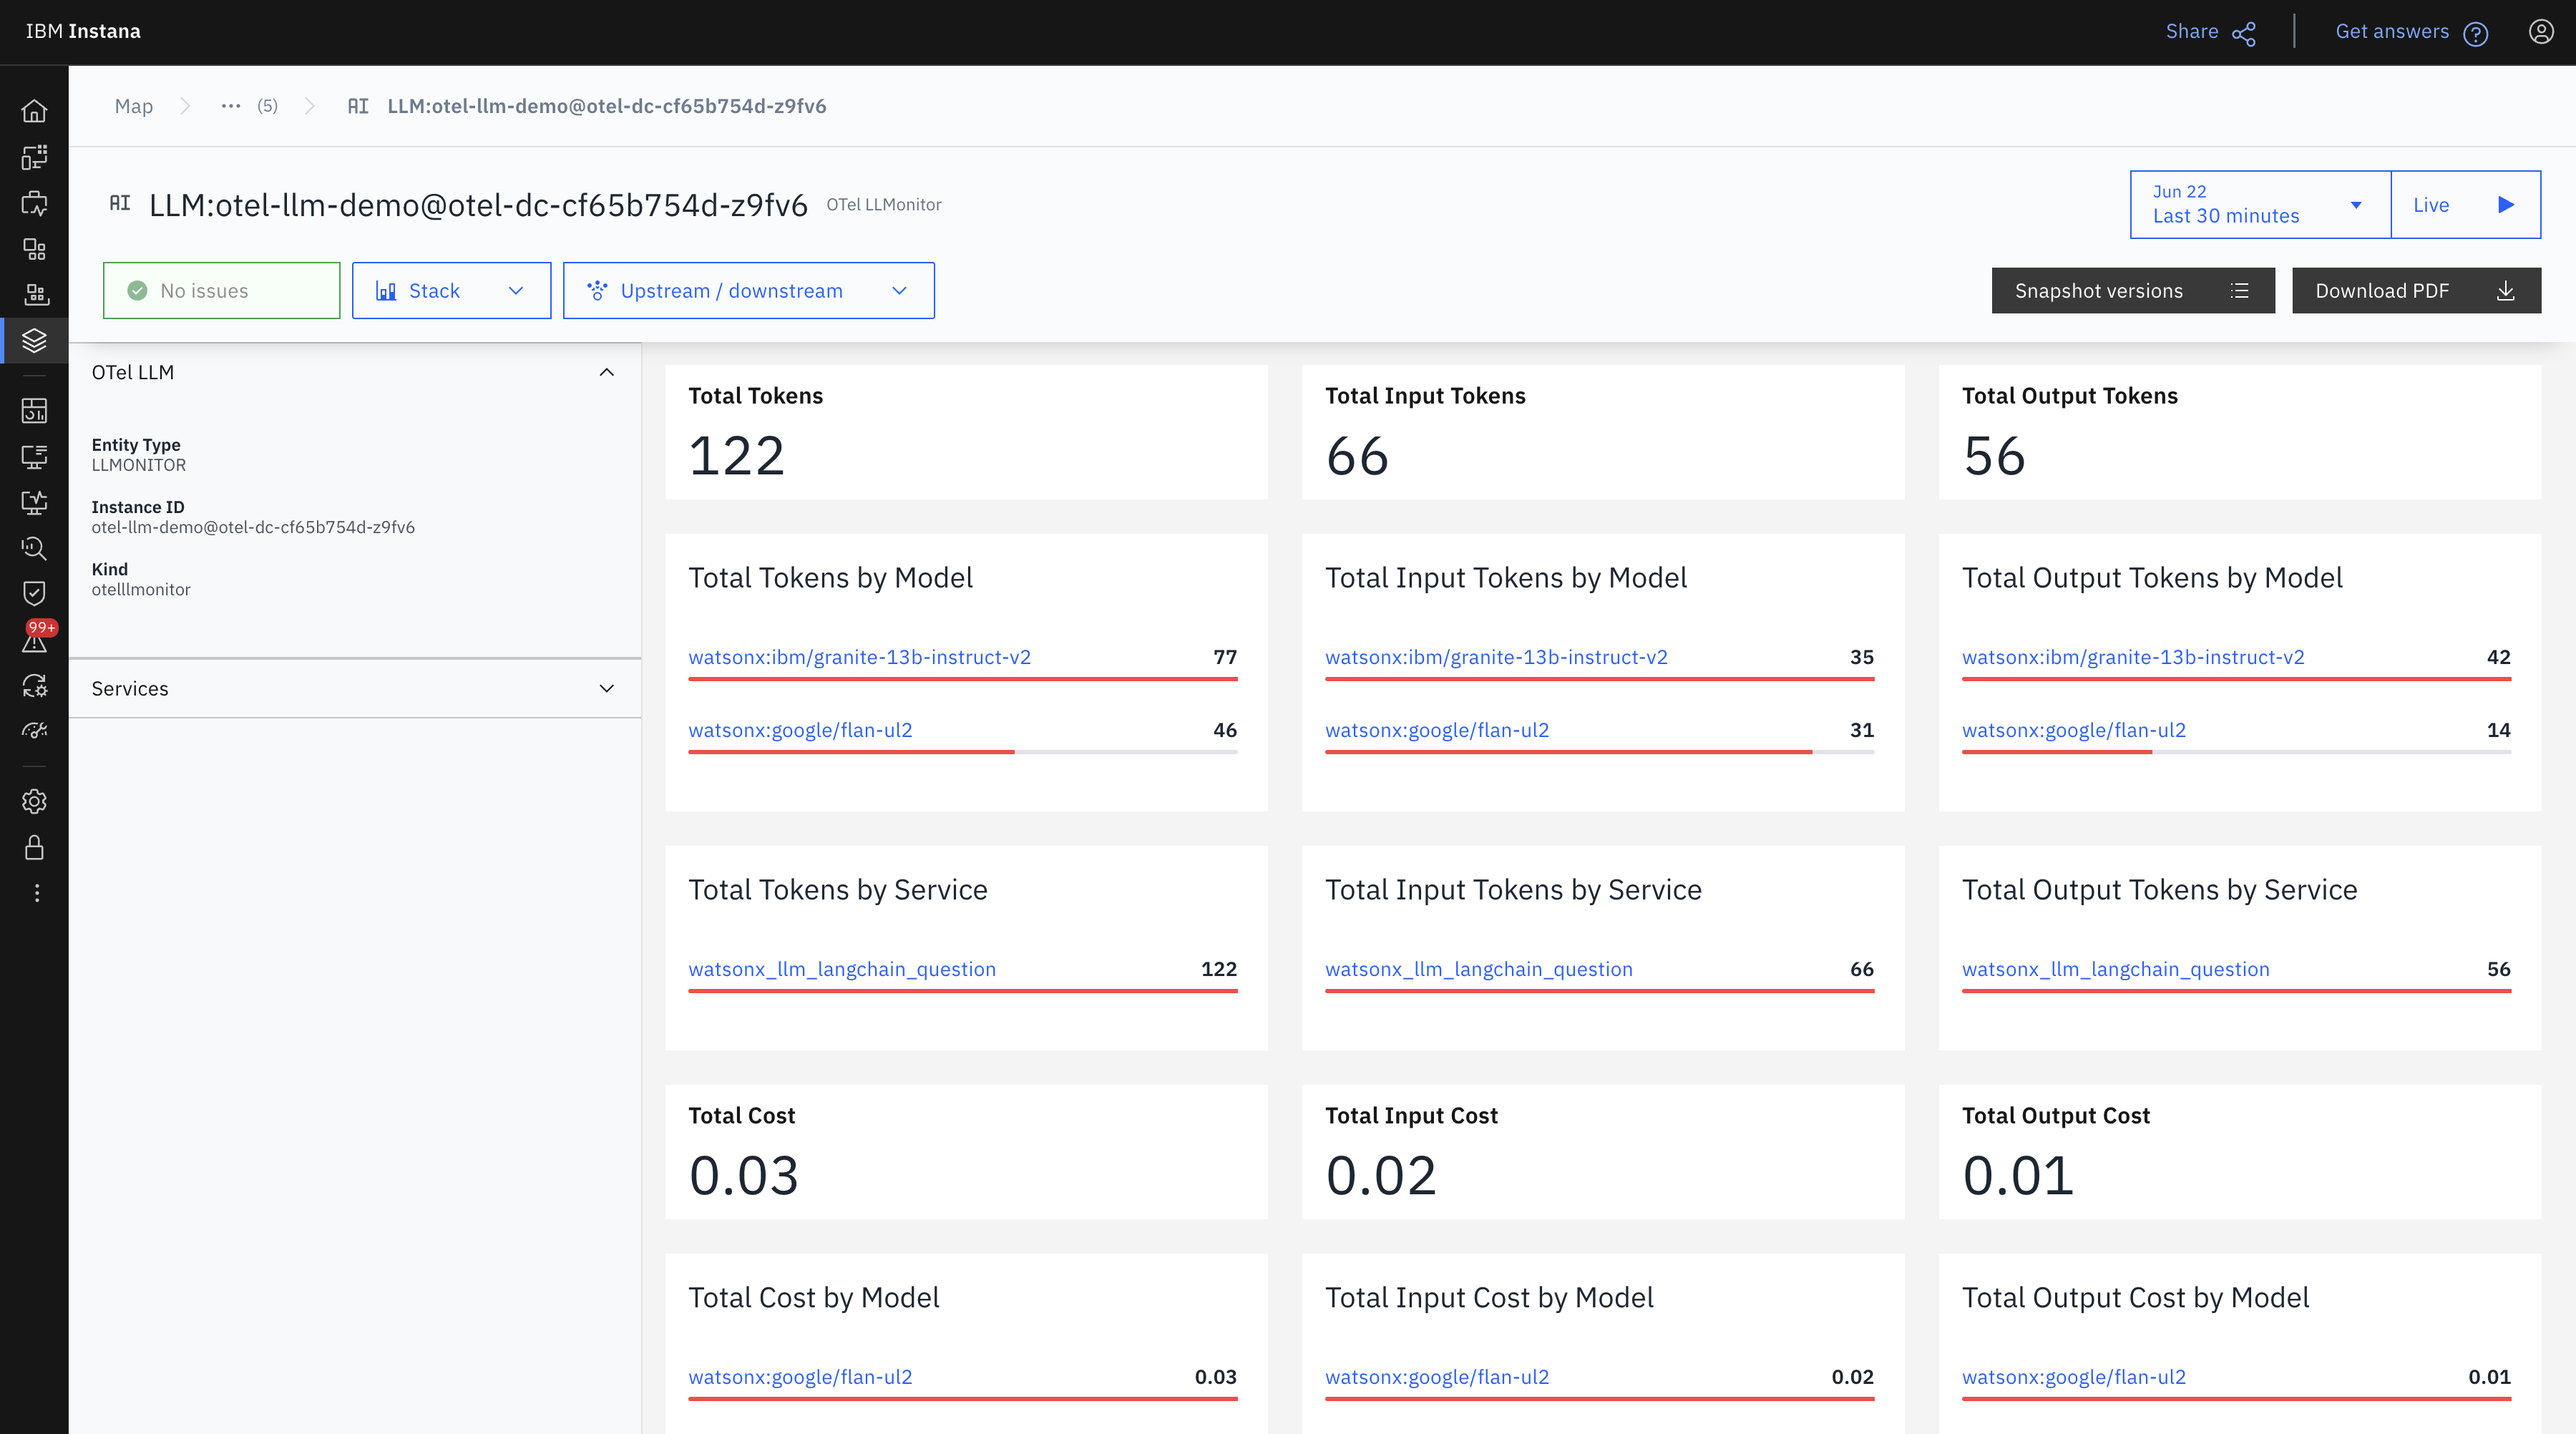
The following view is a snapshot-driven walkthrough of our demo monitoring dashboard.
This view summarizes the total tokens processed:
- 122 tokens overall (66 input, 56 output)
- The top-used models were
granite-13b-instruct-v2andflan-ul2. - Most of the cost ($0.03) was attributed to
flan-ul2, despitegranitehaving higher output.
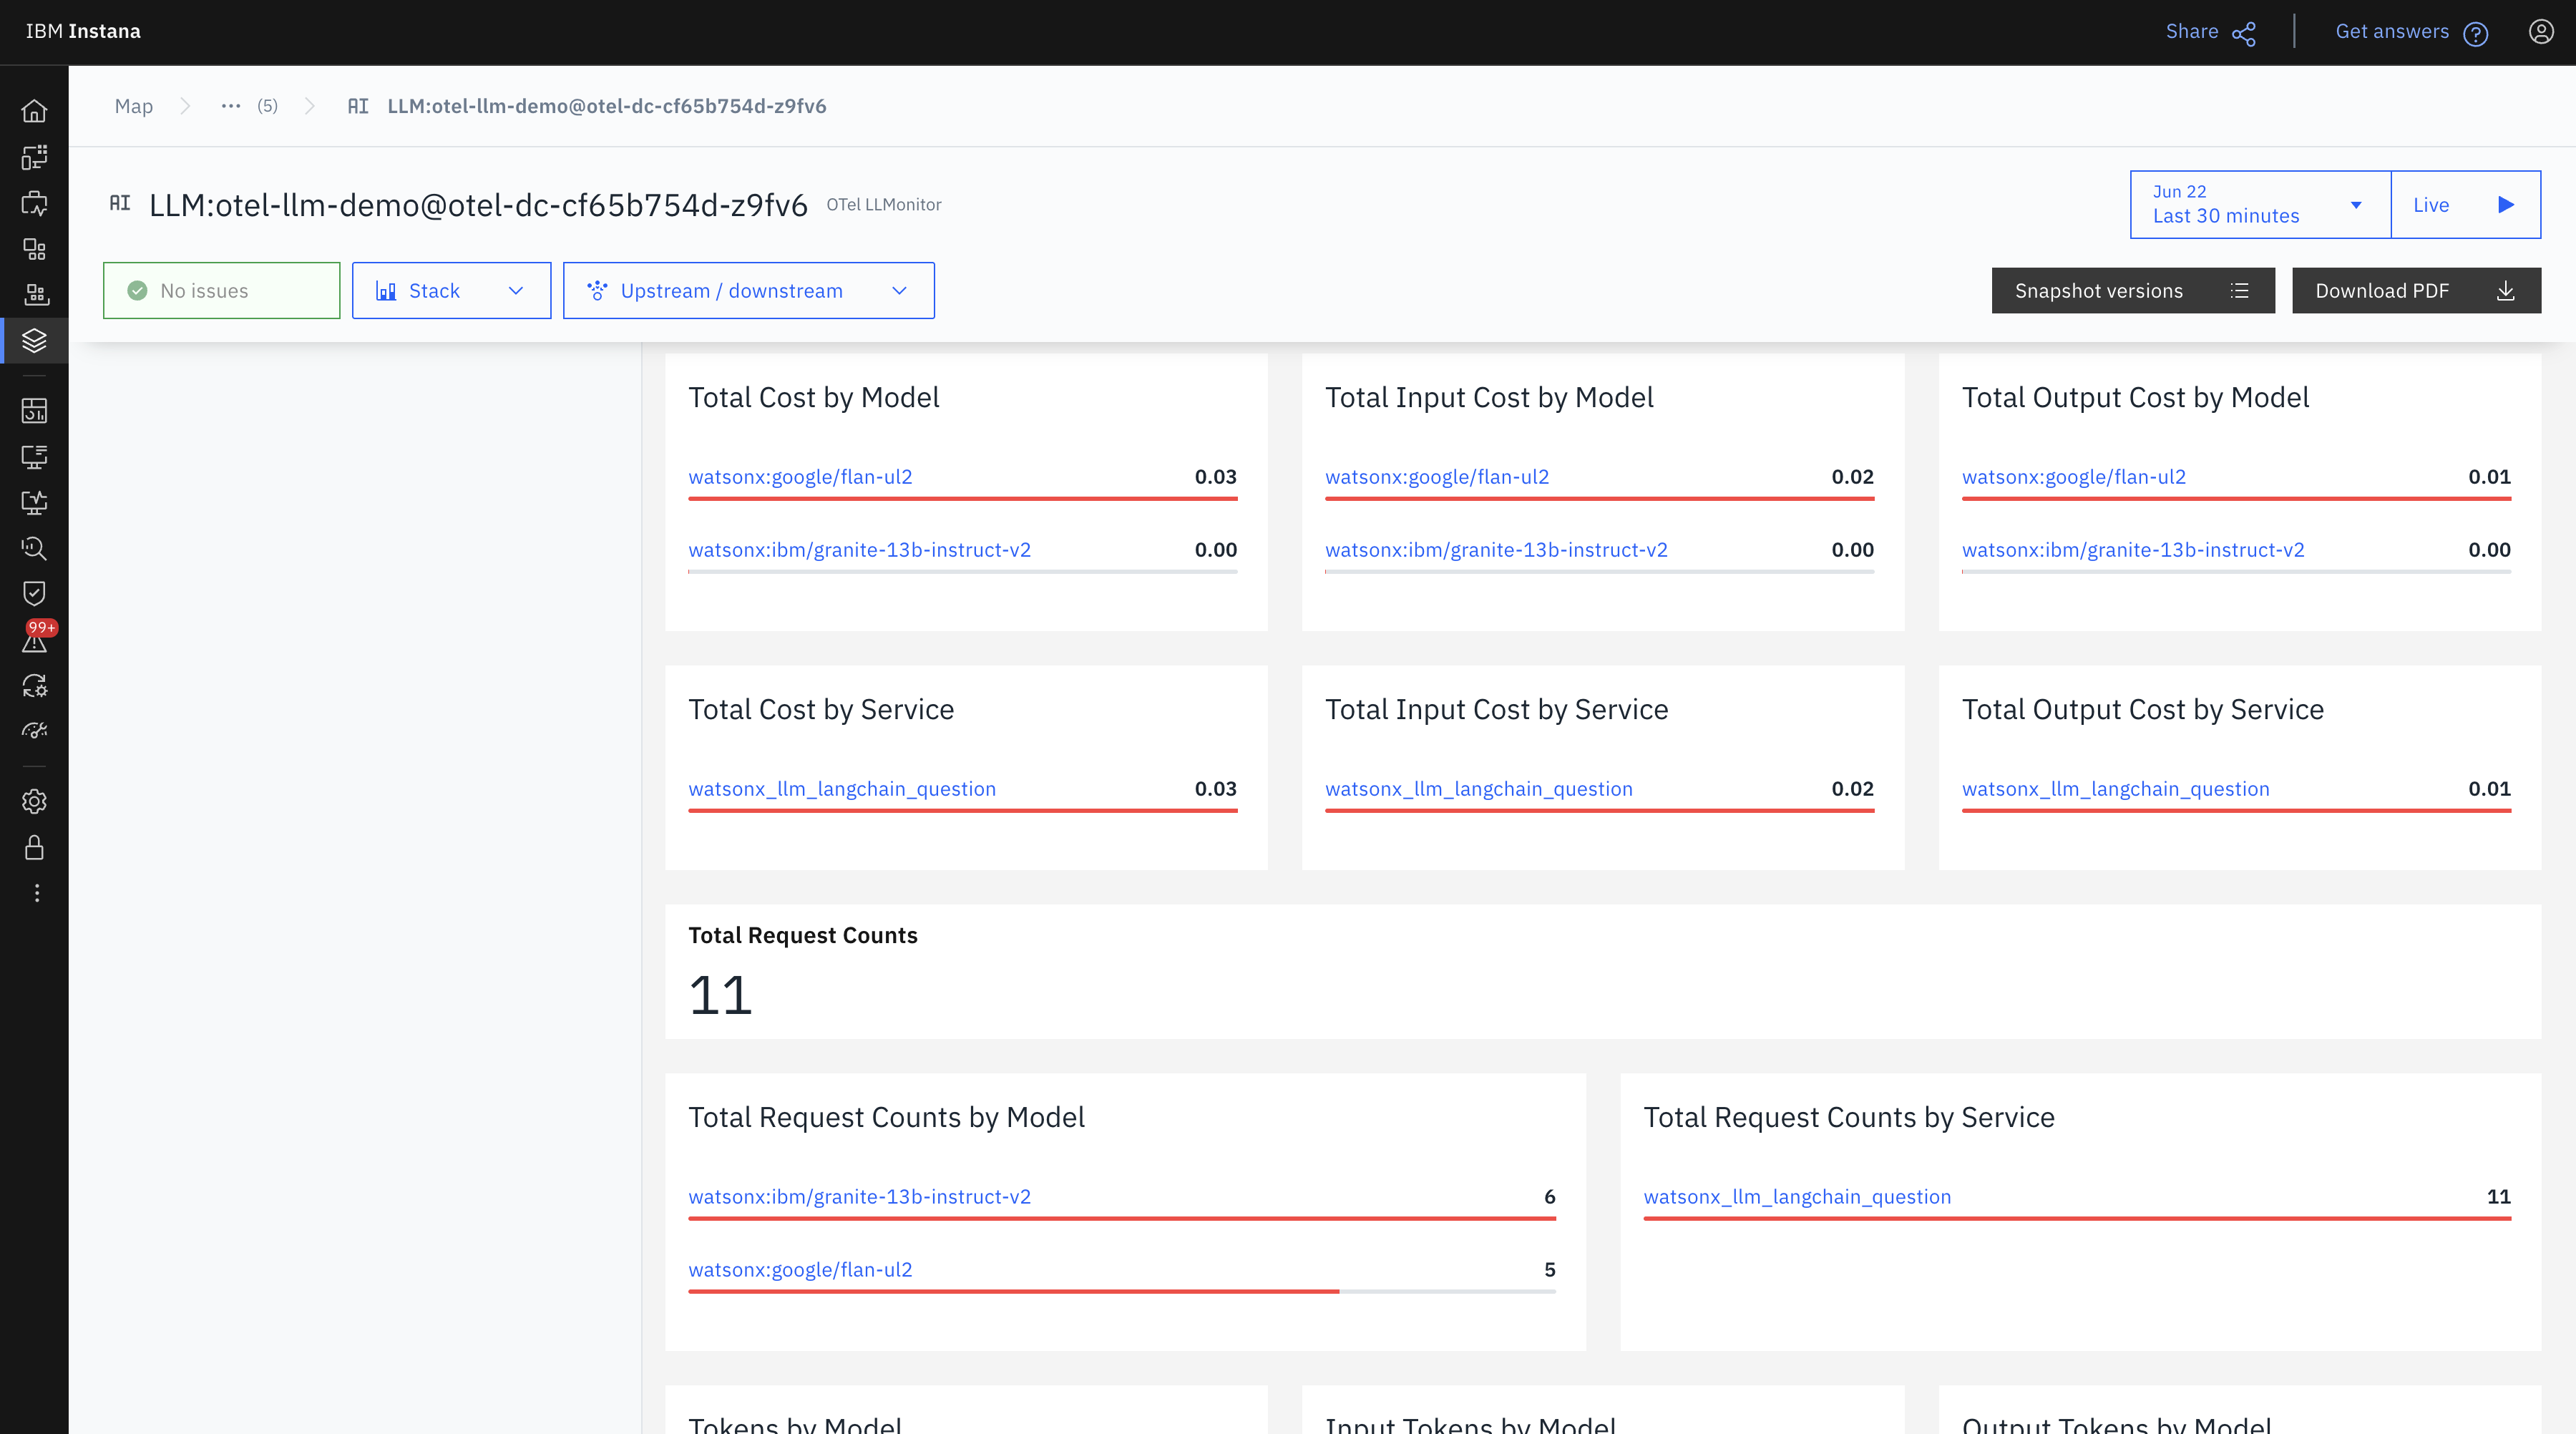
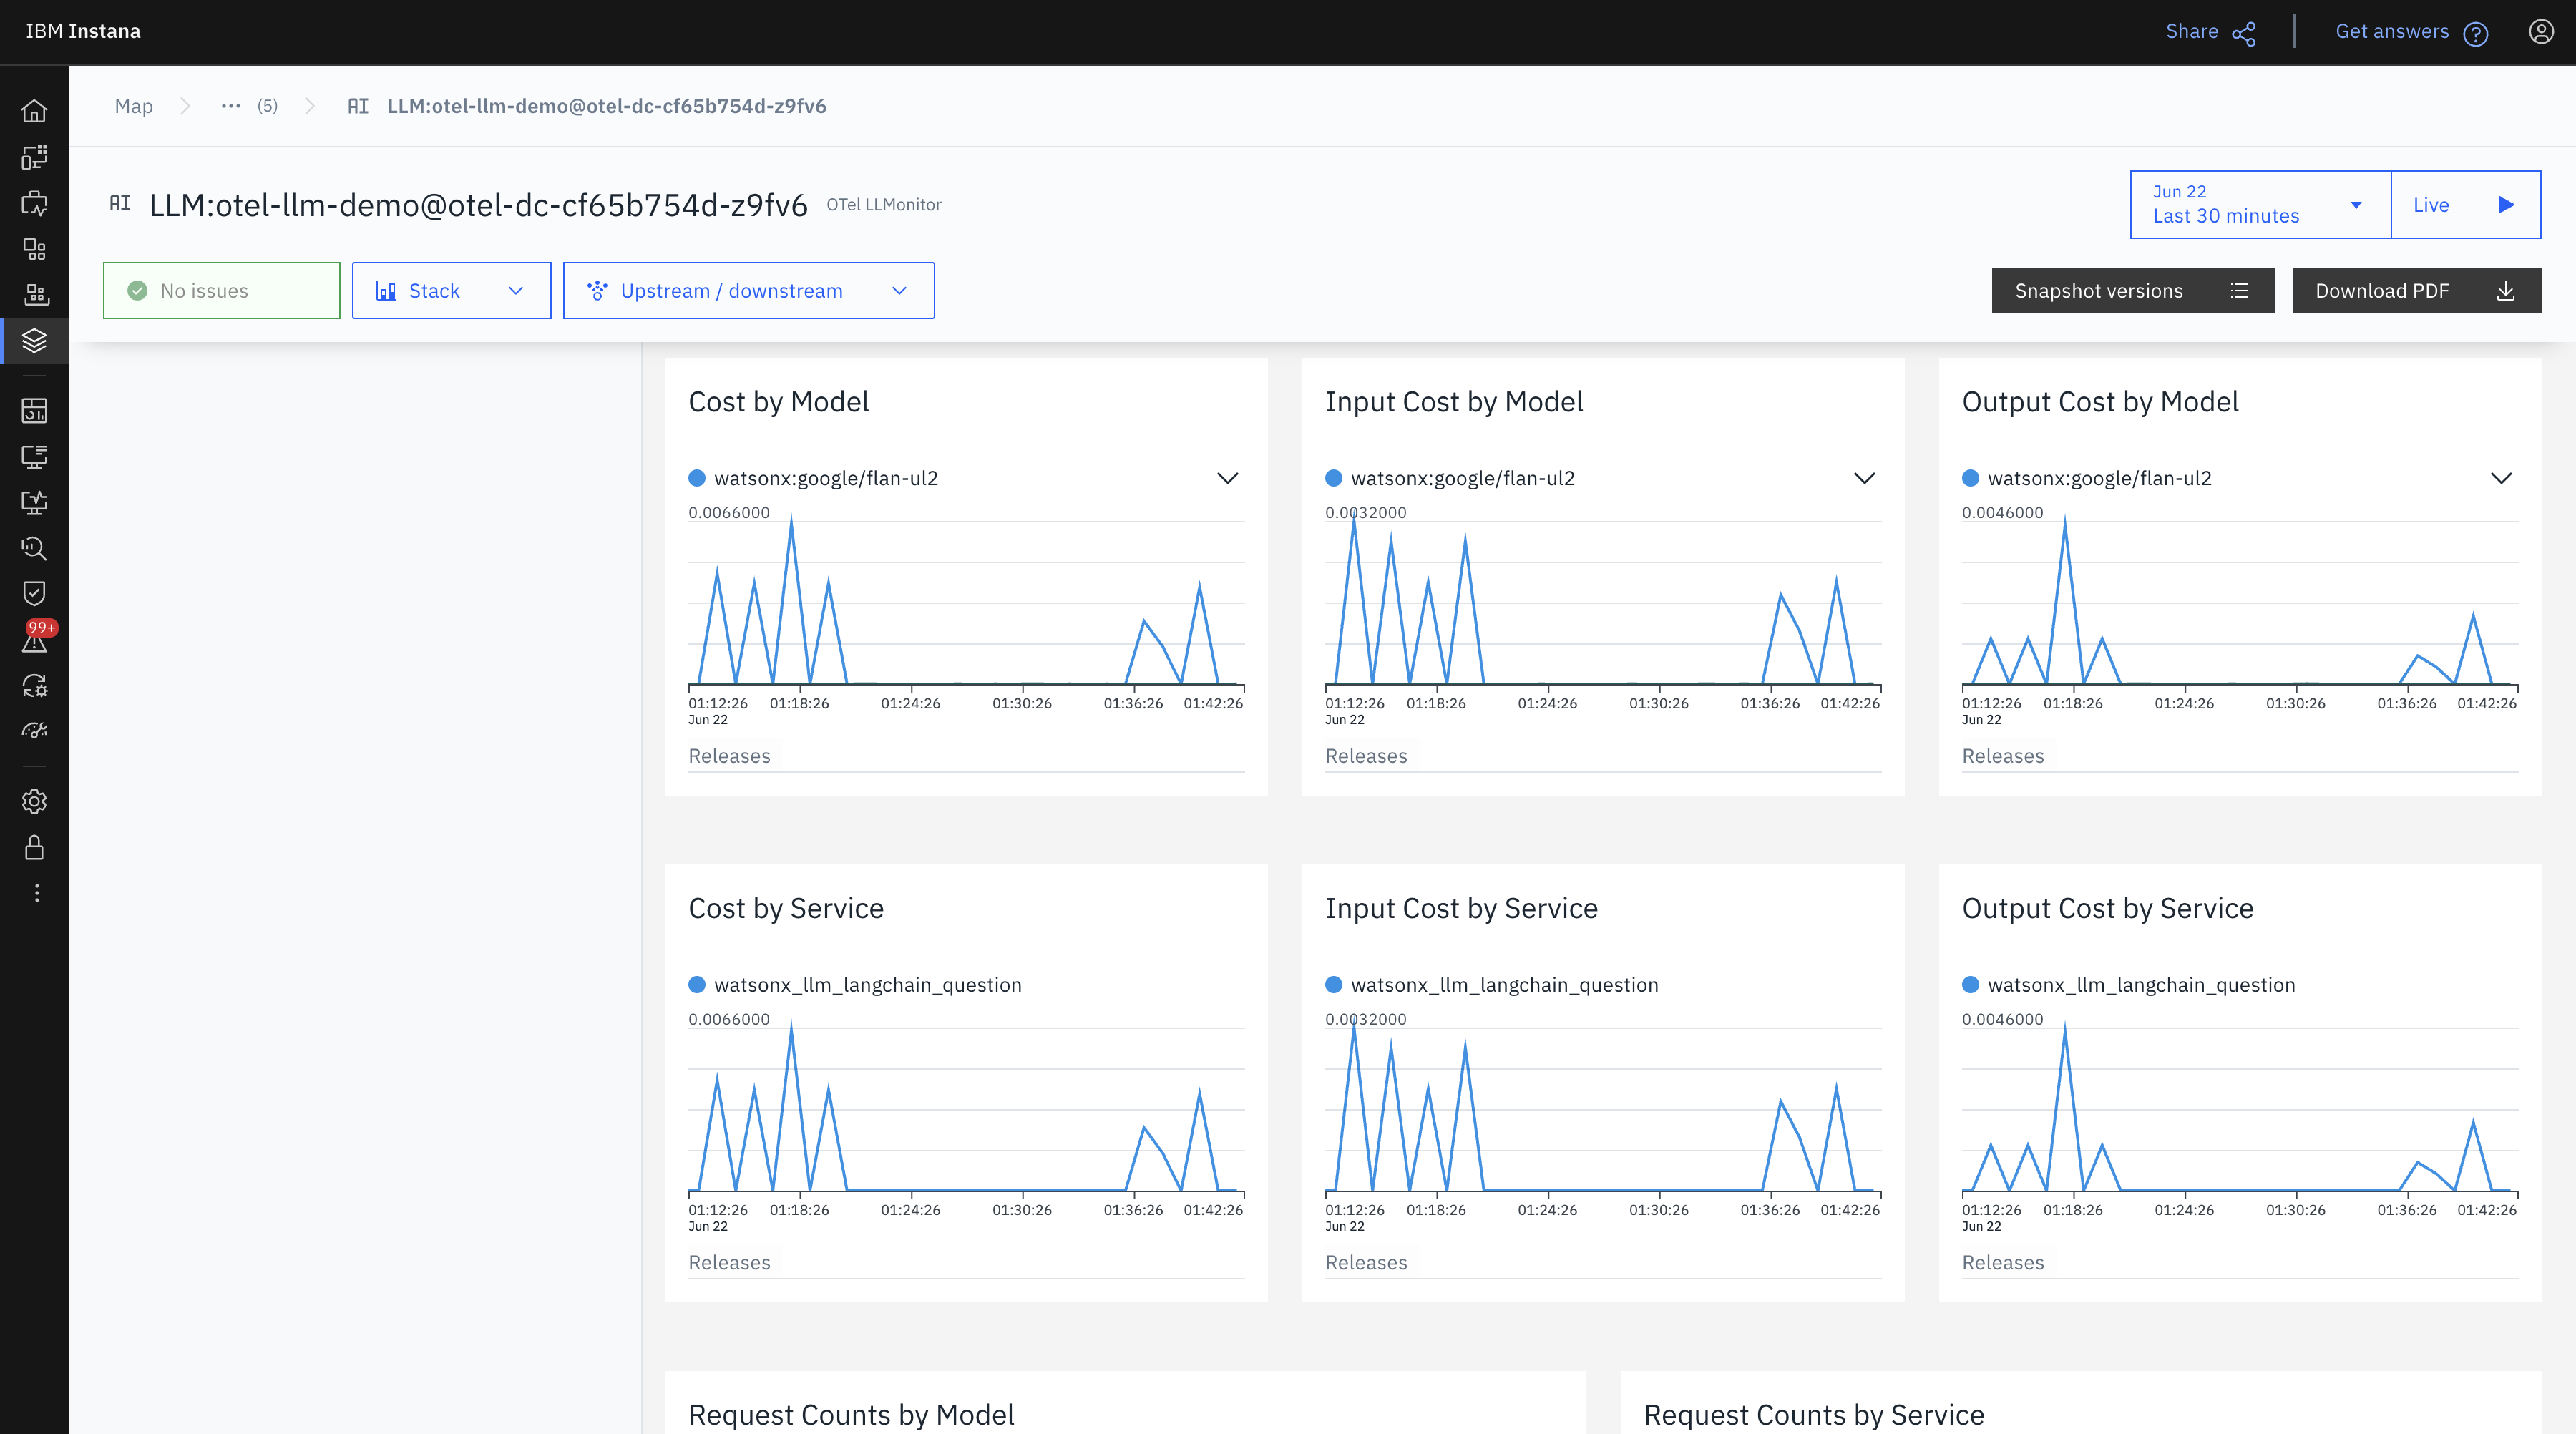
The following view shows a clear cost distribution by model and service.
- All 11 requests came through the service
watsonx_llm_langchain_question. - Granite had 6 requests, Flan had 5—yet Flan generated all the cost.
- This hints at possible differences in pricing or token usage efficiency.
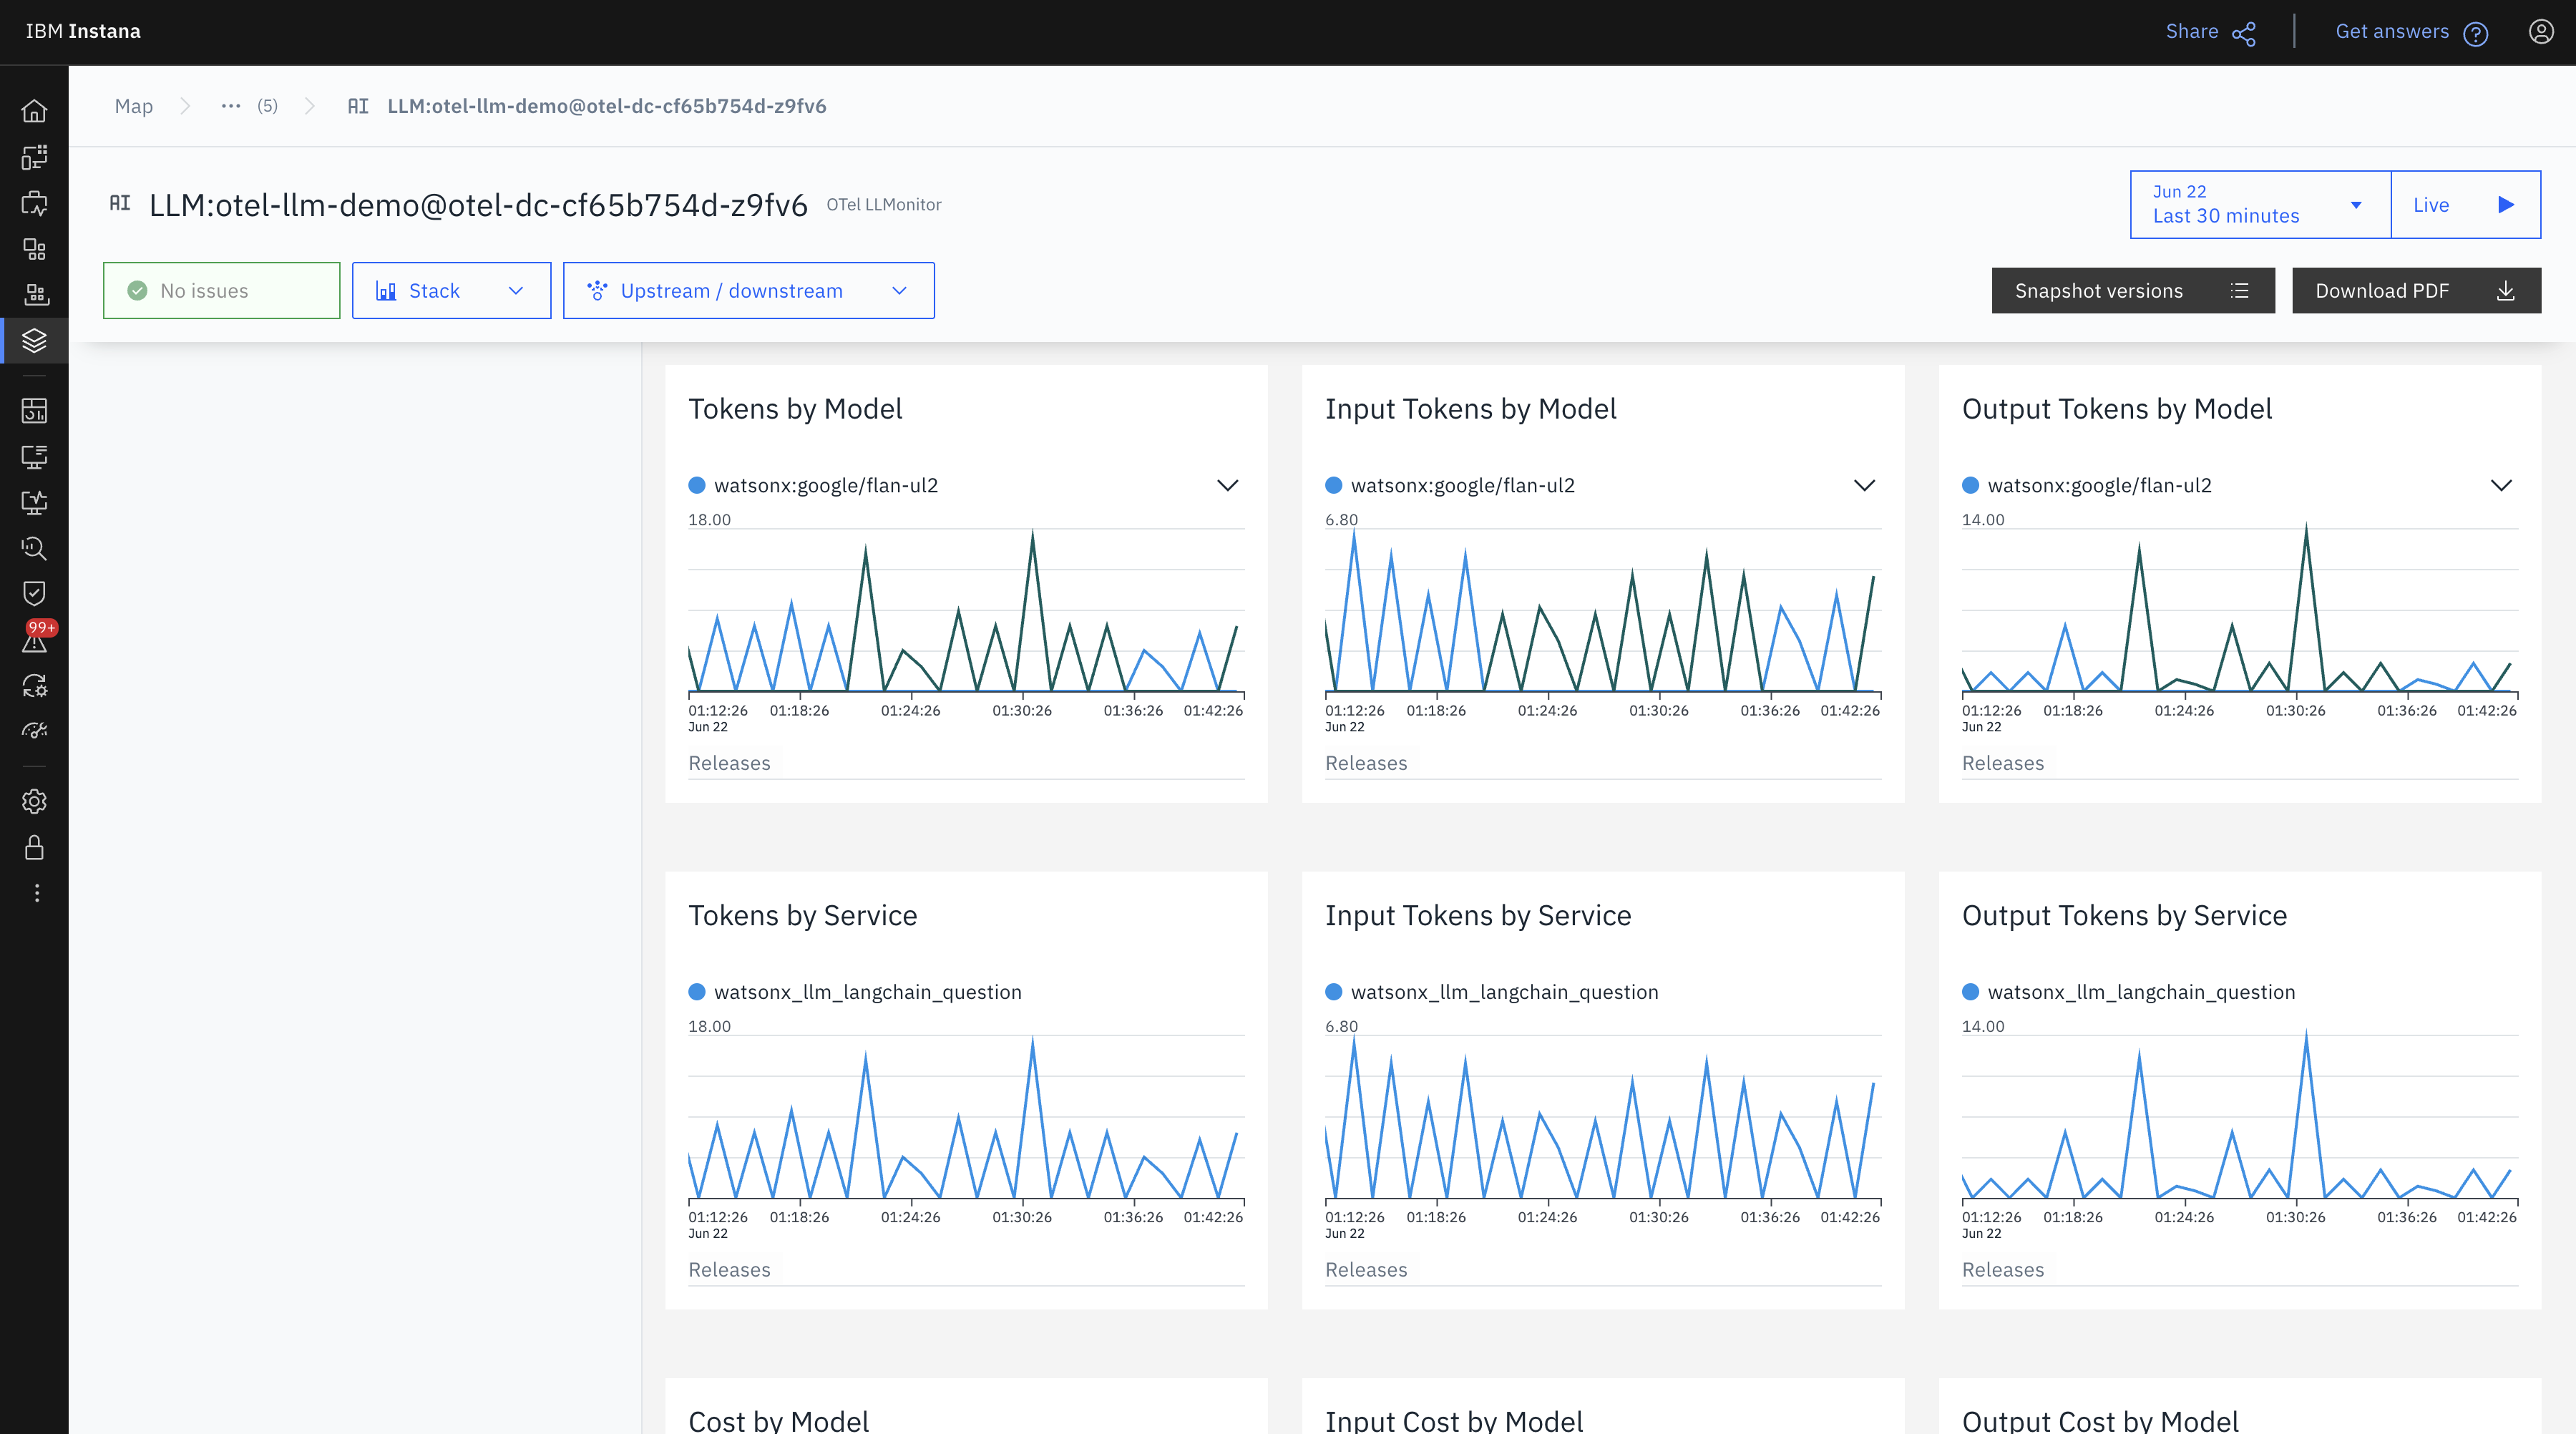
This time-series graph shows token usage per model and service across a 30-minute window.
- Token spikes correlate with request activity.
- Flan’s usage appears more frequent but with smaller token batches per call.
In the following view, you can see fluctuations in cost across time intervals.
- Input and output costs mirror the token patterns seen earlier.
- Granular tracking like this helps understand high-cost periods and optimize prompts accordingly.
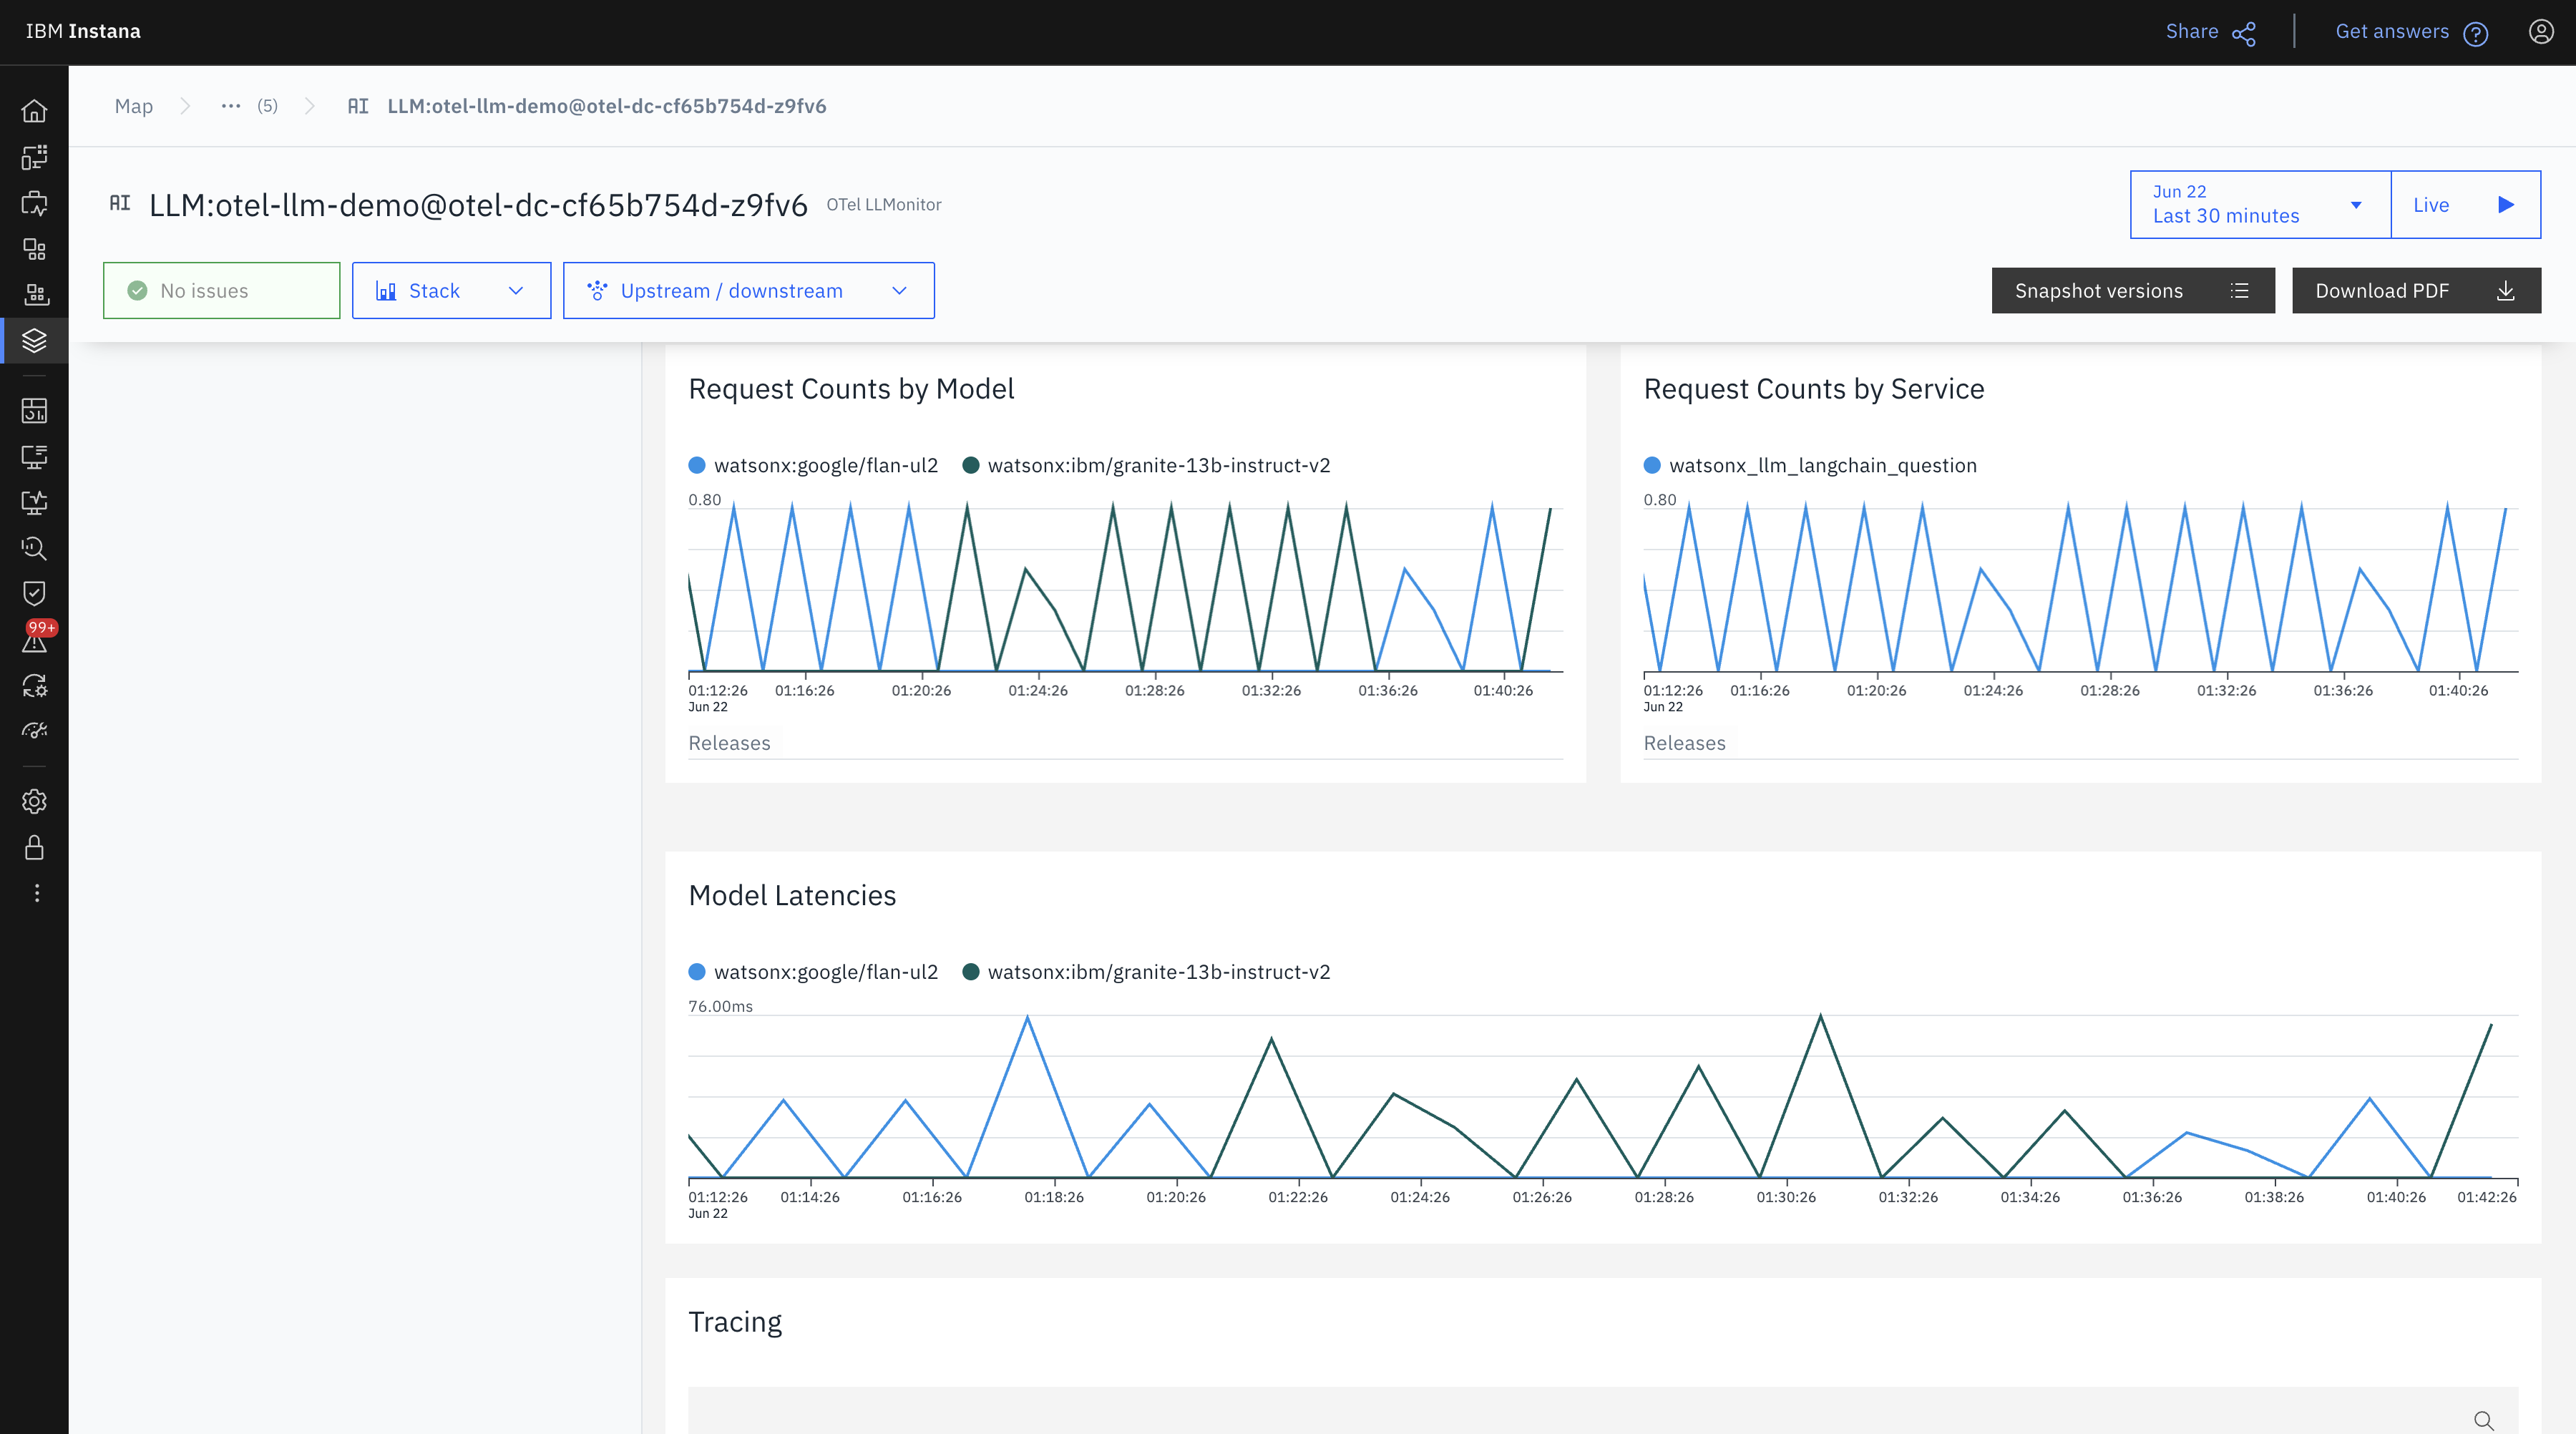
Lastly, in this view, you see the request frequency and model latencies.
- Flan and Granite both maintained steady throughput.
- Latency varied slightly, with Flan showing slightly higher spikes at times, possibly due to concurrent loads.
Conclusion
By implementing the local-hosted (Agent Mode) observability setup described in this tutorial, you gain full control over telemetry processing within your environment while benefiting from Instana's powerful enrichment and visualization capabilities. This approach ensures that sensitive LLM data remains within your local network before being securely forwarded to the Instana backend, reducing latency and improving data governance. It also enables real-time, high-fidelity insights, covering token usage, cost, latency, and workflow traces, without relying on external infrastructure.
Whether you're iterating on prototypes or stress-testing production workloads, this method delivers a reliable, transparent, and cost-aware foundation for monitoring and optimizing your LLM applications.