About cookies on this site Our websites require some cookies to function properly (required). In addition, other cookies may be used with your consent to analyze site usage, improve the user experience and for advertising. For more information, please review your options. By visiting our website, you agree to our processing of information as described in IBM’sprivacy statement. To provide a smooth navigation, your cookie preferences will be shared across the IBM web domains listed here.
Tutorial
Debugging messaging applications using the IBM MQ Console
Develop your MQ Console problem determination skills by completing these challenges
In this tutorial you will learn how you can use the IBM MQ Console to debug your messaging applications.
Prerequisites
To complete this tutorial, you will need the following:
- An IBM MQ queue manager. While this tutorial assumes you are working with an IBM MQ Queue Manager on IBM Cloud, any IBM MQ Advanced for Developers queue manager using the default developer configuration will be suitable. Follow any of the guides in the “Create and configure a queue manager” tutorial from the IBM MQ developer essentials learning path to set up your queue manager and application credentials.
- Node.js, version 18 or higher. Install Node by using nvm.
IBM MQI Client
- An IDE, such as VSCode
This tutorial is arranged in a series of challenges which will develop your IBM MQ Console usage skills:
- Viewing connected applications
- Resolving common connectivity issues
- Modifying queue properties
- Inspecting subscriber connections
- Inspecting durable subscriptions
- Identifying subscription housekeeping errors
- Debugging topic string errors
Challenge 1. Using the console to see which applications are connected
In this challenge, you will use the console to determine how many applications are connected to a queue manager.
You will need a running queue manager with an IBM MQ Advanced for Developers configuration and access to the IBM MQ Console. Follow the “Setting up and using the IBM MQ Console” guide in the IBM MQ developer essentials learning path to get access to the console.
Let’s start by getting a messaging application
Open a terminal or command window and create a working directory by running the commands.
mkdir pd cd pdClone the IBM Messaging Developer Patterns repository.
git clone https://github.com/ibm-messaging/mq-dev-patternsNavigate to the Node.js samples.
cd mq-dev-patterns/Node.jsInstall the application dependencies.
npm install
Point the application at your queue manager
For this part, you will need the configuration details for your queue manager. If you don’t have them, then follow the “Create and configure a queue manager” tutorial from the IBM MQ developer essentials to obtain them.
Edit the
env.jsonfile, found inmq-dev-patterns, to point at your queue manager.Extend the application connection time in the sample. This will allow you to use the console to see which applications are connected.
Edit the
mq-dev-patterns/Node.js/boilerplate.jsfile and make the following change in the functiongetMessagesFromQueueto increase the waiting time to 2 minutes, thereby adding a delay between get attempts.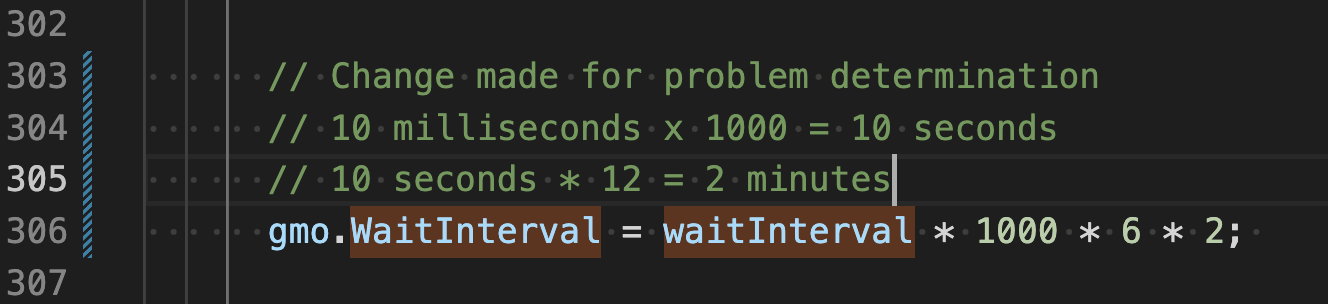
Run the sample get messaging application, by running the following command.
DEBUG=sample*:*,boiler:* ApplName="sample get" node sampleget.js
If 2 minutes isn’t long enough for the next few steps, increase the delay.
Use the console to see which applications are connected
- In a web browser login into the MQ console.
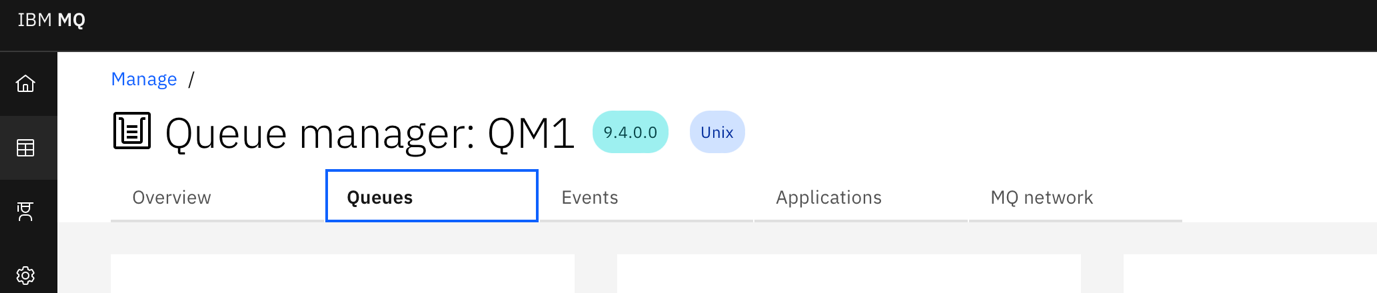
- Select Manage.
Select Applications.
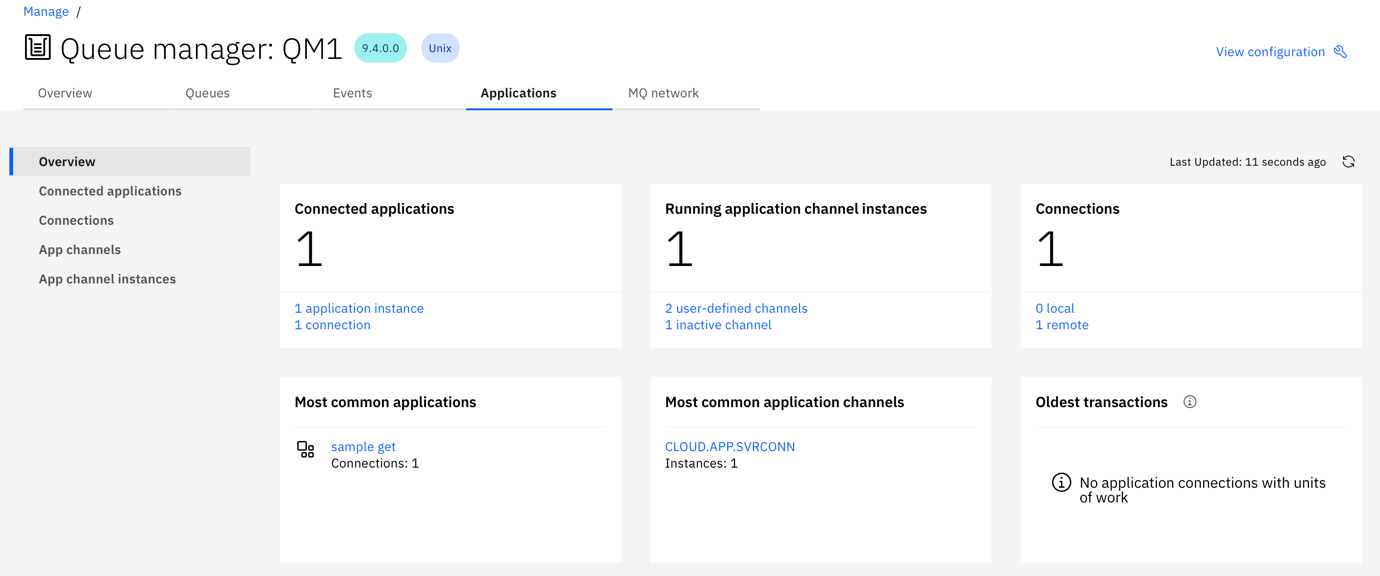
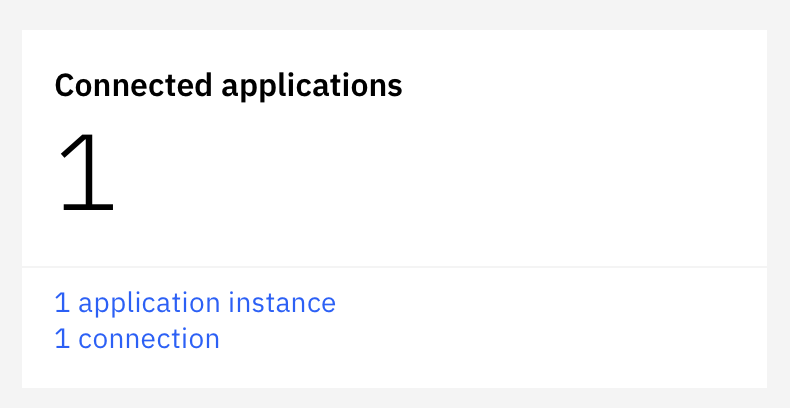
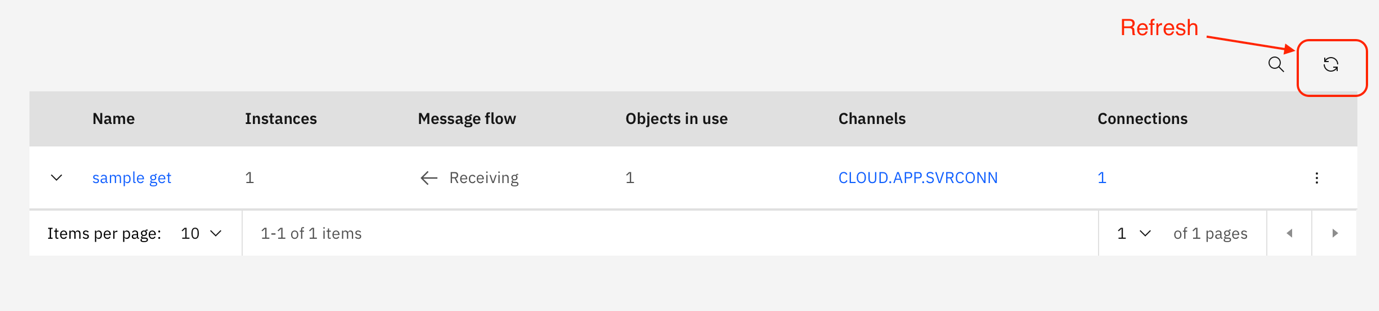
Note that there is one connected application with 1 connection.
Click the application instance.
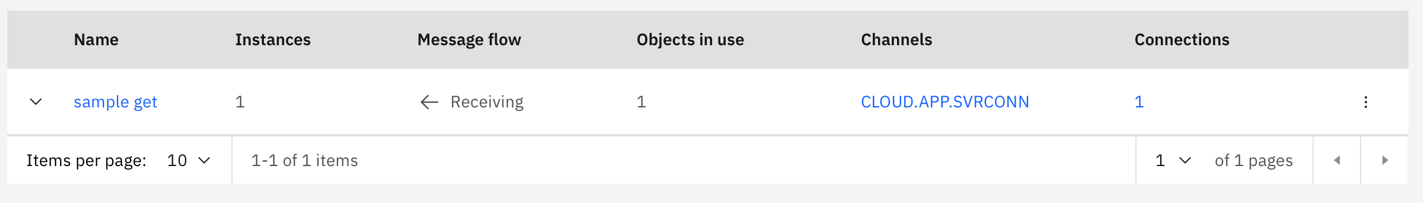
You can see which application is connected, how many instances of that application are connected, and how they are connected.
If you don’t see anything, check your app is it still running? If not, then go back and increase the delay. If it is running, then go back verify the configuration in the env.json file.
You now know how to use the console to see which applications are connected.
Let’s look at how multiple instances show up in the console
In a new terminal or command window, run another instance of the same application, so that there are two instances shown in the console.
Refresh the page on the MQ Console.
Note that the console is showing that there are now 2 instances of your application connected to the queue manager, and not 2 different applications.
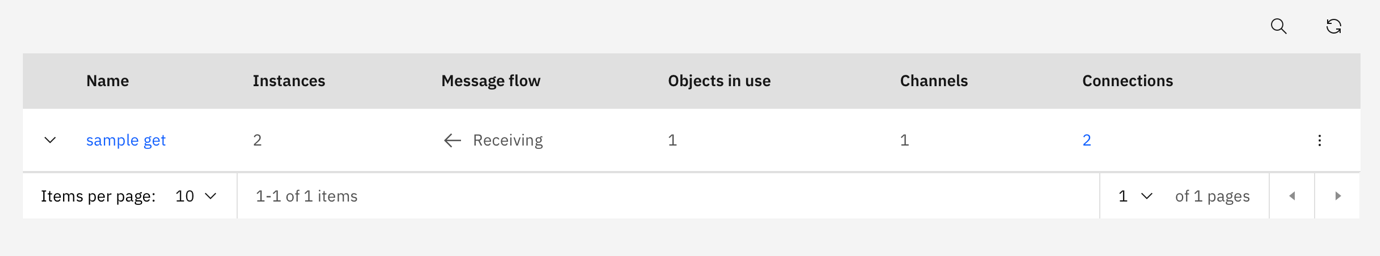
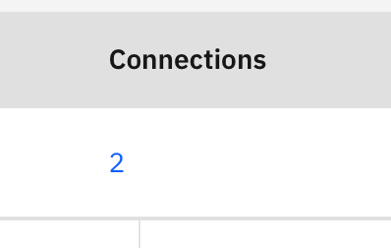
Click the number of connections.
You can now see the instances of your application, the queue that they are connected to, and the credentials they are using to connect.

If either of the two instances have stopped, restart them.
In a third terminal or command window, start another instance of the application, but this time provide a different application name.
DEBUG=sample*:*,boiler:* ApplName="another getting app" node sampleget.jsOn the MQ Console, click Connected applications.
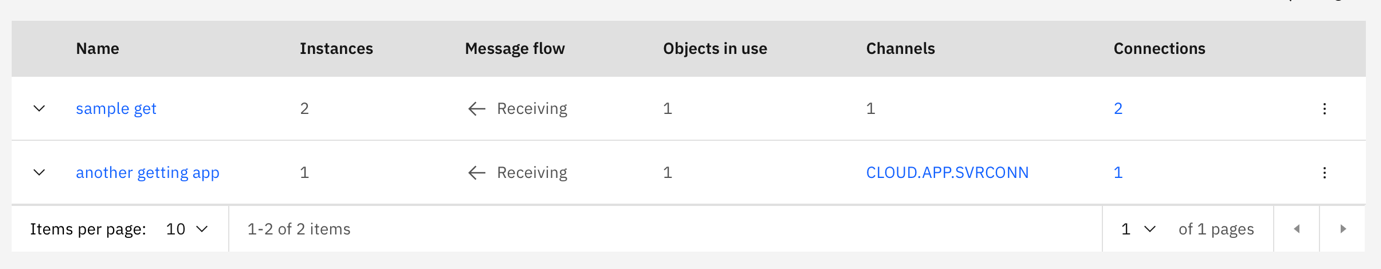
Note that the same application running with a different application name, shows up as a different application.
The name shown in the console corresponds to the ApplName that the applications used when creating the connection.
You now know how to use the console to see how many instances of an application are connected.
Which queue is your application opening?
Click Connections.

You can see that there are now 3 Receiving connections to DEV.QUEUE.1.
You can use the console to determine which applications are connected, how many connections they have open, and which queues they are using. These are all useful insights when you are trying to resolve issues that your messaging applications may be facing.
Challenge 2. Using the console to resolve common connectivity issues
In this challenge you will recreate some common connectivity errors. In this class of application bug, the application fails to connect to the queue manager. You can use the console to determine why your application is failing to connect.
This challenge ties in with Challenge 3. In Challenge 2 you will make a deliberate misconfiguration, that makes Challenge 2 more difficult. You will explore this misconfiguration further in Challenge 3.
All the edits, in this challenge, will be to the env.json file. You may have already encountered some of these issues if you had incorrectly configured the application for challenge 1 of this tutorial.
Modify the QUEUE_NAME in the env.json file to a non-existent queue.

Rerun the get sample.
You should see a 2085 MQRC_UNKNOWN_OBJECT_NAME error.
On the MQ Console, select queues.
Search for your queue
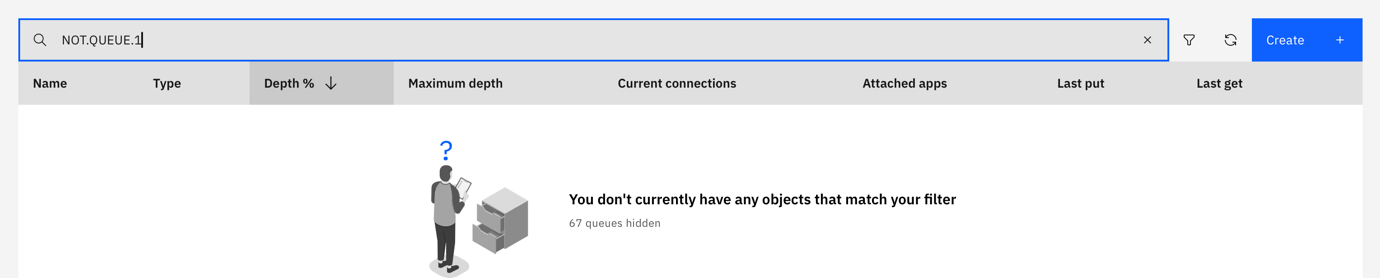
You can use the console to find the queues that your application is attempting to use.
The queue doesn’t exist, let’s use the console to create it
From the MQ Console, select Queues.

Click Create.
- Select Local.
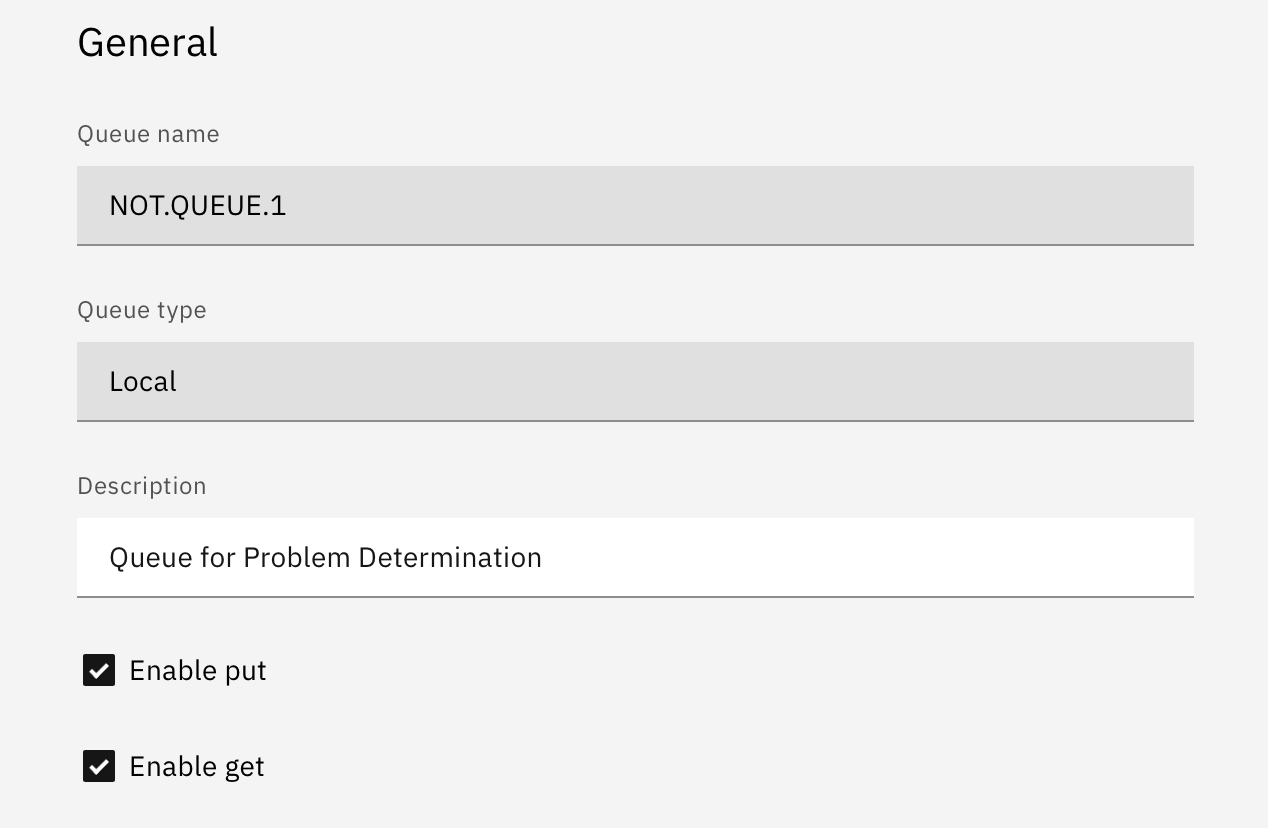
Enter the queue name but disable
get. This is a deliberate misconfiguration that is being introduced here to obfuscate another issue and make your task of problem determination a little more difficult.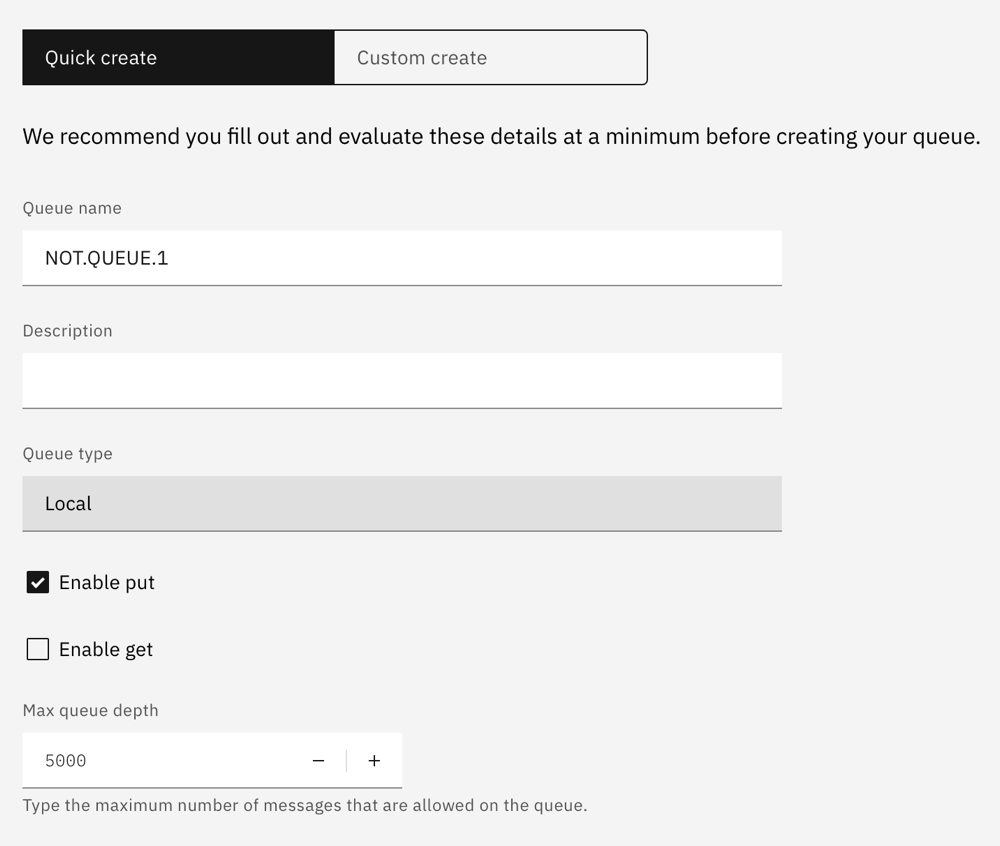
Click Create.
- Rerun your get application.
- This time you will see a 2035 MQRC_NOT_AUTHORIZED error.
On first sight this looks like a password error but note the “MQCONN to QM1 successful” message. The connection to the queue manager was successful, so the password was good. You might think that the unauthorized is because we didn’t enable get for this queue.
This, however, is a more fundamental issue, which we will explore, but for now let’s reenable get in an attempt to resolve the MQRC_NOT_AUTHORIZED error.
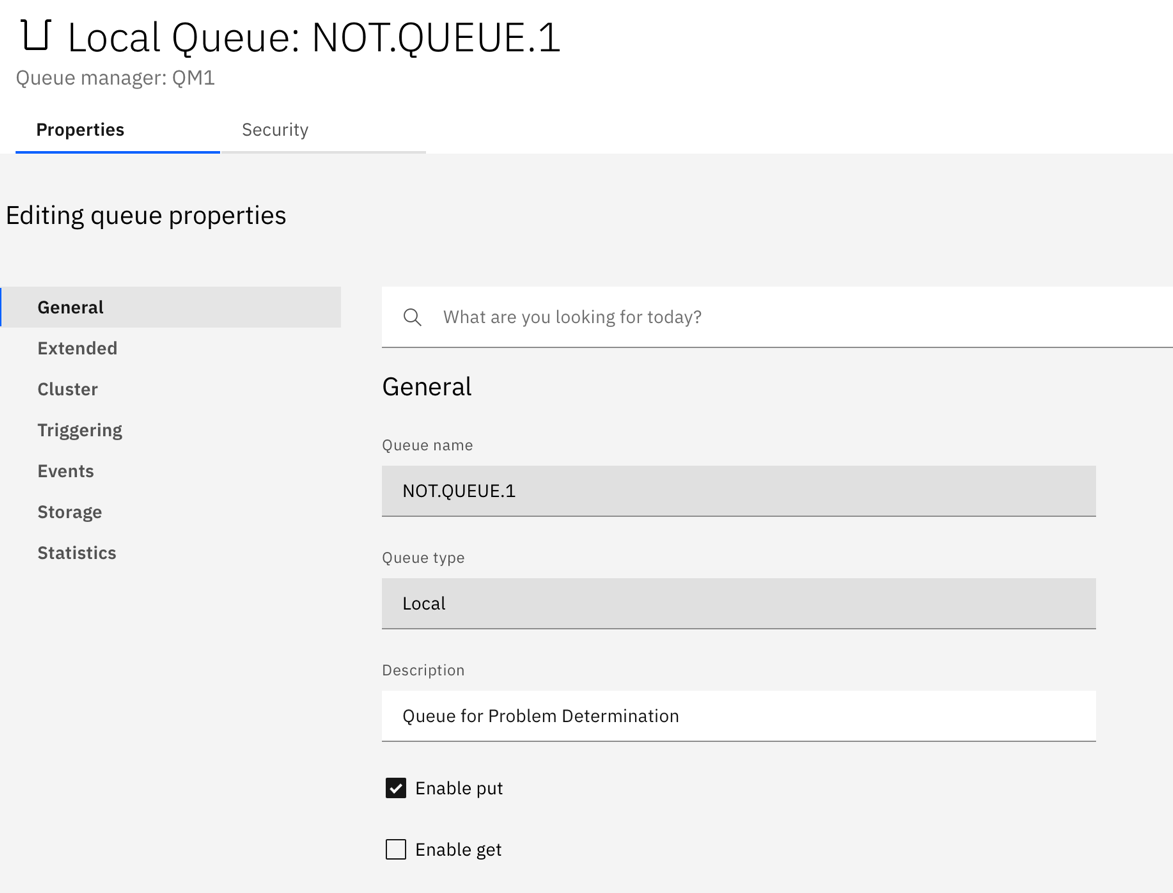
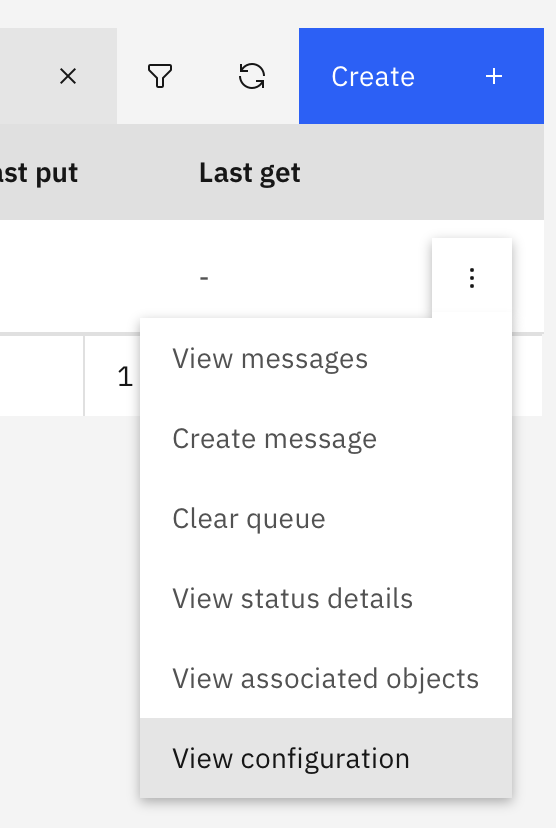
Using the console to check queue properties
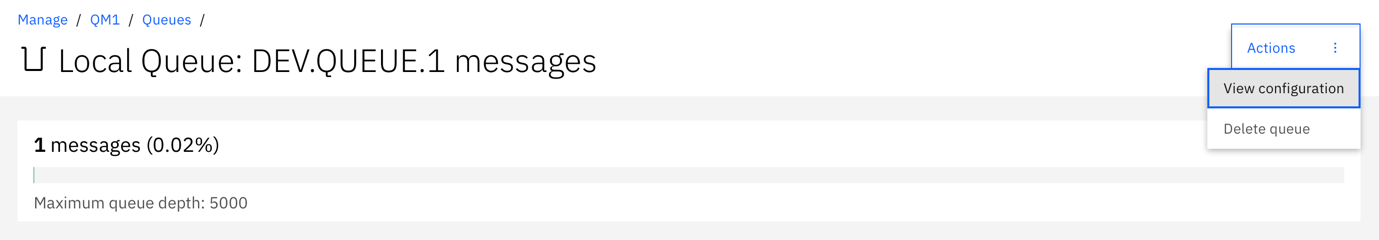
On the MQ Console, find the queue.
Open the configuration for the queue.

Note the get is "Inhibited." Is this the reason for the MQRC_NOT_AUTHORIZED error?

You can use the console to inspect and update a queue’s configuration.
Click Edit.
Select Enable get.
Click Save.
- Rerun your get sample.
- You should see the same 2035 MQRC_NOT_AUTHORIZED error.
This is the same error as before. Enabling get didn’t resolve the problem.
We have a MQRC_NOT_AUTHORIZED error. Is there a way to look at queue authorization or security properties?
You can use the console to determine security configurations for queues. First, we will look at what a permissive configuration should look like. The IBM MQ Advanced for Developers is configured to allow application access to MQ objects prefixed by DEV.. So a DEV. Queue should be configured correctly.
Using the console to examine security configurations
In the Console, open the configuration for the queue DEV.QUEUE.1
Click Security.
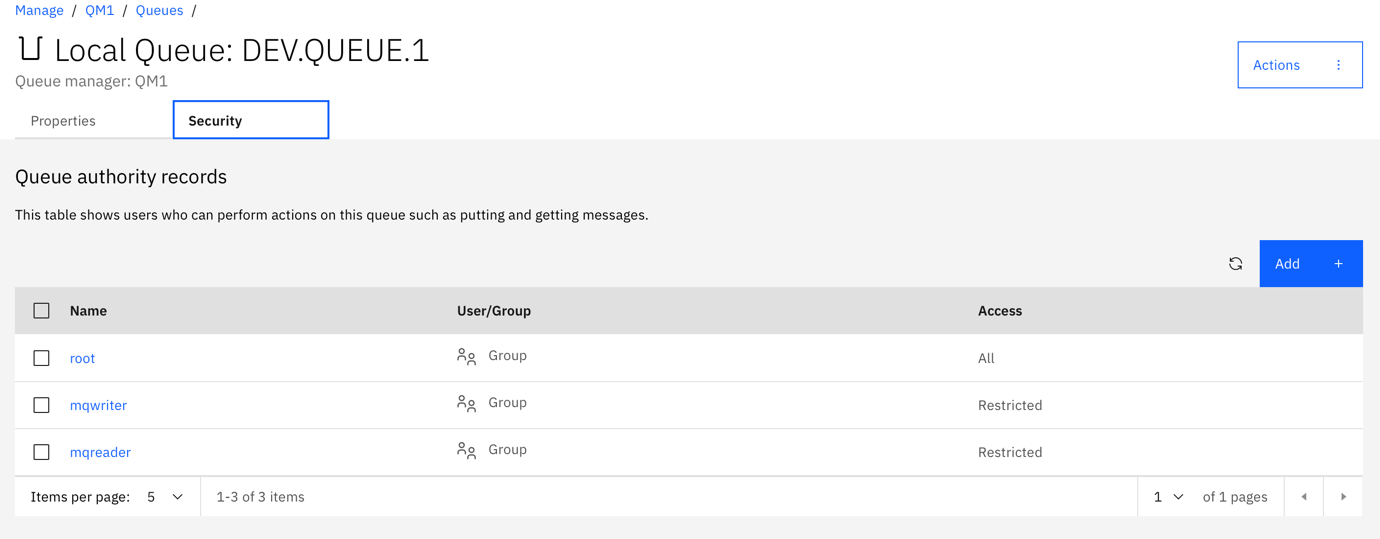
The application user “app” will be a member of the “mqwriter” group. Permissions granted to the mqwriter group are inherited by the application.
Click
mqwriter.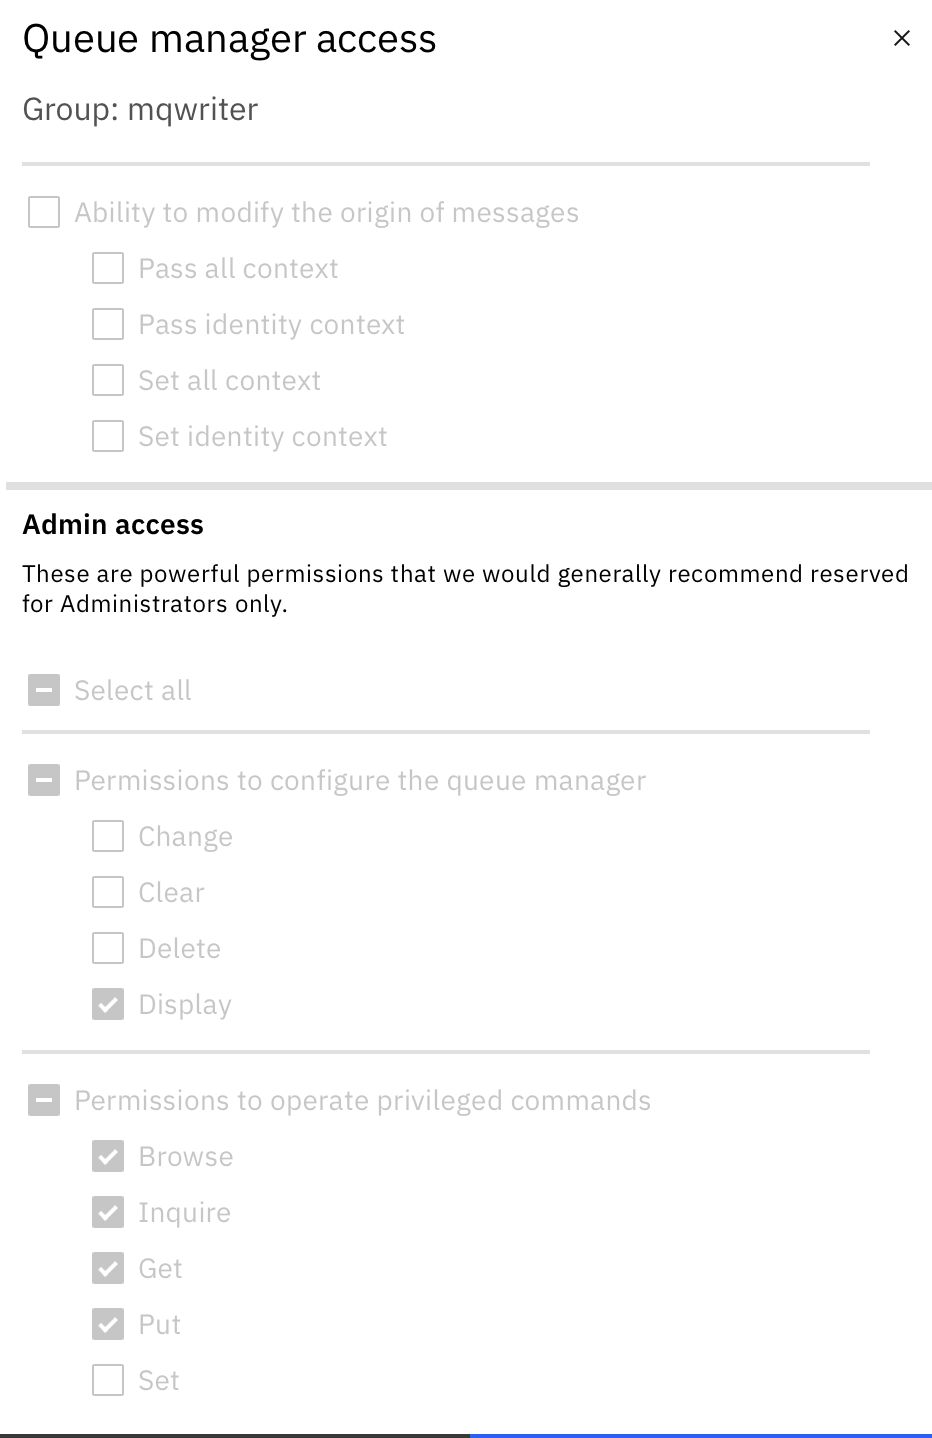
You can use the console to inspect queue permissions granted to users and groups.
Take a note of these permissions.
In the Console, open the configuration for the queue NOT.QUEUE.1.
Click Security.

Click
mqwriter. Hang on, where ismqwriter?
IBM MQ Advanced for Developers is configured to allow application access to MQ objects prefixed by DEV.. So, although the queue properties have been fixed to allow GET, your application, a member of "mqwriter", doesn’t have access to the "NOT." Queue. Was this the cause of the error? Let’s fix it and find out.
Using the console to change security configurations
- Click ADD.
Grant the user group
mqwriterappropriate access.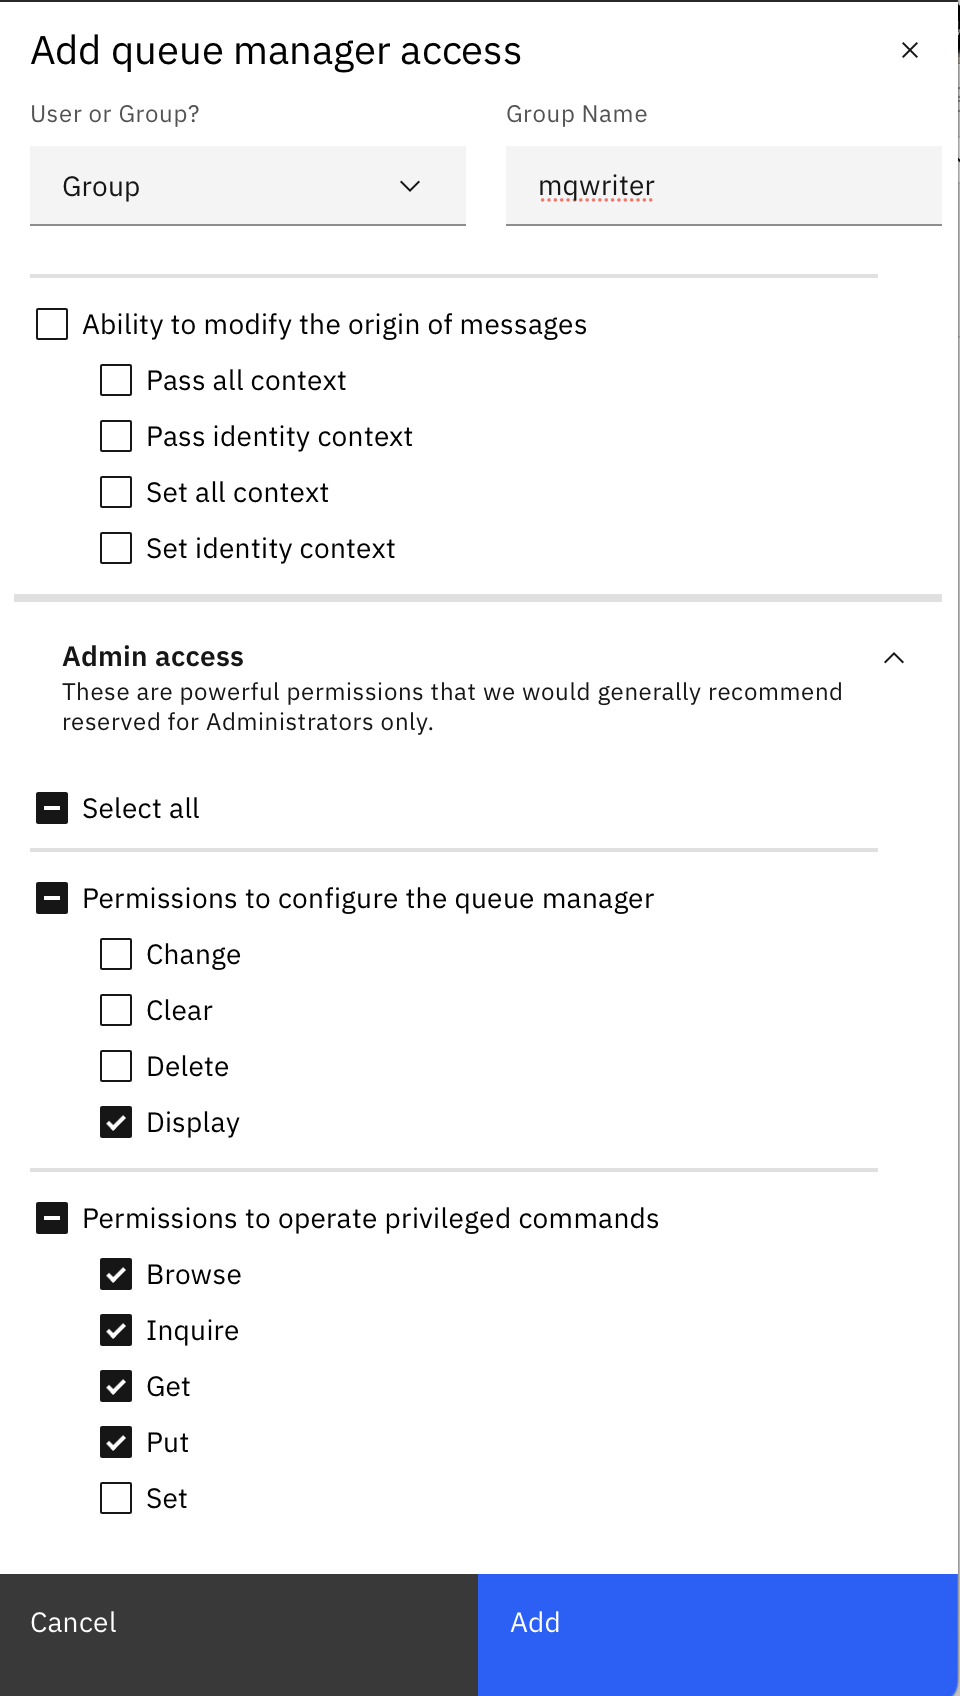
Click ADD.
Rerun your get application.
- You should see that it is able to connect and read from your queue.
You can use the console to inspect and modify queue (mis)configurations and security permissions, gaining an insight into why applications might be facing MQRC_NOT_AUTHORIZED errors.
Challenge 3. Using the console to modify queue properties
In this challenge you will use the console to recreate and resolve queue related issues.
Inhibited get
In challenge 2, you fixed a get inhibited misconfiguration that didn’t resolve a MQRC_NOT_AUTHORIZED error. In this challenge, you will reintroduce the misconfiguration and see what kind of error it results in. Let’s (re-)disable the get to see what error that throws.
Edit the queue configuration to disable get.
Click Save.
- Rerun your get application.
This time you should see a series of 2016 MQRC_GET_INHIBITED error messages.
The previous MQRC_NOT_AUTHORIZED errors were because your application did not have the authority to access the queue. You will always see errors that arise due to security restrictions before you see errors due to configuration restrictions.
Now that your application is authorised you are seeing MQRC_GET_INHIBITED errors are because the queue is not configured for GET.
Enable GET for the queue.

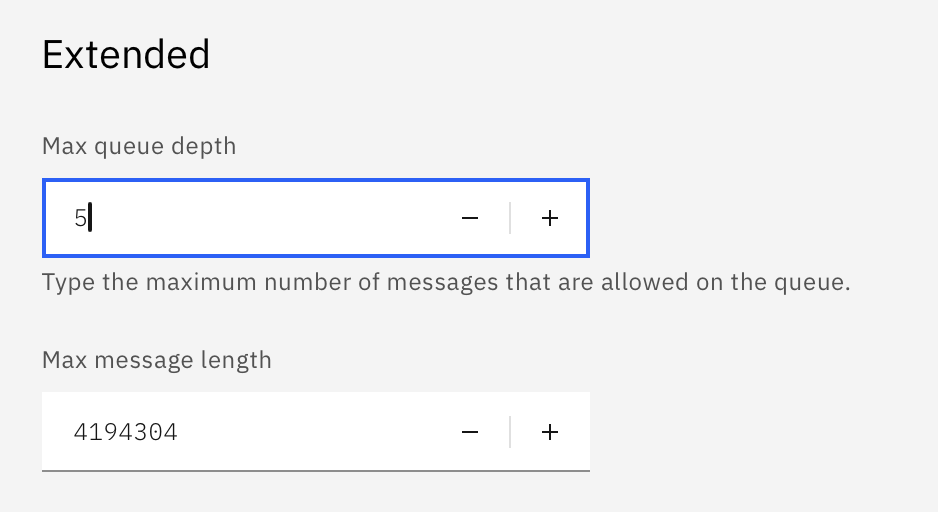
Queue full errors
While you are here, let’s introduce another misconfiguration.
Set the max queue depth to 5.
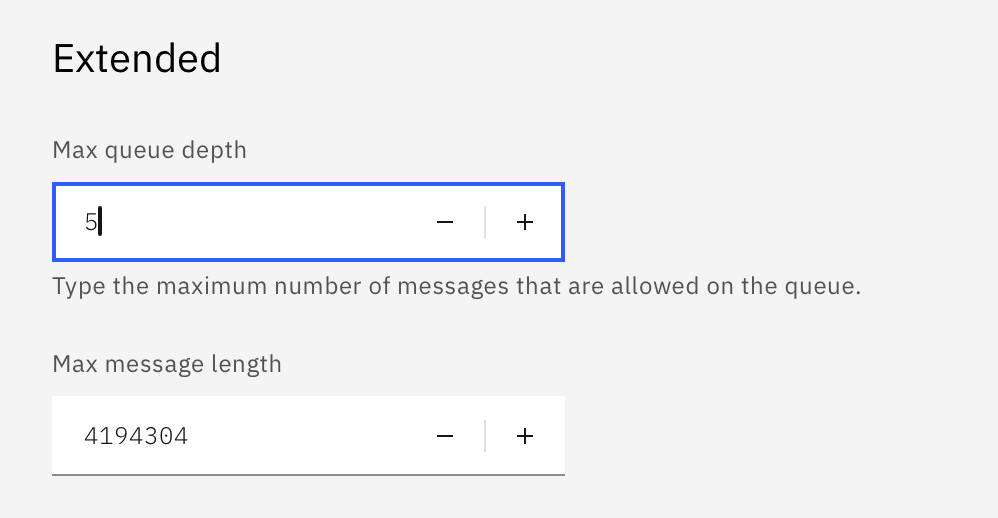
Click Save.
Go to a terminal or command window open at
mq-dev-patterns/Node.js.Run the sample put application.
DEBUG=sample*:*,boiler:* ApplName="sample put" node sampleput.jsRepeat the run five more times.
On the sixth run you should see a 2053 MQRC_Q_FULL error message.
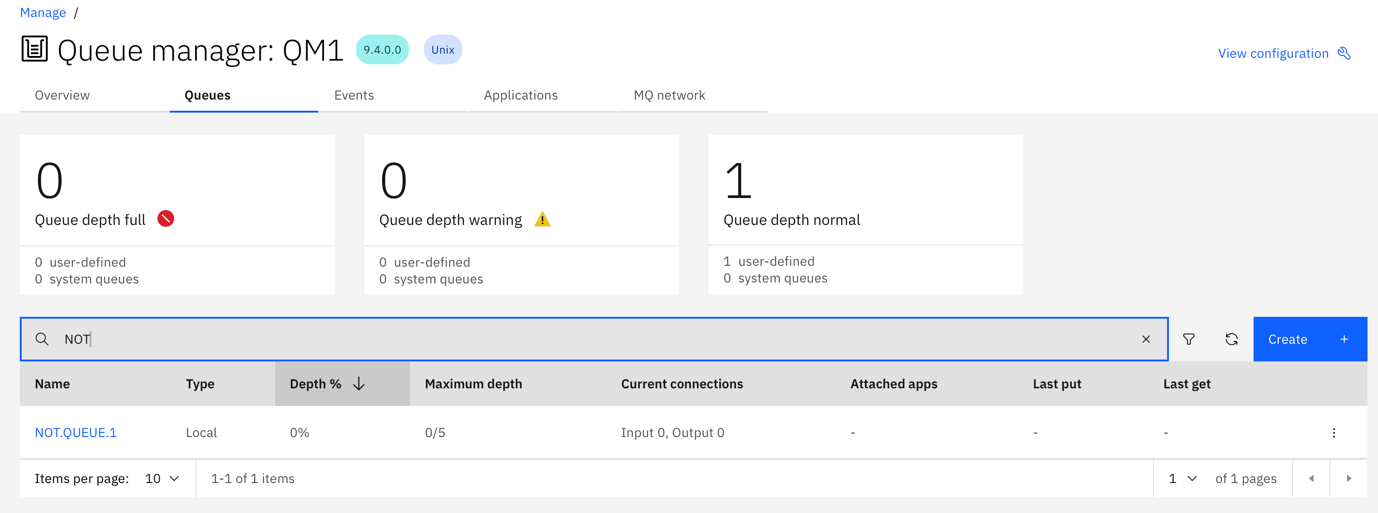
On the MQ Console, you can see that the queue is at 100% depth.

You can see that there are no attached applications. So, no applications taking messages off the queue.
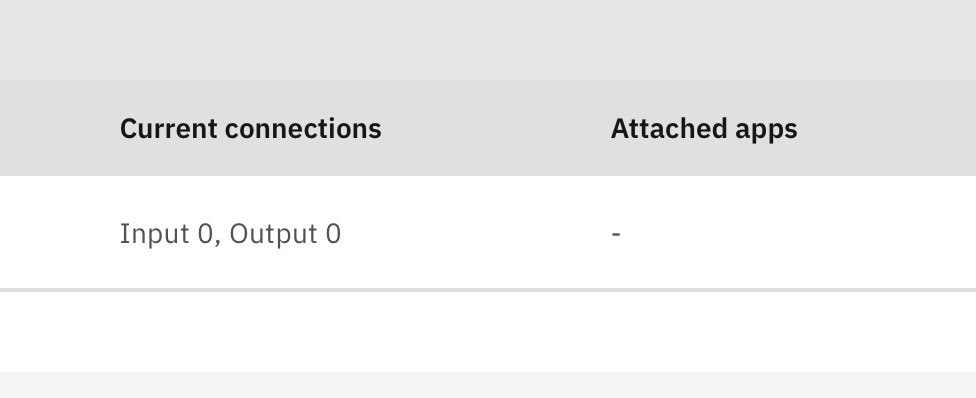
A queue is getting full is a symptom of slow or too few consumers.
Checking where the messages came from
Click the queue.
You can see which applications have been putting message onto the queue.
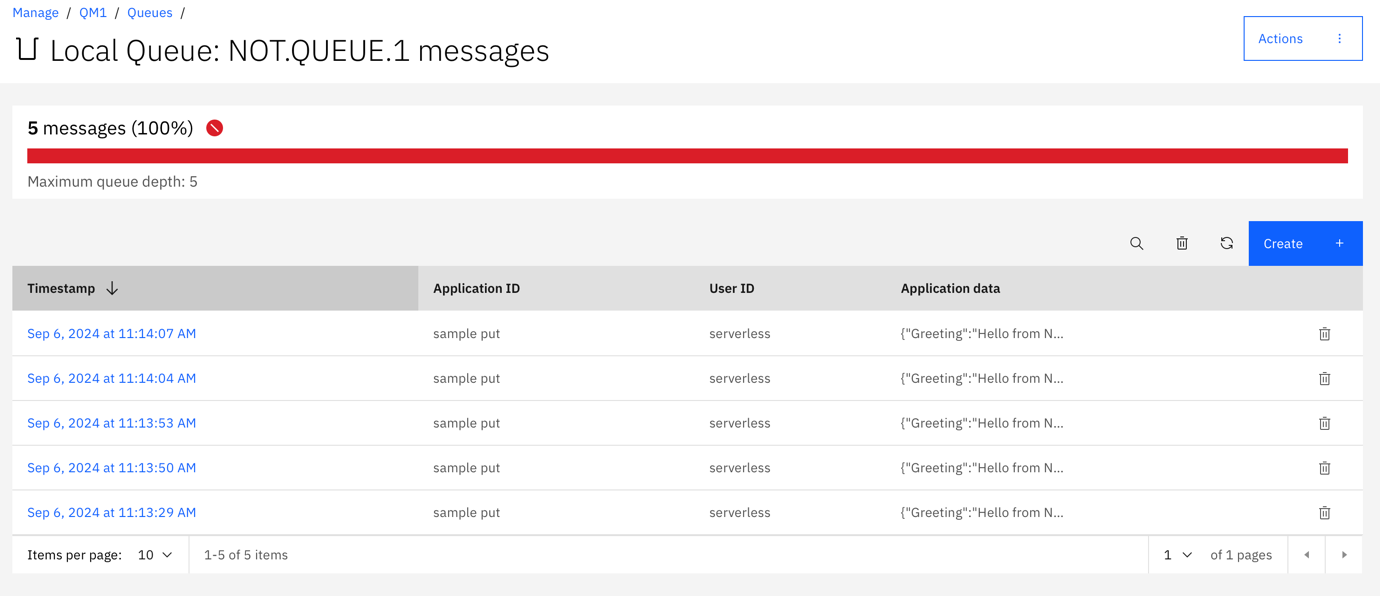
The console shows which ApplID was used to put individual messages on queues.
A build-up of messages in a queue, is a symptom of too few or too slow consumers. The solution for which would be to either throttle message producers or to increase consumers.
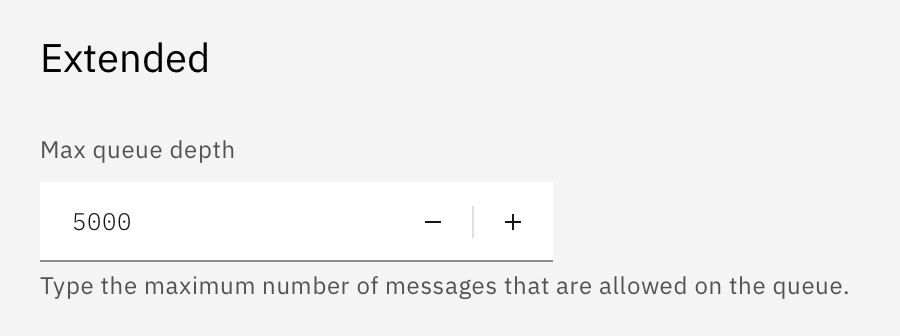
Using the console to change queue depth
For these challenges a queue depth of 5 is too small.
Change the queue depth back to 5000.
Your messaging applications will see security related restrictions as connections are refused and actions are not permitted before you see configuration related restrictions. You can use the console to drill down into queue related security and configuration properties.
You can use the console to see which applications have put messages that are waiting to be consumed on queues. This can help provide insights into how those messages should have been consumed.
Challenge 4. Using the MQ console to inspect subscriber connections
In this challenge, you will learn how to examine non-durable subscriptions in the console. Knowing what objects are created for subscriptions will help you identify subscription problems when they occur.
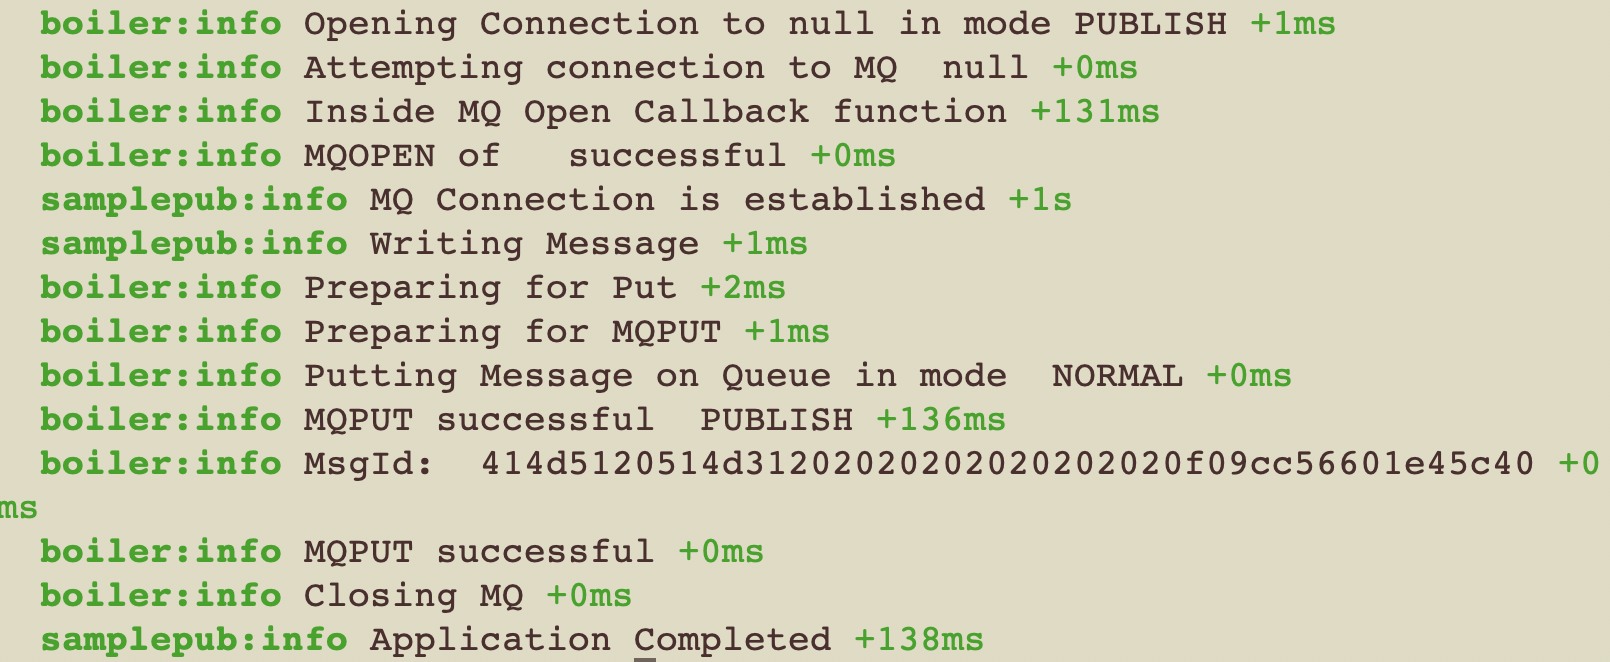
Start a publisher in a terminal or command window by running the following command.
DEBUG=sample*:*,boiler:* ApplName="sample publisher" node samplepublish.jsYou should see a MQRC_NO_SUBS_MATCHED warning that the publish was unsuccessful as there were no active subscribers,
If there are no subscribers to a topic, then a publisher will receive a MQRC_NO_SUBS_MATCHED warning. If there are no subscribers, then a message cannot be published.
Start a subscriber in a second terminal or command window by running the following command.
DEBUG=sample*:*,boiler:* ApplName="sample subscriber" node samplesubscribe.jsRerun the publisher in the 1st terminal. This time the publish should succeed and the subscriber will see the newly published message.
While the subscriber is running look at the application connections in the MQ Console.
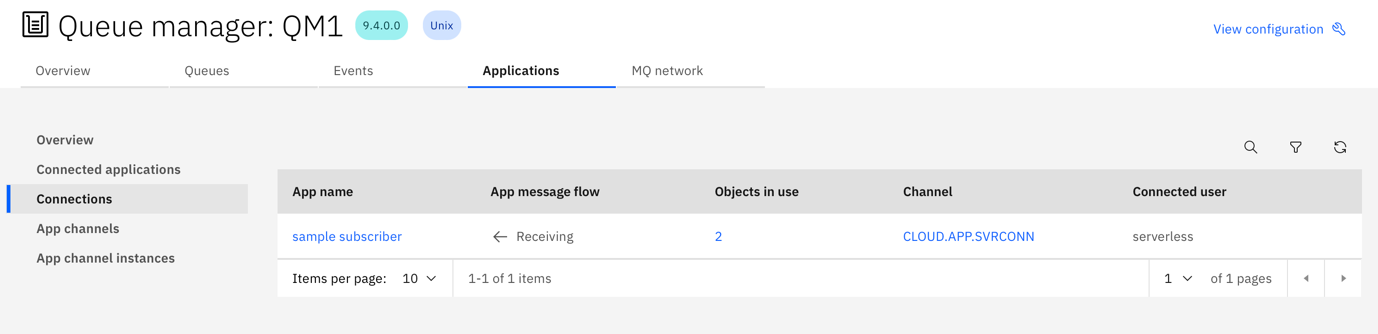
Click the objects in use count.
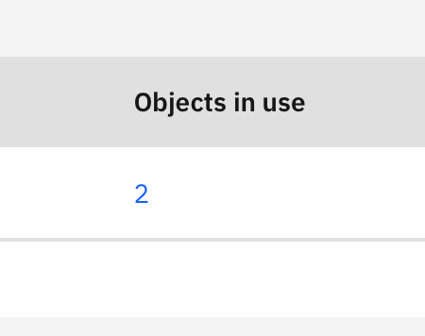
The subscriber has two connections. The first to the topic that it has subscribed to. The second is the underlying non-durable queue.
Take note of the queue name.
To receive a message the subscriber must be running connected and listening to receive a publication. Publications sent when the subscriber is not running, will not be received.
Systems queues as seen in the console
- If it is still running, stop the subscriber.
- On the MQ console, go to the Queues tab.
Change the filter to show system queues.
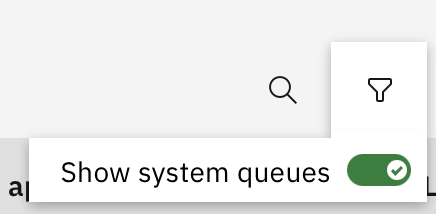
You can use the console to inspect system queues, like the non-durable queues created for subscriptions.
Search for the queue that your publisher was connected to.
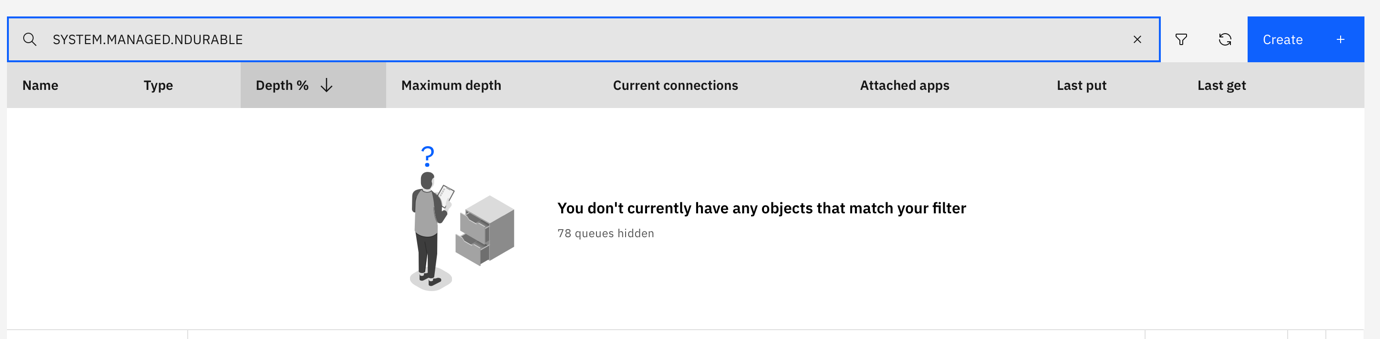
That queue has been removed.
Non-durable queues created for subscriptions are dropped when the subscriber closes its connection.
Rerun the publisher. Again, you should see the MQRC_NO_SUBS_MATCHED warning that this message was not published.
You know how to use the console to inspect a subscription, and the underlying non-durable system queue created for the subscription.
Challenge 5. Using the MQ console to inspect durable subscriptions
In this challenge, you will learn how to examine durable subscriptions in the console.
Subscriptions that register interest for future messages
It is possible for a subscriber to put a “hold” on publications by creating a durable subscription.
Rerun the subscriber as a durable subscription by running this command:
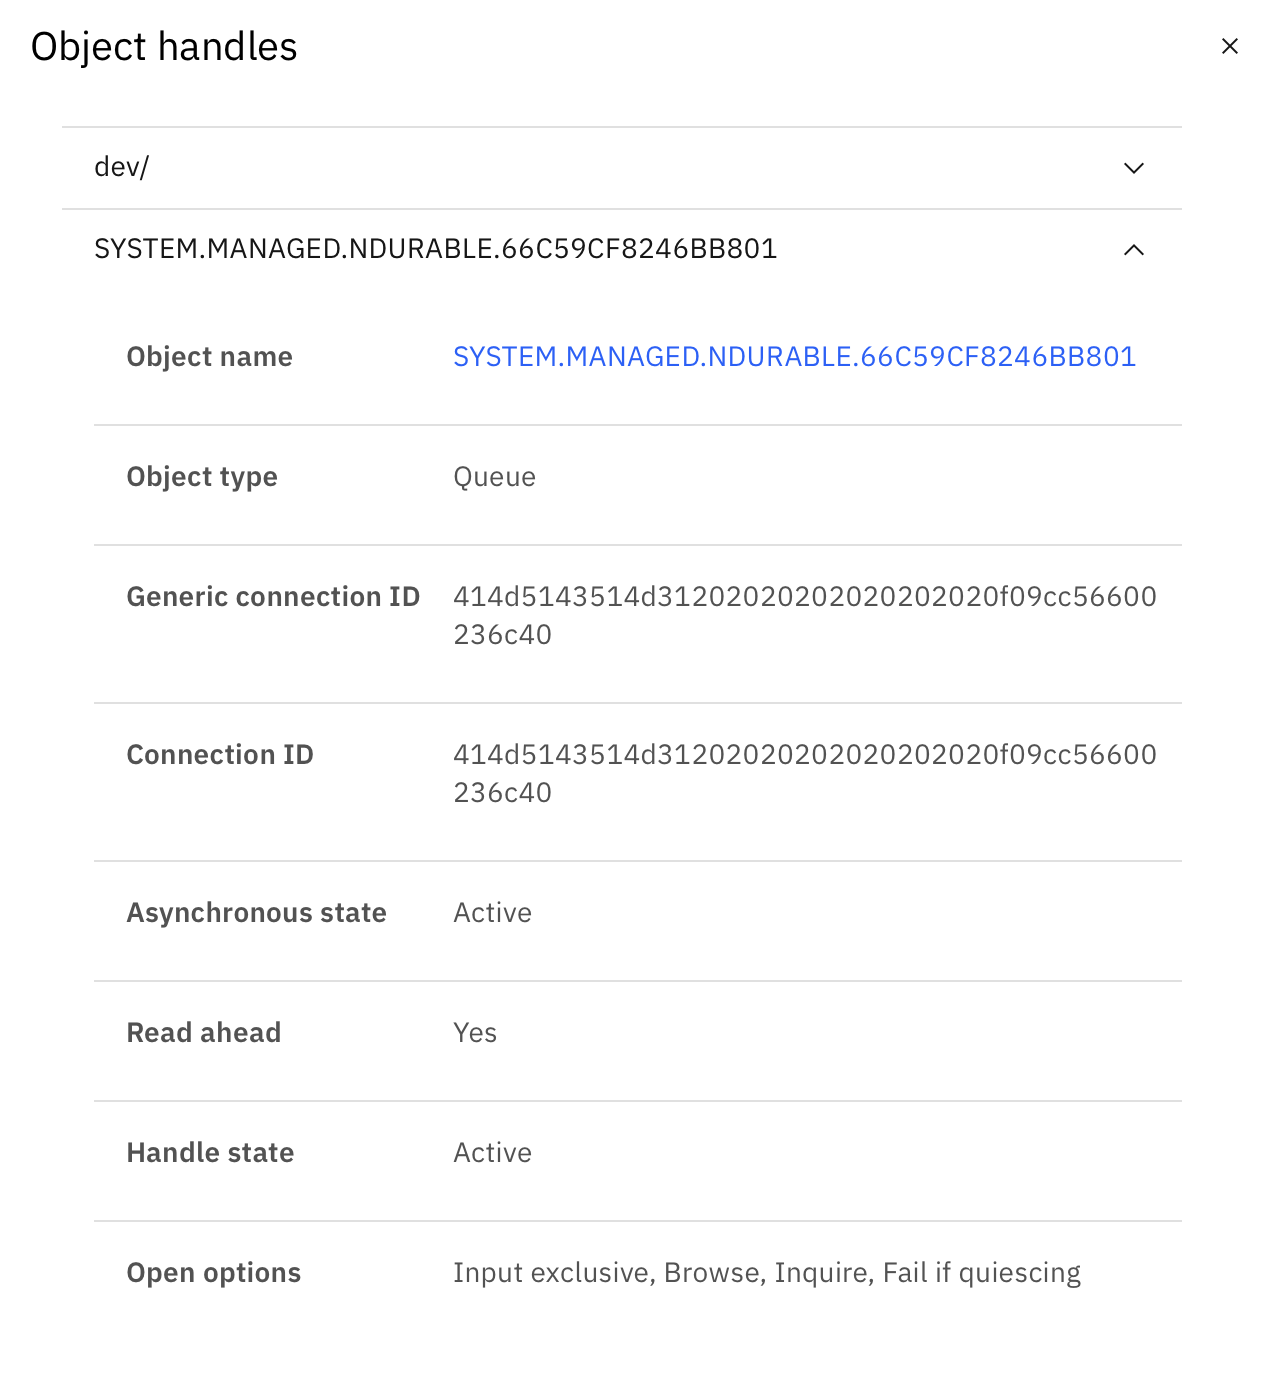
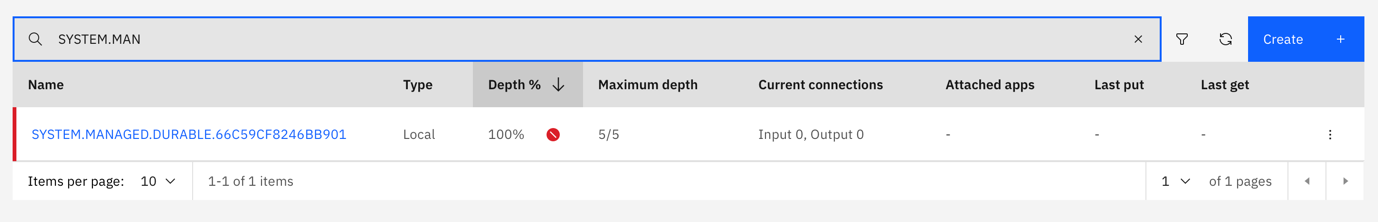
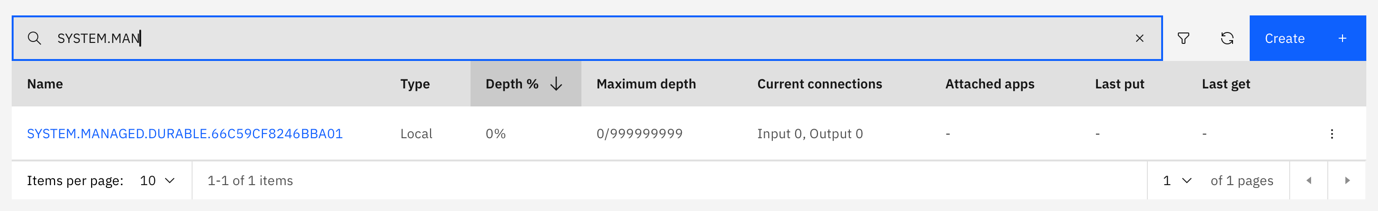
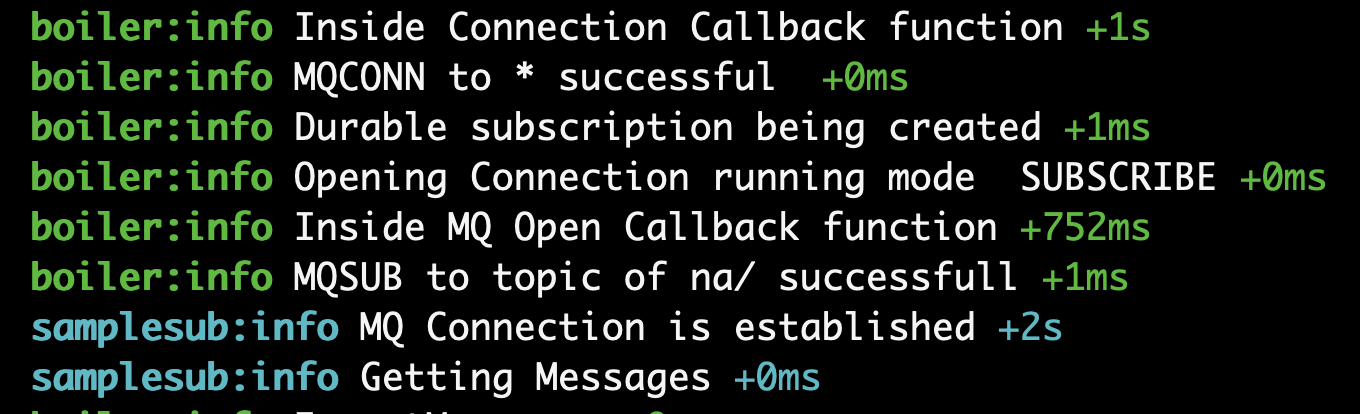
DEBUG=sample*:*,boiler:* DURABLE=1 ApplName="sample durable subscriber" node samplesubscribe.jsOn the MQ Console, note that the system queue associated with this subscription is now a
SYSTEM.MANAGED.DURABLE.*queue.
If it is still running, terminate the subscriber.
In the MQ Console, note that the managed durable queue still exists, and is empty.
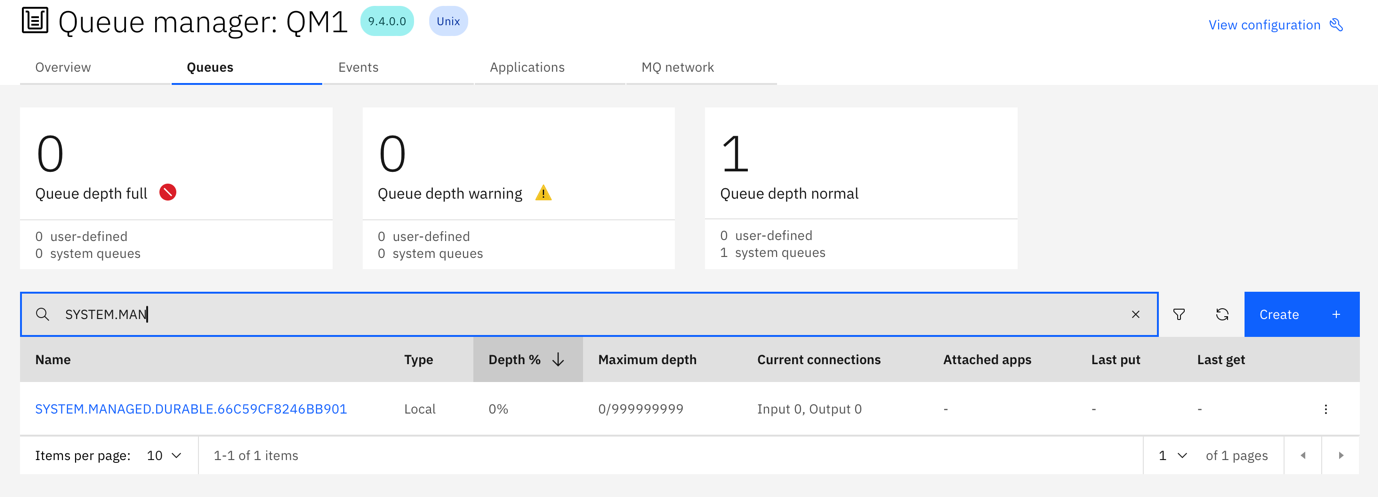
System queues created for durable subscriptions persist after a subscriber has disconnected from the queue manager.
Subscription queue misconfigurations
You will now introduce a misconfiguration on this queue, whereby a subscriber with a durable subscription will lose published messages.
Open the configuration for the queue.
Update the queue depth, setting it to 5.
Save your changes.
Permissions permitting, it is possible to change the configuration properties of durable system queues from the console.
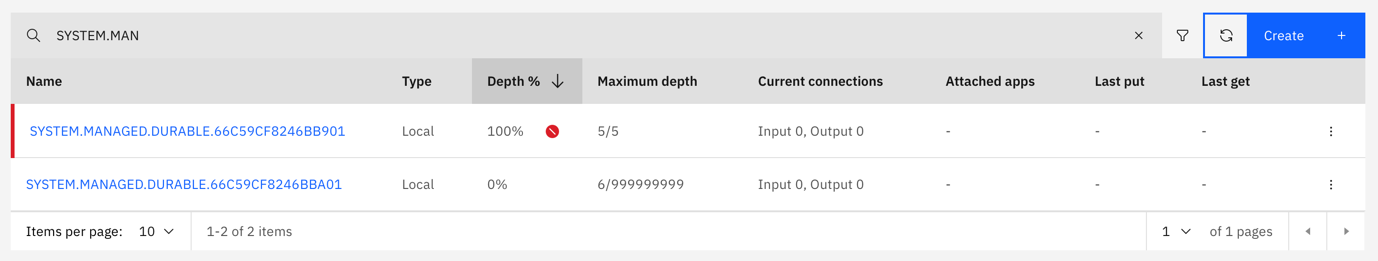
Run the publisher six times. Even though the subscriber isn’t running, there is an active durable subscription, and all 6 should be successfully published.
On the MQ Console, you can see that the queue is full, but only contains 5 of the messages. The sixth publication has not been delivered to this durable subscription.
Subscribing to existing durable subscriptions
Run the subscriber, remembering to use the same ApplName as before, as the application that you are running uses the application name as the subscription name.
The subscriber will receive only 5 messages, the first 5 that were published before the durable queue behind the durable subscription became full.

If it is still running terminate the subscriber, the rerun the subscriber, but with a different
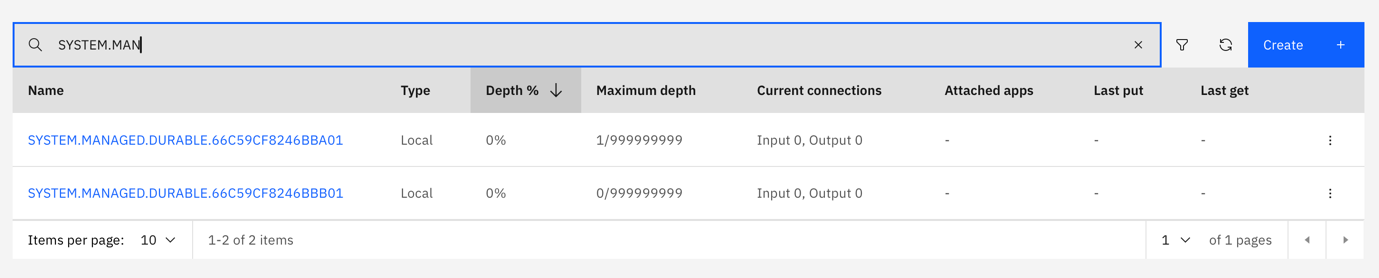
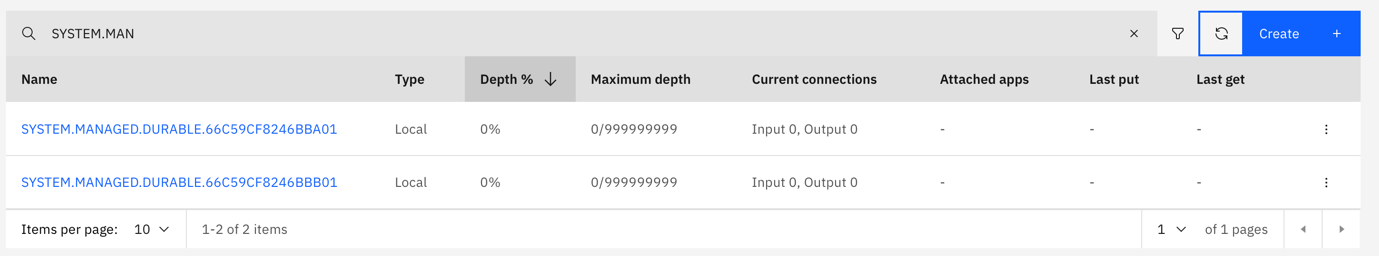
ApplName.DEBUG=sample*:*,boiler:* DURABLE=1 ApplName="second durable subscriber" node samplesubscribe.jsYou should now see two
SYSTEM.MANAGED.DURABLE.*queues, one for each of the registered durable subscriptions.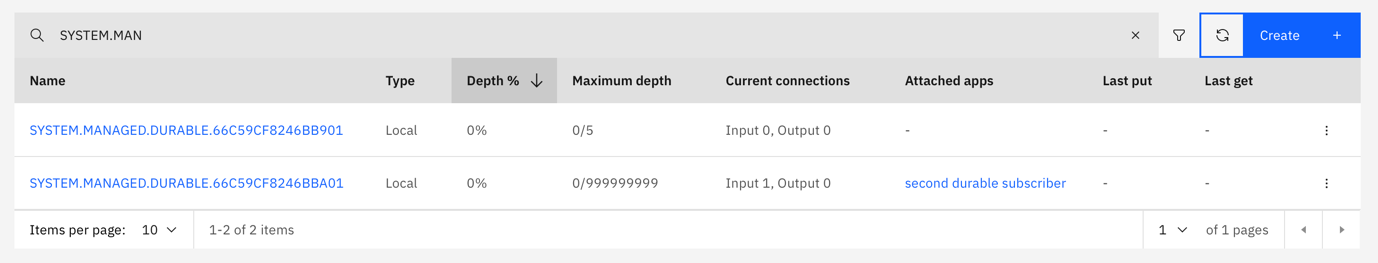
Terminate the subscriber and rerun the publisher to publish 6 new messages.
The MQ console shows that one managed durable queue is full containing 5 messages, and the other has all 6 messages.
Rerun the subscriber.
The MQ console will show that only one of the durable subscription queues have been drained.

Applications identify which durable subscription they are using by specifying a subscription name. The queue manager will store any matching published messages on a managed durable queue. If the application changes its subscription name, then that is treated as a different new subscription. The old queue for the old subscription name will remain.
You now know how to use the console to inspect the properties of system queues created for durable subscriptions. This allows you to find orphaned durable subscriptions, ones that no subscriber is listening on, but is becoming full. When a subscription doesn’t receive an expected publication, you can use the console to see if they arrive on the durable system queue.
Challenge 6. Using the MQ console to identify subscription housekeeping errors
In this challenge, you will learn how and how not to housekeep orphaned subscriptions.
Housekeeping
For housekeeping you may want to remove old unneeded durable subscriptions, as they may only grow, become full, and never get used.
In the MQ Console, select the full system managed durable queue.
Elect to delete the queue.

You should see a warning that the queue is not empty.
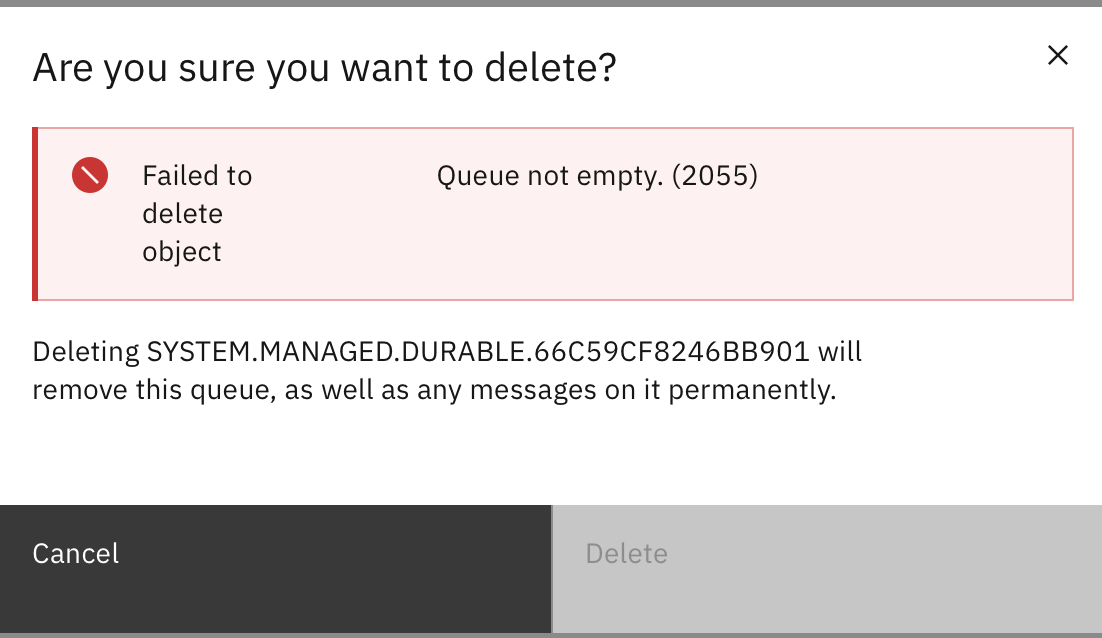
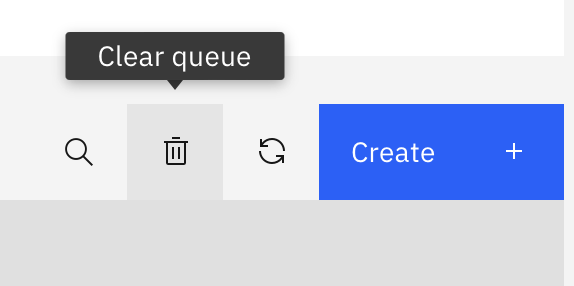
Clear the queue.
Delete the queue. There should now be only one queue being used for one durable subscription.
Rerun the subscriber, with the original
ApplNameand hence the application will use the original subscription name.DEBUG=sample*:*,boiler:* DURABLE=1 ApplName="sample durable subscriber" node samplesubscribe.jsYou should see a 2522 MQRC_INVALID_DESTINATION error.
While you deleted the queue being used to hold publications for the durable subscription, you hadn’t deleted the subscription. The subscription is still registered but fails because the underlying system durable queue has been removed.
Using the console to examine durable subscriptions
On the MQ Console, select Events, then Subscriptions.
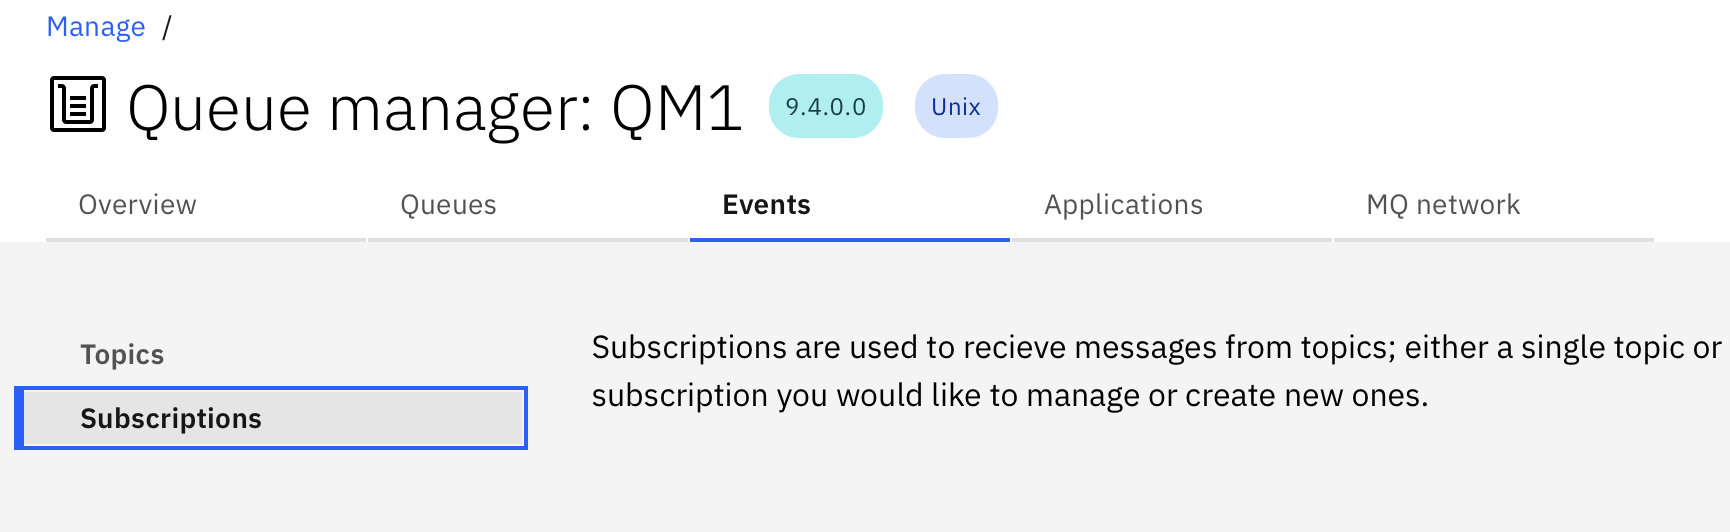
Search for your durable subscriptions.
You can use the console to list existing durable subscriptions, and the topic for the subscription.
Select the configuration for the now bad sample durable subscription

Select to delete the subscription.

Rerun the subscriber.
DEBUG=sample*:*,boiler:* DURABLE=1 ApplName="sample durable subscriber" node samplesubscribe.jsThe subscription should now be successful.
Don’t use the console to remove system queues, for orphaned subscriptions. The subscription remains and may lead to MQRC_INVALID_DESTINATION application errors. You can use the console to list durable subscriptions and check the health of system queues associated with the subscriptions.
Challenge 7. Using the console to debug topic string errors
In this challenge, you will use the console to recreate and debug common topic string related errors.
The IBM MQ Advanced for Developers configuration grants application access to the topic string dev/ the ending / is significant. In this case it is not a separator, it is the 4th character in the topic string. To use a sub-topic, a separator needs to be applied. For the IBM MQ Advanced for Developers configuration this means a sub-topic of the form dev//abc and not dev/abc.
Edit the
env.jsonfile to subscribe to a topic off dev/.
Run the publisher.
You will get a 2035 MQRC_NOT_AUTHORIZED error.
Edit the
env.jsonfile to subscribe to a topic off dev//.
You should see the MQRC_NO_SUBS_MATCHED subscription error.
The MQ console should show that the message didn’t make it to the durable subscriptions. That is because the subscription is for dev/

Rerun the subscriber.
DEBUG=sample*:*,boiler:* DURABLE=1 ApplName="sample durable subscriber" node samplesubscribe.jsThe subscription should be successful
There should be no new managed queues shown on the MQ Console.

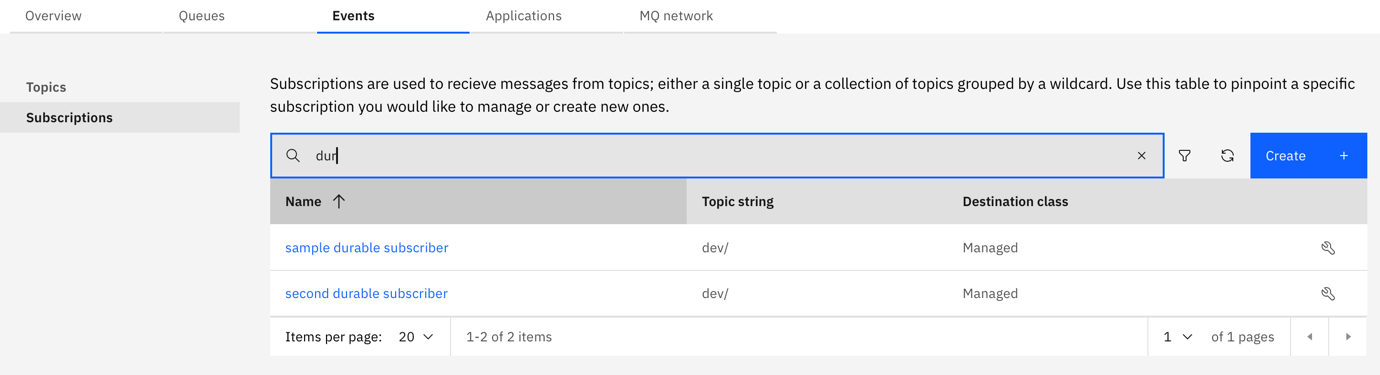
Using the console to examine subscriptions
Look at the objects in use for the application.
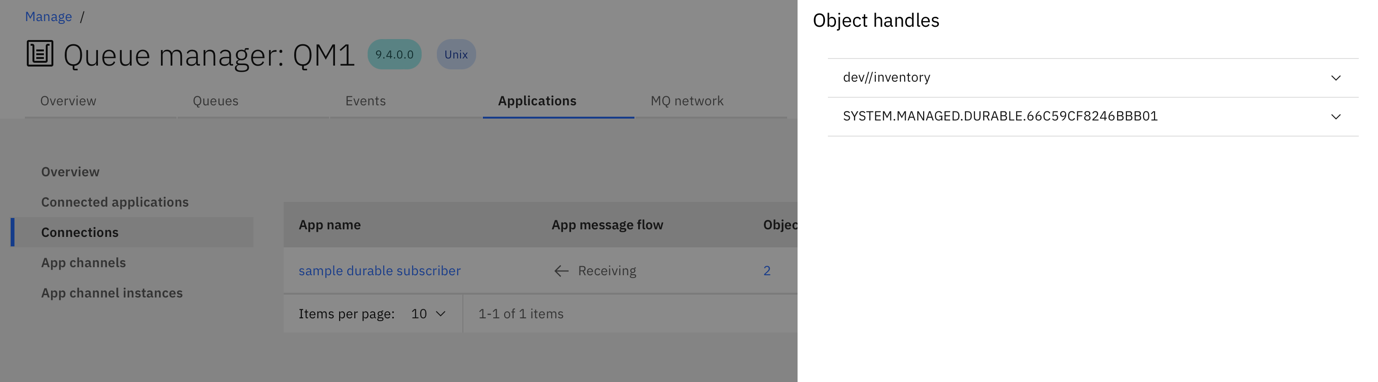
This new subscription is for dev//inventory.
If it is running, terminate the subscriber. Without changing the
env.jsonfile run the subscriber with a name matching the other subscription.DEBUG=sample*:*,boiler:* DURABLE=1 ApplName="second durable subscriber" node samplesubscribe.jsCheck the objects in use.

Even though the application attempted to subscribe to dev//inventory the subscription is still for dev/. This is because it is connecting to an existing durable subscription.
It is not possible to change the topic string for an existing durable subscription.
You can use the console to inspect the topic string associated with a durable subscription.
Examining subscriptions that appear to work, when they shouldn't
If it is still running, terminate the subscriber.
In the
env.jsonfile change the topic, to one that isn’t defined by the IBM MQ Advanced for Developers configuration.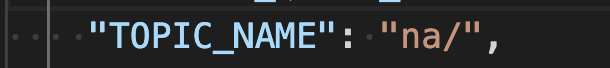
Rerun the subscriber.
Again, the connection is successful but recall that at the top of this Challenge we said that the IBM MQ Advanced for Developers configuration grants application access to the topic string "dev/"" ie. Not "na/"", so we should have seen an error. So why didn’t we see an error? It’s because the existing durable subscription is still to "dev/"" and not "na/"".
If a subscription appears to be successful, but doesn’t receive the correct publications, use the console to verify the subscription topic string.
Run the publisher.
It should fail to publish with a 2035 MQRC_NOT_AUTHORIZED error.
The application user is not allowed to publish to this string. A reconnect subscription to an existing durable subscription ignores the supplied topic string.
Change the topic name back to dev/ in the json file.
Rerun the publish application.
You can see the message on the managed durable subscription queue.
Bad durable subscribers
Change the topic name in the
env.jsonfile to what is an invalid topic string.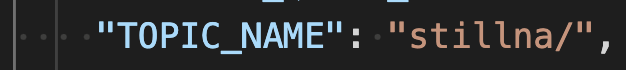
Run the subscriber.
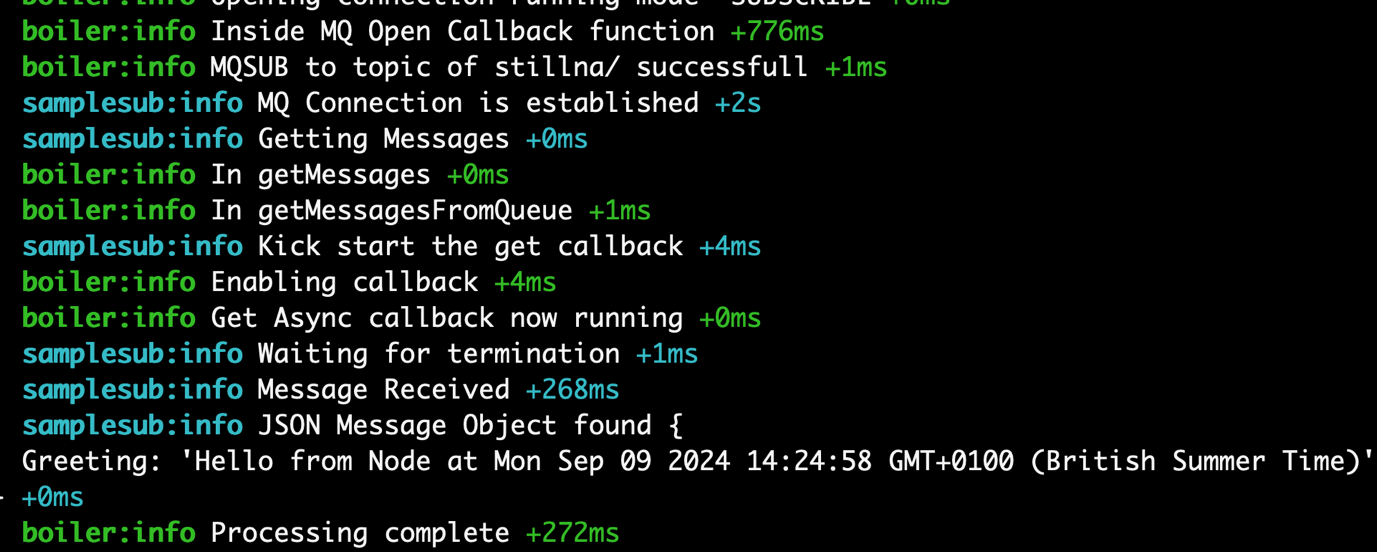
The application seemingly collects the message from the bad stillna/ topic but gets it from the durable dev/ topic.
Rerun the subscriber, but this time with a different
ApplName.DEBUG=sample*:*,boiler:* DURABLE=1 ApplName="third durable subscriber" node samplesubscribe.jsThis time the subscription will fail with a 2035 MQRC_NOT_AUTHORIZED error.
No new durable subscription will have been created.
If the published messages being received by a subscriber don’t appear to be matching the subscription, use the console to check the properties of the durable subscription.
Summary
In this tutorial, you recreated some common IBM MQ messaging issues. Then, you learned how to use the IBM MQ Console as a problem determination tool to help identify root causes.
Now, if a messaging application isn’t behaving as in should you know how to use the console to determine why.