Elastic Observability, built on open source
Store more, spend less, and troubleshoot faster with agentic AI.

Manifesto
Live logs and prosper: Fixing a fundamental flaw in modern observability

Fix problems in seconds, not hours
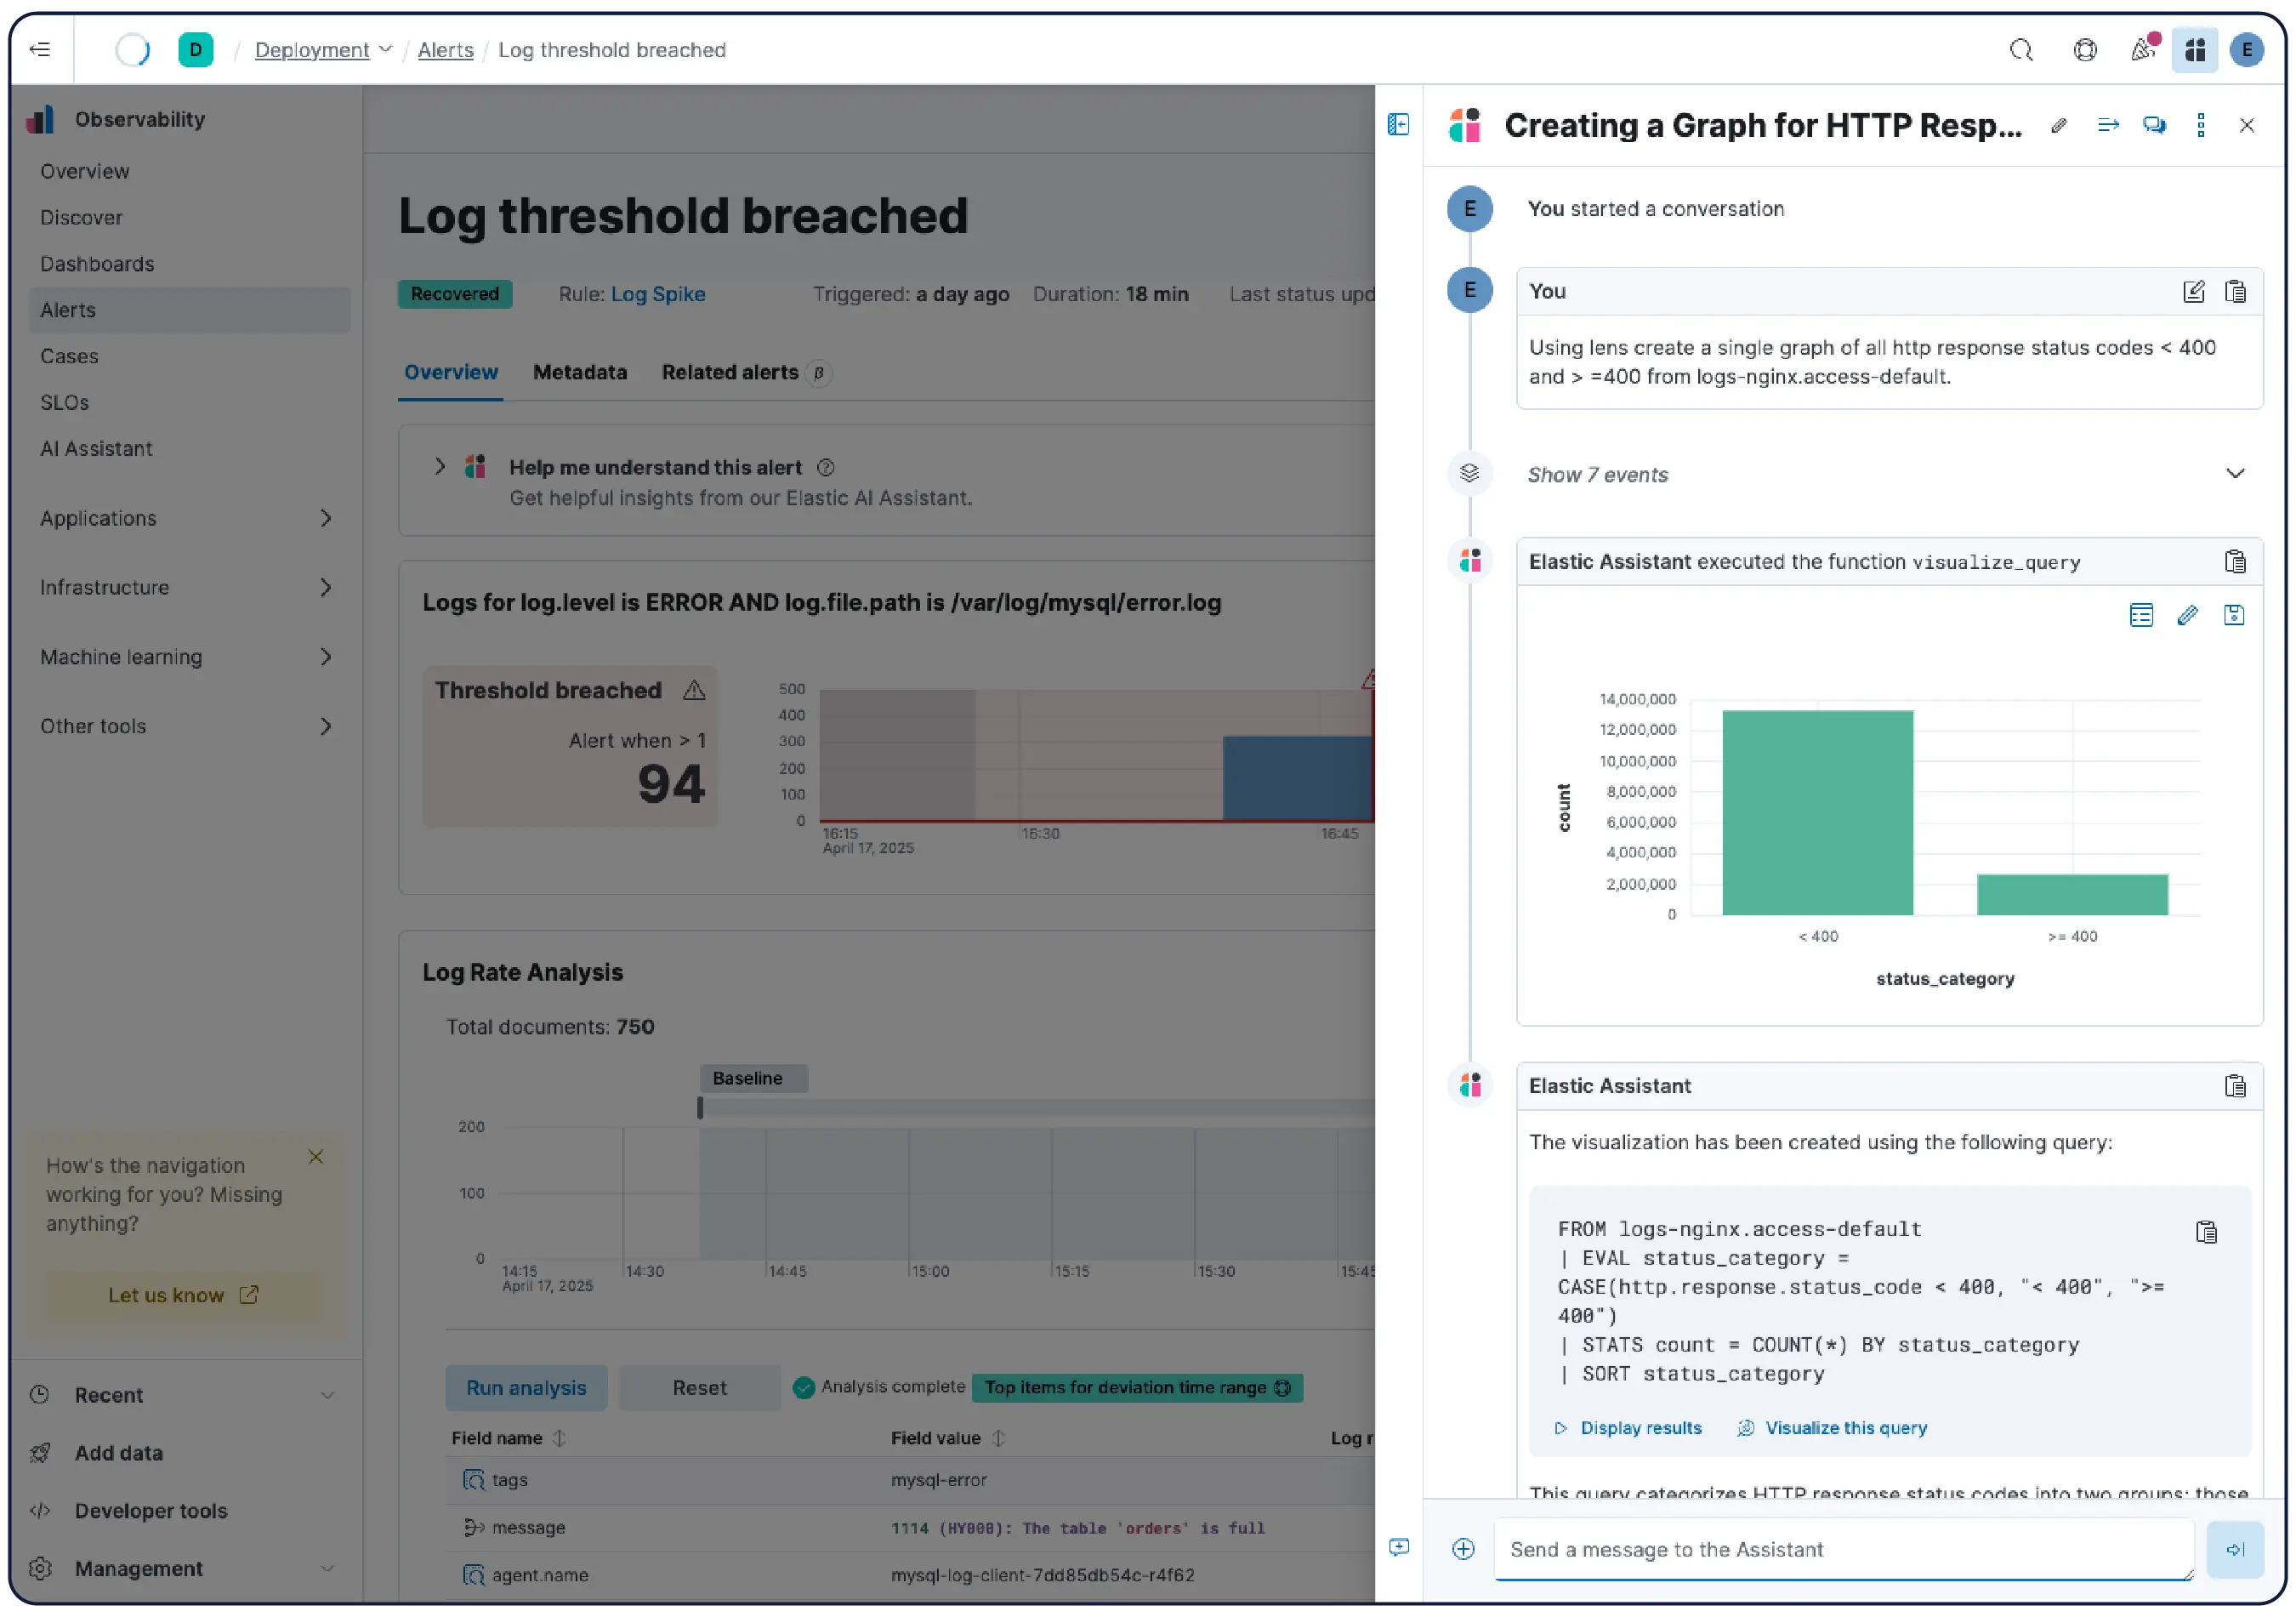
Use AI to get answers, not just alerts.
go deeper into Elastic Observability
From ingest to insight. Discover the agentic AI-driven features that make observability easy.
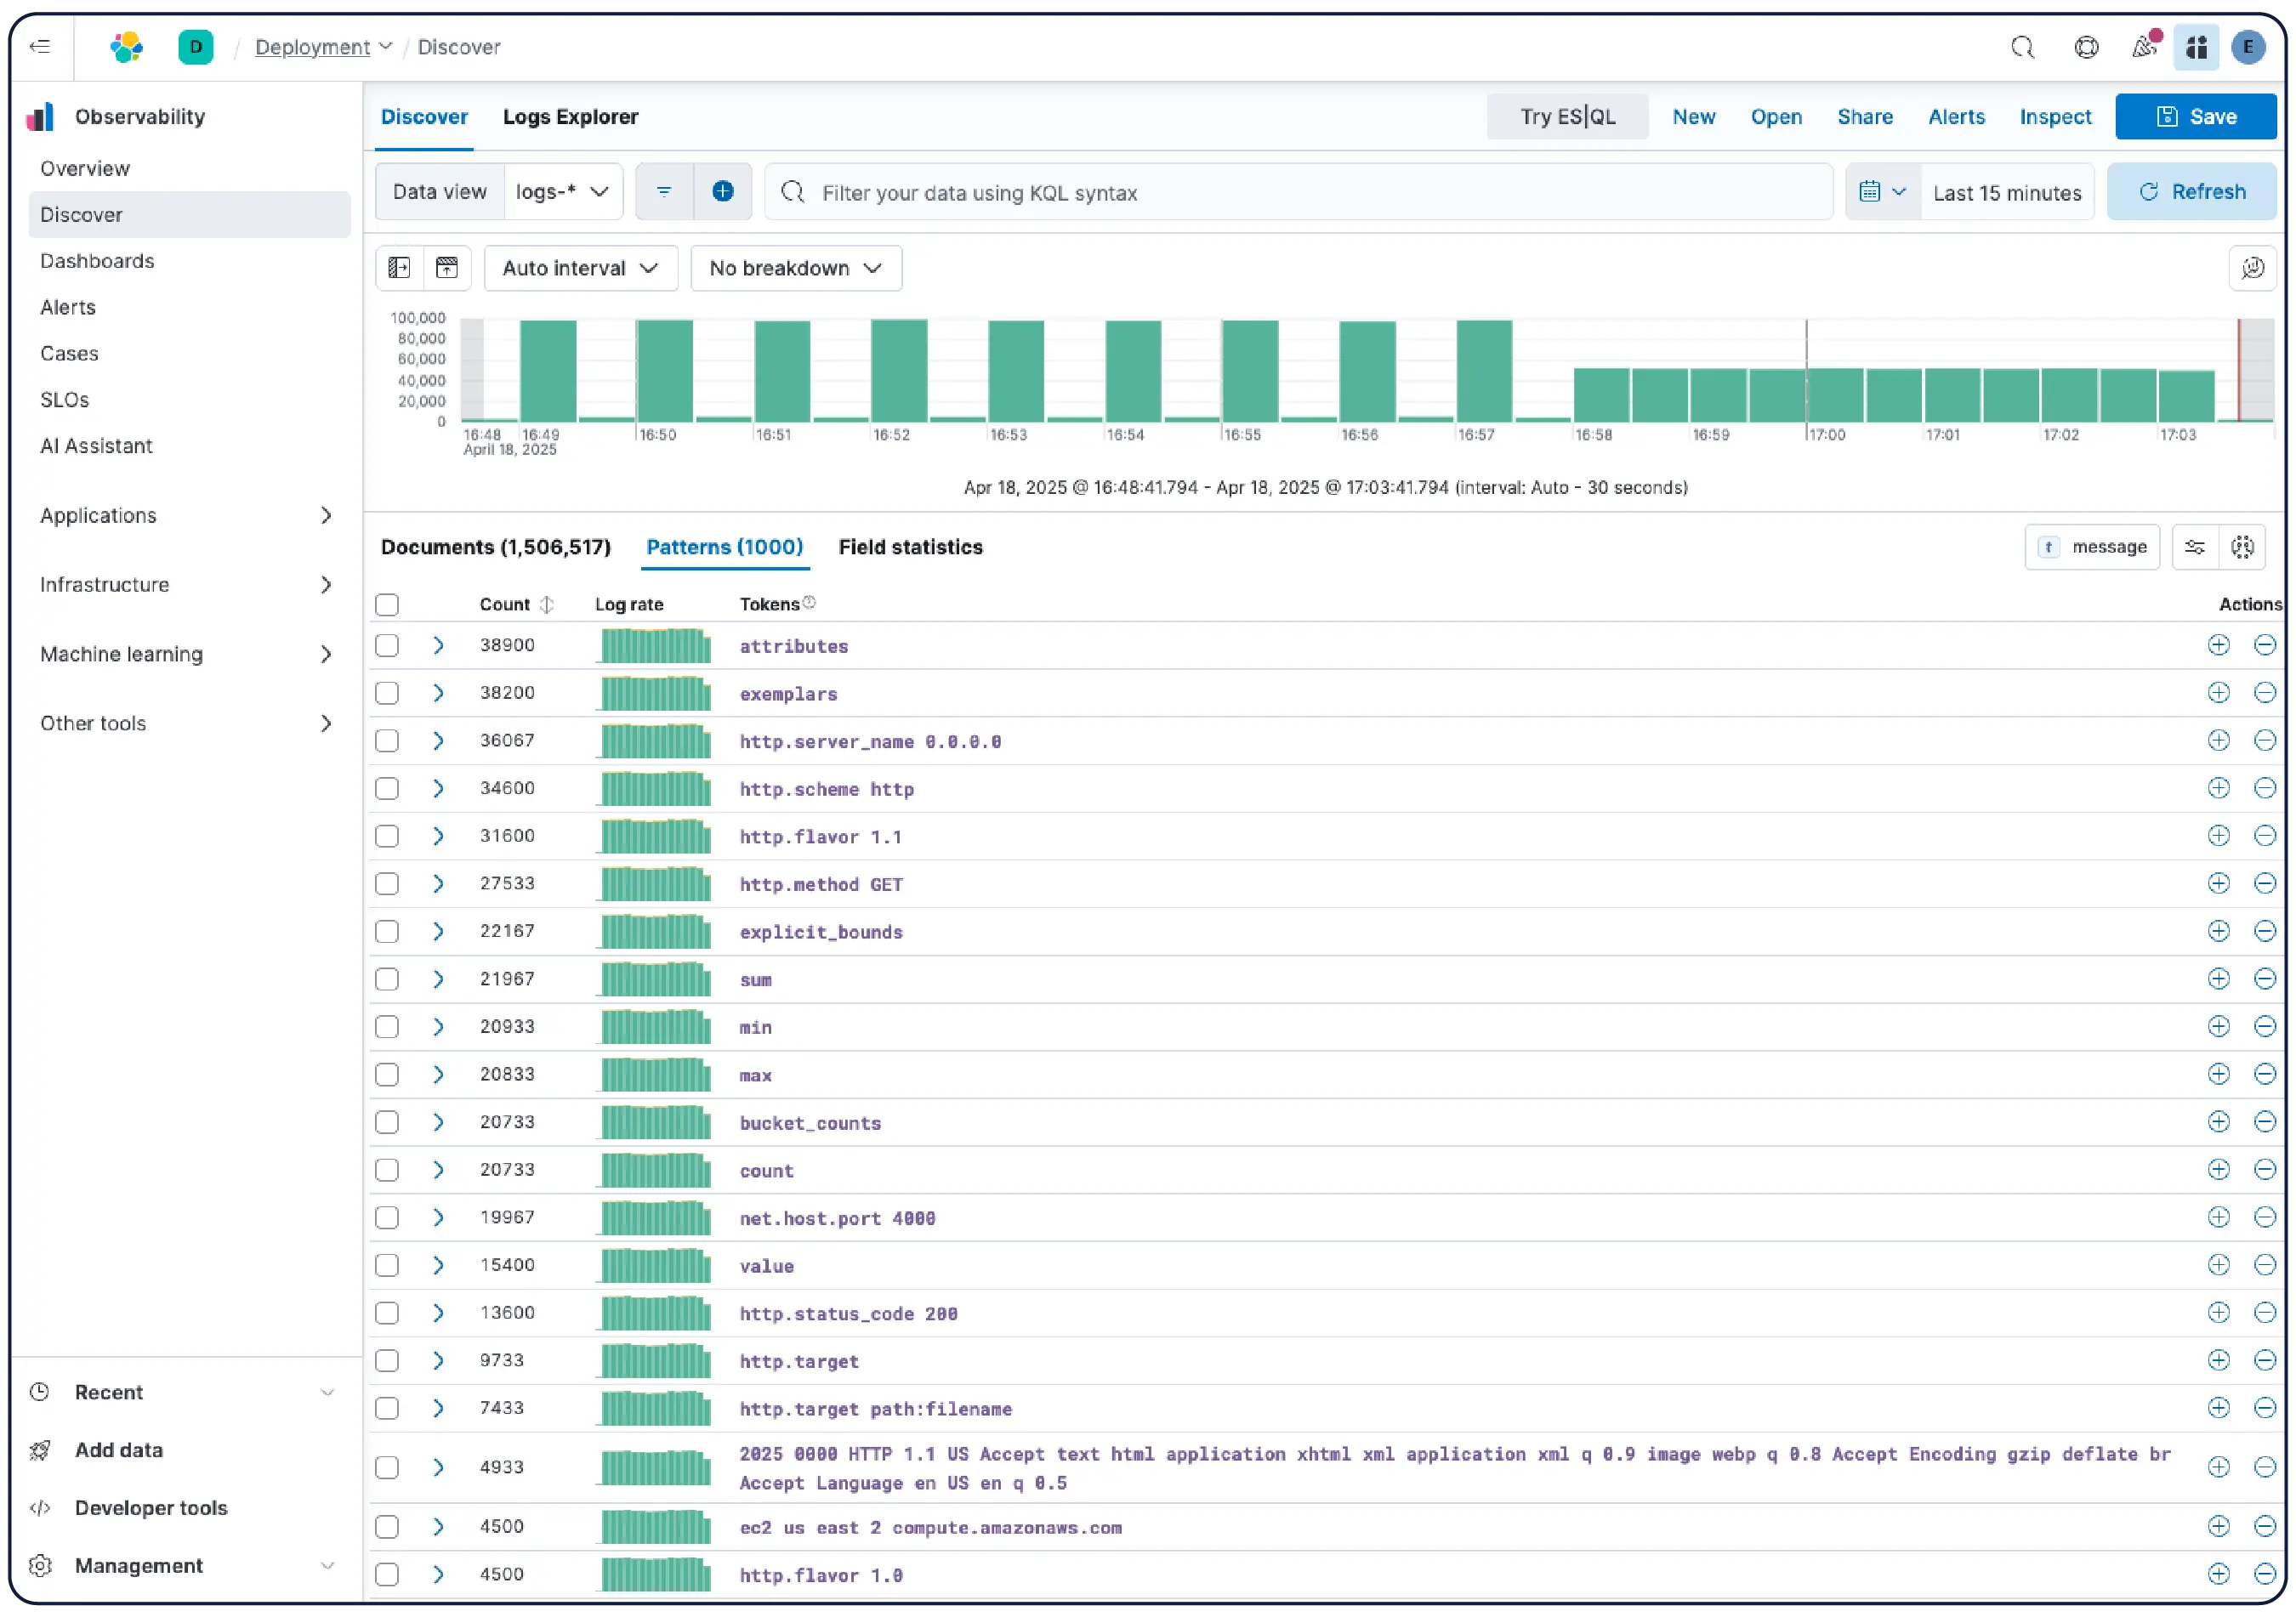
From data to answers. No digging required.
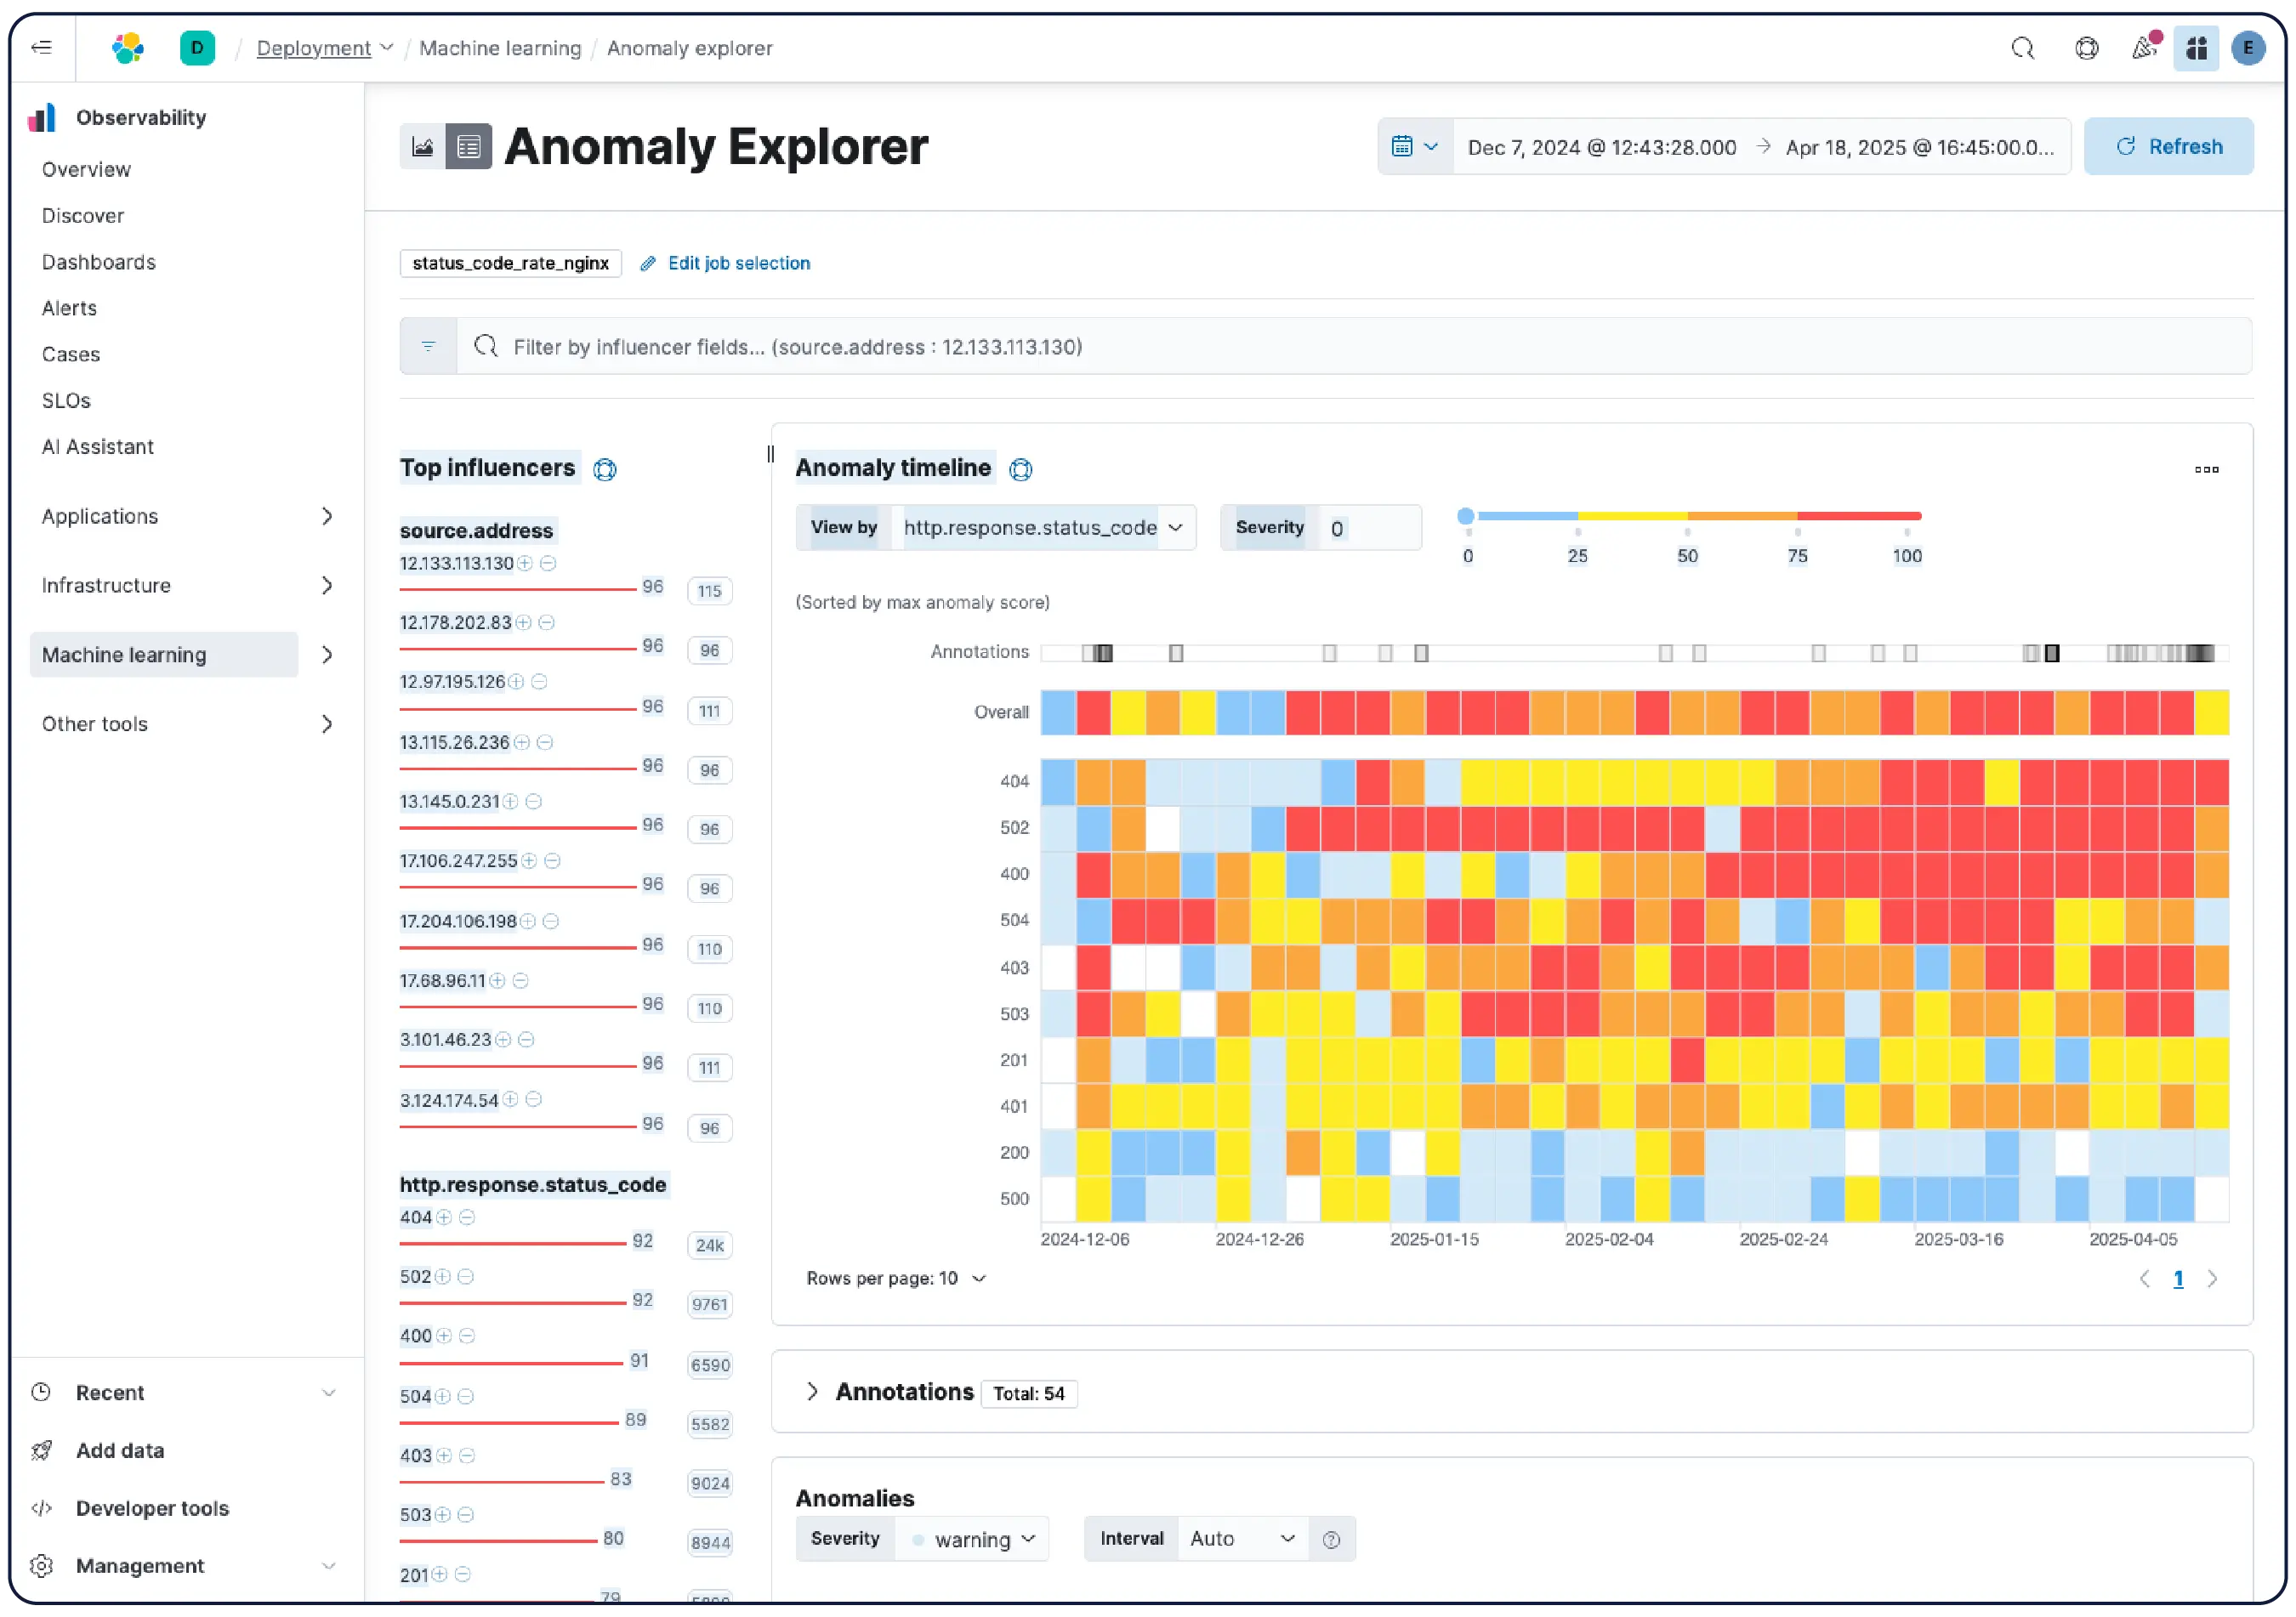
Fixing incidents is one thing. Preventing them is another. Teams need real-time analytics, anomaly detection, and efficient telemetry storage in one place. Elastic brings it all together.
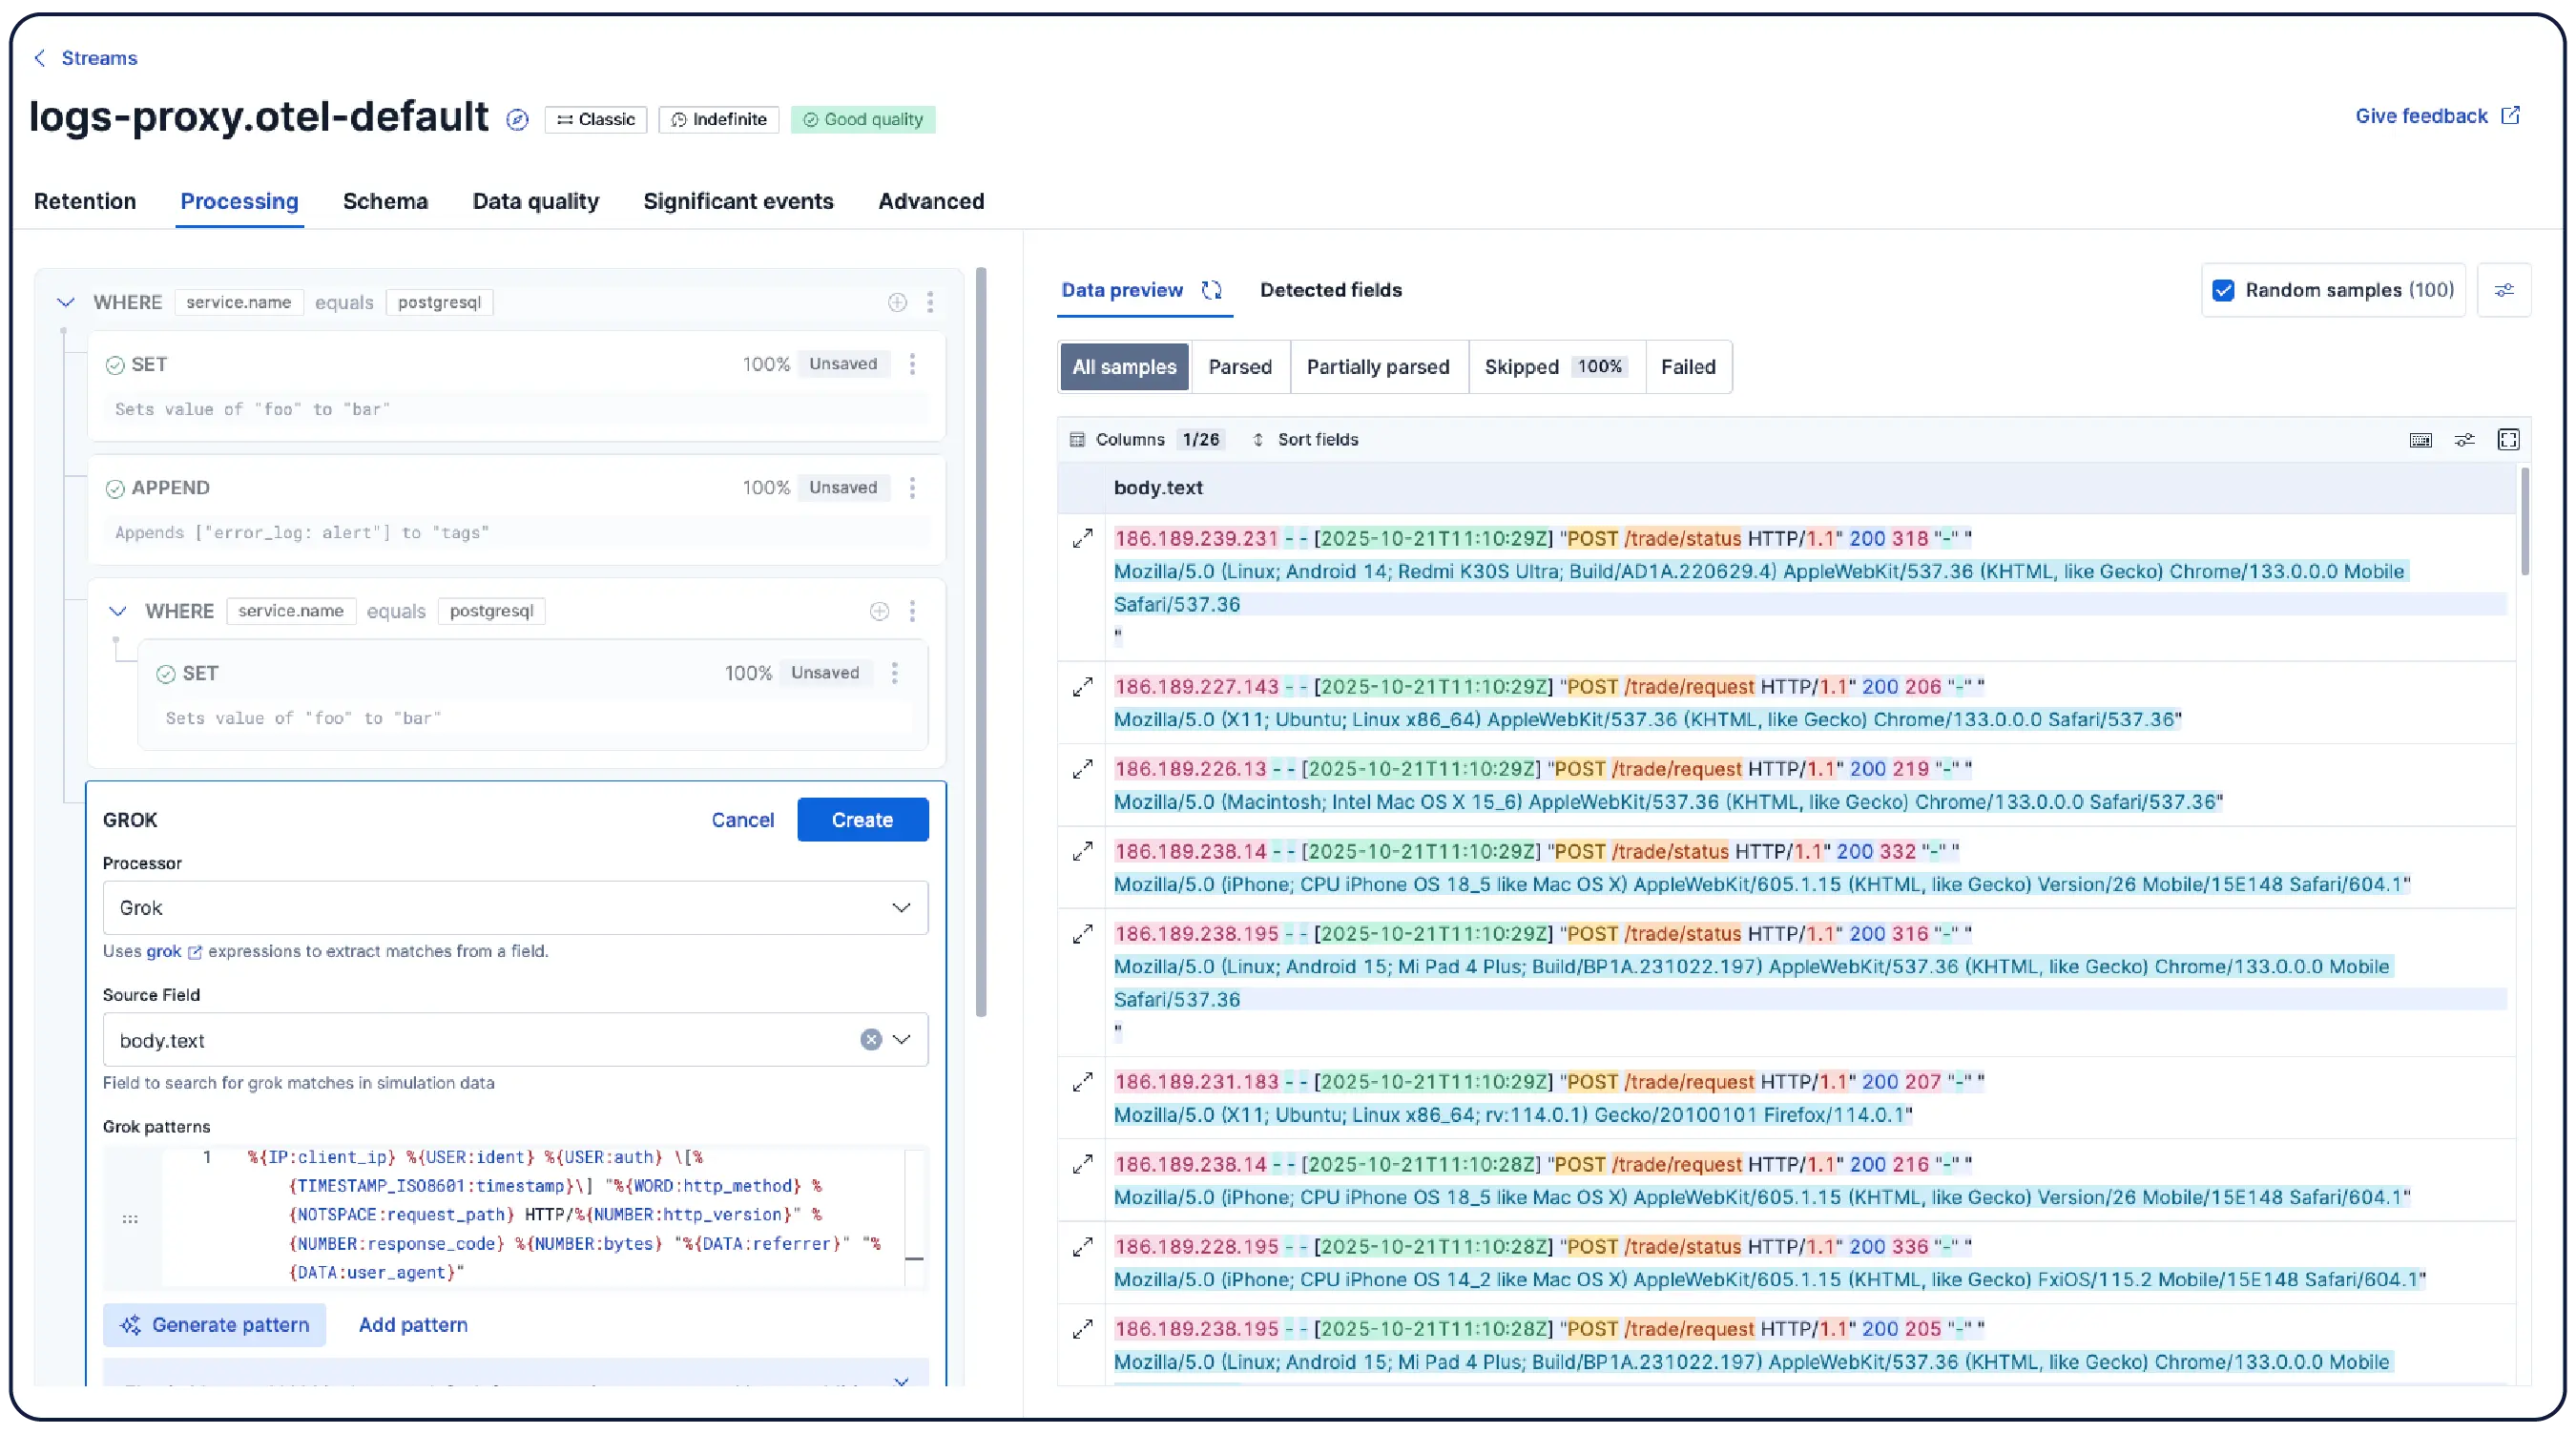
Automatically organize data into logical streams, applying parsing, partitioning, field extraction, and lifecycle policies with minimal manual setup. Significant Events automatically highlights "features" to watch.
Scale and save


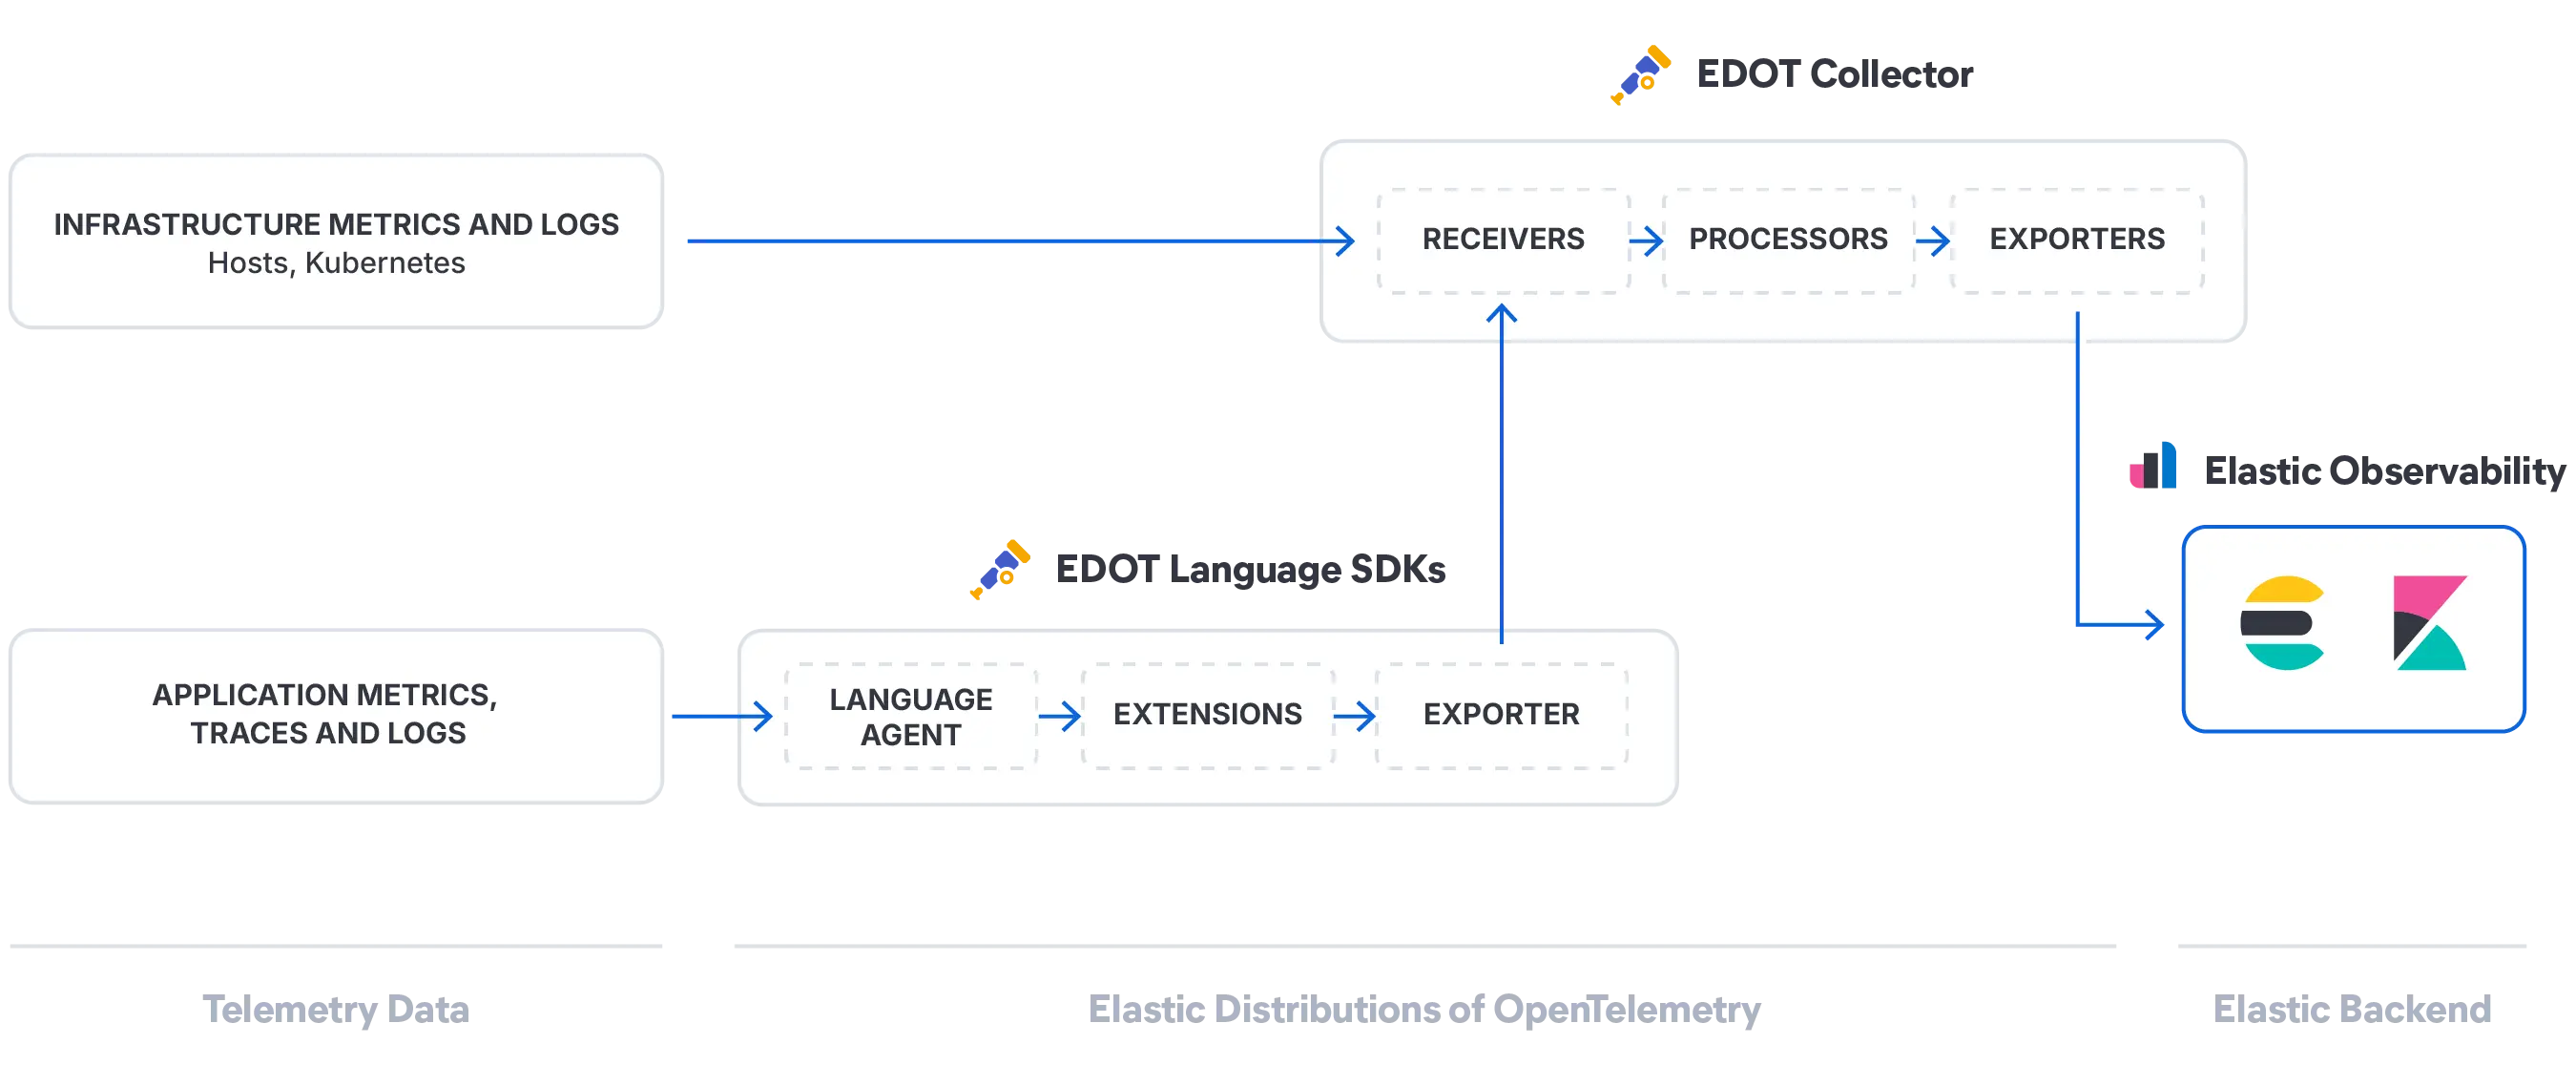
Open source. AI powered. Limitless.
A high quality neighborhood
Teams thrive and scale with end-to-end observability.
Customer spotlight
Wells Fargo observes through a single pane of glass — including metrics, events, logs, application traces, and extensions to minimize the log fields ingested by 60%.
Customer spotlight

Comcast transforms customer experiences by providing a more strategic, partnership-based approach.
Customer spotlight

Equinox boosts its cloud infrastructure health with Elastic Observability and reduces observability operational expenditure by 80%.
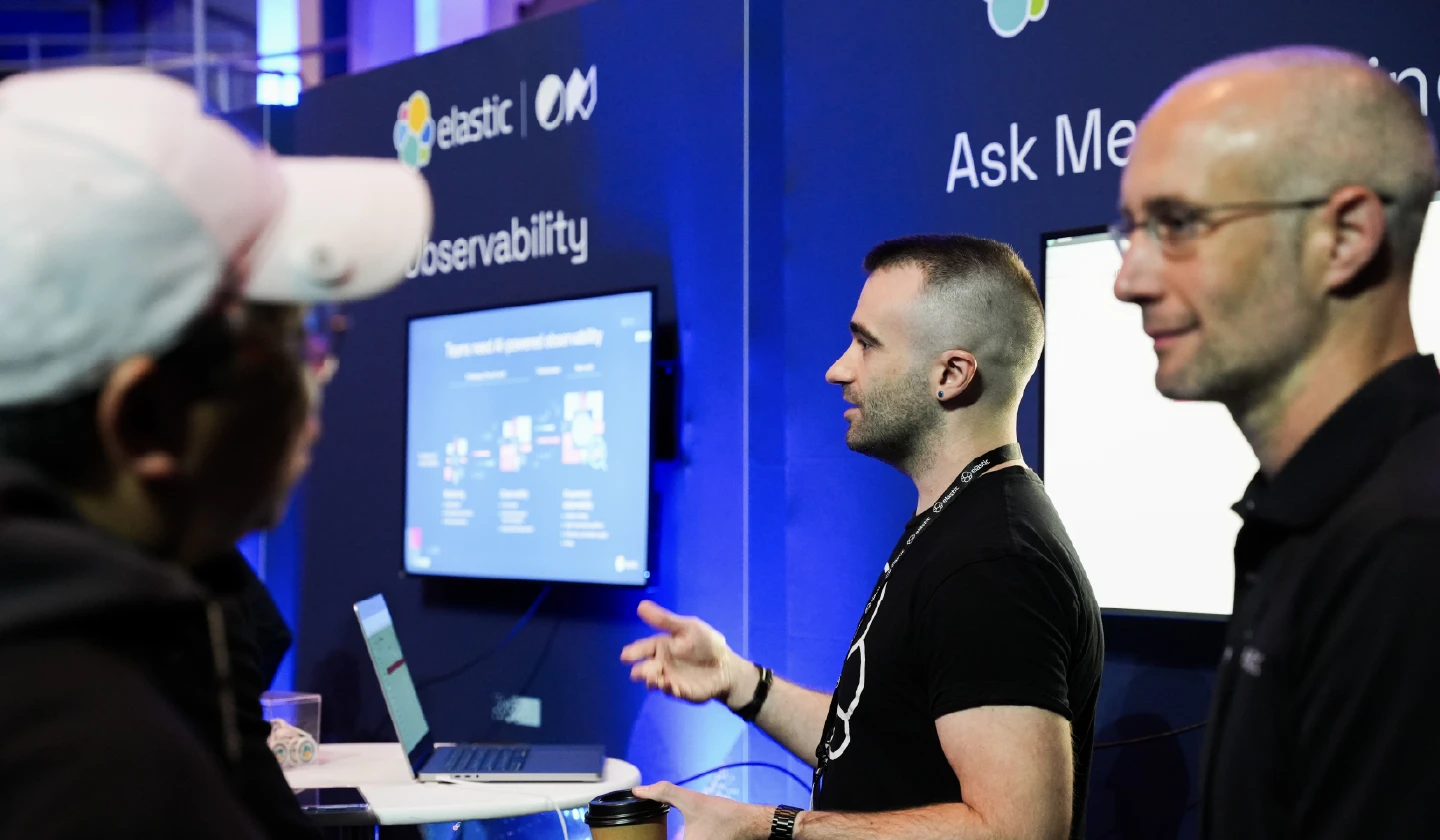
Join the chat
Connect to Elastic's global community and participate in open conversations and collaboration.


.jpg)
Frequently asked questions
Full-stack observability refers to the ability of an observability solution to monitor the entire application stack — from the end user to the application code and infrastructure. A full-stack observability solution typically consists of several capabilities, including, log monitoring and analytics, cloud and infrastructure monitoring, application performance monitoring, digital experience monitoring, continuous profiling, and AIOps. Take our self-assessment to understand how you stack up on your maturity journey toward a unified full-stack observability platform, so you can analyze telemetry holistically and achieve faster mean time to resolution.
Full-stack observability enables organizations to achieve business and operational excellence. By implementing full-stack observability, SRE teams break down silos and can proactively detect and resolve issues faster with contextual alerts and effective cross-functional collaboration. Businesses can deliver on SLAs and improve time to market, operational efficiency, and customer satisfaction. Learn more about the benefits of full-stack observability.
Businesses everywhere are facing a challenging environment: increased cost pressures coupled with high volumes of data generated by complex, distributed, cloud-native environments. As a result, teams need smarter analytics, with data access and retention across all their data — instantly and from anywhere — in order to resolve issues, make decisions, and ensure resiliency. Many companies that have adopted Splunk Enterprise have a choice to make, since Splunk offers fragmented observability with Splunk Enterprise, Splunk Cloud, and Splunk Observability with different pricing models. By contrast, Elastic offers a fast, simple solution that positions companies for the future.
Observability can be thought of as the evolution of monitoring for modern applications. Fundamentally, it is the ability of applications and infrastructure to expose their internal state through actionable logs, published metrics, and distributed traces. As an approach, observability is better suited than traditional monitoring to manage the complexity and scale of cloud-native environments through the collection, transformation, correlation, analysis, and visualization of these signals. Observability continues to evolve with new trends and technologies.
When implementing observability, think in terms of technical and operational readiness. Make sure you have the people and processes in place to support an observability function. Determine the data you want to collect initially. If you are just starting out, we recommend beginning with a single application as a pilot and focusing on one type of signal (e.g., logs) before moving on to metrics and traces. Plan for the future by choosing an observability solution that can grow with you. Ready to begin? See how Elastic’s internal SRE organization has implemented observability at scale.
Elastic's Search AI Lake is optimized for real-time, low-latency applications, making it an ideal architecture for your AI-driven future. It revolutionizes data lakes by bringing together the expansive storage capacity of a data lake with low-latency querying and the powerful search and AI relevance capabilities of Elasticsearch. Search AI Lake powers a new Elastic Cloud serverless deployment — removing all operational overhead so your teams can start innovating.