About cookies on this site Our websites require some cookies to function properly (required). In addition, other cookies may be used with your consent to analyze site usage, improve the user experience and for advertising. For more information, please review your options. By visiting our website, you agree to our processing of information as described in IBM’sprivacy statement. To provide a smooth navigation, your cookie preferences will be shared across the IBM web domains listed here.
Article
Observability, insights, and automation
Use the practice of observability to simplify and automate large parts of the incident management process
On this page
Observability is the extent to which operations teams can understand the internal state or condition of a complex system based only on knowledge of its external outputs. So, a highly observable system (an application or service) is one that externalizes sufficient data to be able to understand how the application or service is executing and its current state.
Because developers are increasingly responsible for more of the application lifecycle thanks to modern DevOps best practices, teams must instrument their systems to be highly observable.
The self-instrumentation approach does, however, have limitations. Self-instrumentation works well for new projects, but for existing deployments and solutions, your instrumentation needs to be retrofitted to potentially very old codebases. Also, teams can only use self-instrumentation for deployments that they own and have source code access to, which means that it can be difficult or impossible to instrument dependencies or third-party packages. Additionally, for external services, such as databases, teams become reliant on the providers of those external services to make their services observable.
IBM Observability with Instana, a software observability platform, solves this problem by providing auto-instrumentation of various programming languages and runtimes, including Java and .NET, which means that teams always have rich observability for their deployments while also providing configuration and code SDKs to add additional data. Instana supports open source instrumentation, such as the open source data collection project OpenTelemetry, allowing development teams to define the observability they need for their applications. Instana also supports over 260 additional third-party technologies and services, providing end-to-end observability from mobile to mainframe and across a wide range of technologies.
This rich set of observability data allows Instana to be a key data source and integration point for both Cloud Pak for AIOps and for Turbonomic. For Cloud Pak for AIOps it provides a real time topology that Cloud Pak for AIOps combines with other topology data sources to give the operations team a holistic view across their entire ecosystem. This AIOps solution is also a key source of both metrics and events, which completes the issue resolution journey from observability, to understanding the issue in context, and finally to automating a solution.
The three pillars of observability
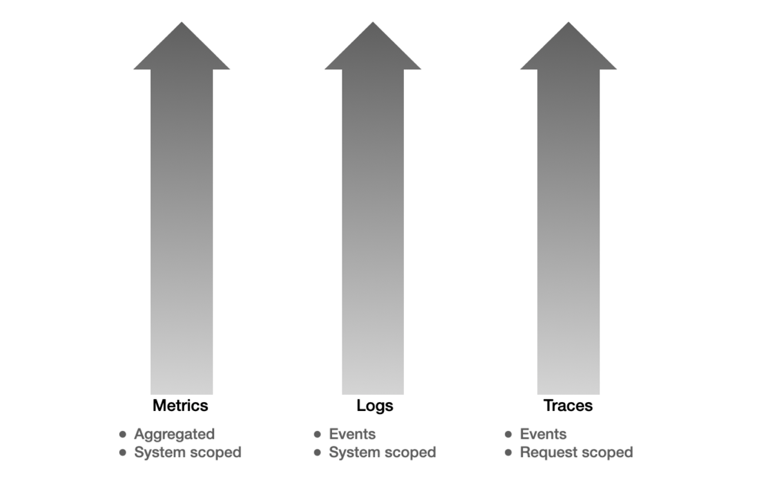
Metrics, logs, and distributed traces are often referred to as the three pillars of observability. Each pillar provides a different type of external output for a system:
- Metrics provide a continuous point-in-time view of the system.
- Logs provide a view of events and errors occurring in the system.
- Traces provide a per-request or per-transaction view of the system.
Multiple open source projects provide implementations of the pillars, largely with each project aligned with one of the pillars — for example, Prometheus for metrics, OpenTracing for tracing and the Elasticsearch-Logstash-Kibana stack for logging. Those projects are often combined, and multiple groups like the observability teams at Twitter and Netflix have described how they provide observability of their systems using these pillars and open source projects.
These three pillars of observability provide vital sources of data or telemetry for the system and for individual requests being handled by the system. However, there are many types of data that can also be invaluable in understanding the internal state of a system, such as end-user monitoring, which extends observability to provide data on the activity that is taking place on front-end clients, such as web or mobile applications, and how those applications are interacting with back-end services and IT systems, and profiling, which provides deep code-level data that shows a continuous point-in-time view of the execution of the system, which can be used to provide understanding of the resource usage of a system (both of which are provided by Instana).
To provide a highly observable system, you need to have correlation across each of the pillars of telemetry, such that the data can be used in context. While the term “pillars” implies that they are siloed, there is significant value in having correlation and context between metrics, traces, and logs —- for example, being able to understand the metrics or logs that occur inside the scope of a specific request or being able to aggregate and roll up multiple requests to generate metrics.

The value of the pillars is limited if the data is collected by separate technologies and viewed in different dashboards. All telemetry must be correlated, aggregated, and viewed together to have a highly observable system. Additionally, any given component in an IT system is affected by the other components and systems around it, so the telemetry needs to be viewed in the context of its wider environment.
The observability pyramid
Any IT system, component, or application has a complex web of other systems, components, and applications that it is dependent on, making it impossible to understand a specific system, component, or application without also understanding its dependencies and the holistic environment that surrounds it. Additionally, different roles in any organization require different views of the overall system.
These views generally form at one of the four layers of the observability pyramid, with each layer of primary interest to different personas. To understand a specific layer requires understanding the context of the system and the environment as a whole.
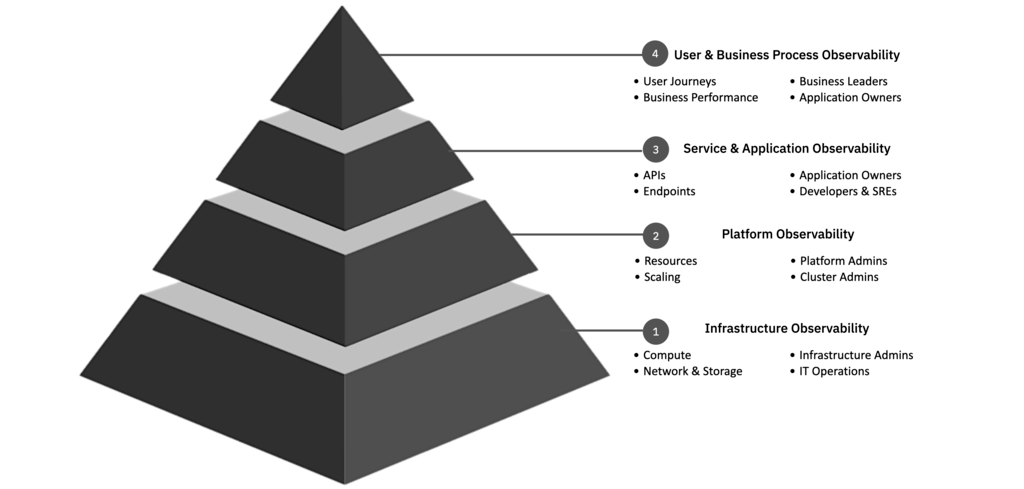
For example, if an IT infrastructure administrator wanted to understand the resource usage of the infrastructure, they would need to be able to understand the platforms the infrastructure supports, along with all the processes deployed onto the platforms, the services and applications on which those processes run, and, ultimately, the business processes those services and applications support.
Similarly, if the SRE for a microservice wanted to understand the slow performance of a REST request, they would need to understand the resources like CPU and memory available to the microservice’s process, which is affected by the CPU and memory provided by the platform and infrastructure, and which then might be affected by the other processes competing for CPU and memory that are on the same platform or infrastructure.
Observability platforms like Instana and Application Resource Management (ARM) tools like Turbonomic provide the required context by creating and maintaining a dynamic graph — an always up-to-date graph of the relationship and dependencies between the layers of the observability pyramid.
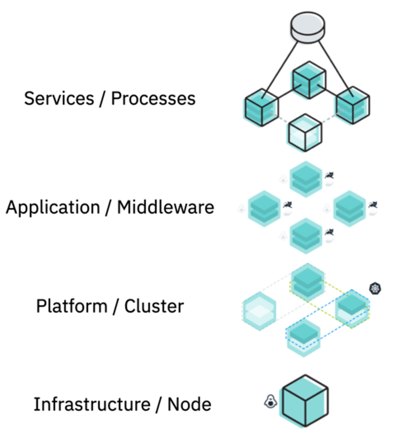
This dynamic graph maintains a constant understanding of the vertical relationship between a business application or process, the replicas or instances of an application on which it executes, where those replicas are deployed, and the underlying infrastructure on which it executes. The dynamic graph also understands and maintains the horizontal relationships between any given replica or instance of an application and its upstream and downstream dependencies, such as the other IT systems or components that make requests or calls of it or that it makes requests to.
IT systems can be observed not just with a rich set of data but also in the context of its wider environment. This contextualization becomes even more valuable when we move from observing a system to analyzing it, deriving insights from it, and being able to understand the root cause of such issues as errors, poor performance, or availability.
Analysis and insights
A rich set of telemetry that is fully contextualized achieves the goal of observability, making it possible to understand the internal state of a system. However, working with the volume of data and the rich information that the highly observable system provides leads to cognitive overload for the individuals and operators observing the system. They receive more information than they can comfortably handle, leading to an inability to process and comprehend the data and make appropriate decisions based on it.
The complex dashboards with large numbers of graphs, charts, and metrics aren’t enough to help the operators. To make the volume of data manageable, it needs to be distilled down to a set of meaningful indicators that operators observing the system can focus on. These typically take two forms: signals and events (or alerts).
The four golden signals
The four golden signals are the most valuable metrics for any service that exposes an interface, whether that interface is used by other services or by end users. The four golden signals are:
- Latency -- How long it takes to handle or service a request against the interface
- Calls or traffic -- Volume of traffic against the interface, such as requests per second
- Errors -- Rate at which requests against the interface result in an error
- Saturation -- Current utilization of the service, typically as a percentage of its total capacity
Instana supports the golden signals and pulls the first three of these, the user-facing signals, and presents them as the primary view for each service or configured application, making it easy to see and understand the quality of service being provided to the clients of the service or application. Instana also provides the information for saturation as a measure of resource allocation and utilization of the services.
By using the four golden signals, observability platforms like Instana reduce the amount of data an operator needs to focus on and simplifies the view, but they do not necessarily summarize the entire state of the system. Additionally, they still require the constant attention of an operator to determine whether one of the signals is highlighting a problem or projecting that a problem may soon occur.
Here, automated analysis uses the rich, contextualized data to generate insights that can be raised to the operator, notifying them of conditions and ultimately enabling them to take action to resolve those conditions.
Analysis can be applied to generate insights for several different use cases. Most commonly, this is for incident detection and remediation: looking for problem conditions that would affect the availability, performance or correct functioning of the applications, but there are many other use cases. These use capabilities are often provided at part of observability tools and products.
Another highly valuable use case is managing resource utilization and optimizing cost. This can detect where resources are over provisioned and therefore resource and costs could be reduced, and detect where resources are under provisioned, impacting the performance of the applications. This set of capabilities are provided by Application Resource Management (ARM) tools such as Turbonomic.
Instana itself supports the incident detection use case, applying a set of conditions to the data to detect problematic conditions, enabling events to be raised, and ultimately for the operator to be alerted of events that are of high importance.
Conditions, events, and alerts
At the most basic level, conditions can be applied as a set of rules to detect situations that are potentially or definitely problematic. An example set of conditions might be to look at the available disk space on a given infrastructure host and create a “Warning”-level event when disk space is low, and a “Critical”-level event when disk space is exhausted.
Essentially, systems can use automation to watch the wide range of telemetry, reducing the cognitive load on the operator and ensuring that problematic conditions don’t get missed. Instana provides a built-in event-rules capability, which is pre-populated with a knowledge base of over 260 conditions, as well as the ability for operators to create and apply custom rules to create new events.
Instana also provides the ability to set smart alerts on the four golden signals. These alerts make it possible to either set static or dynamic thresholds for each of the signals. These look at the past history of the signal and create a dynamic threshold designed to detect anomaly or deviations from the service’s typical behavior. Additionally, Instana provides the ability to set and monitor service-level indicators (SLIs), error budgets, and service-level objectives (SLOs) on the four golden signals so that SREs can set and be alerted on their availability and performance goals.
Event storms, event grouping, and root-cause analysis
Moving to signals, conditions, and events greatly reduces the volume of data that operators must understand and interpret. However, there is often further distillation of the data required.
When a fault occurs in an IT system, the highly connected nature of the environment often means that the fault manifests in several ways, causing multiple conditions to be triggered and a storm of events to be generated.
In the scenario where there is the failure and restart of an underlying infrastructure node, conditions are likely to be triggered not just for the underlying node but also for every process running on it and every instance of every service that those processes provide. Conditions are also likely to be triggered for any upstream service that makes calls to the affected services. This means that a large number of events can be generated in a short period of time with a single event representing the origin of the fault and the others generated by effects of that original fault.
When these event storms occur, it’s vital to be able to group together events that relate to the same underlying fault and to identify which event and fault is the root cause versus those that are downstream effects.
Instana can group related events together and carry out root-cause analysis using its dynamic graph to include related events and build a timeline to understand the underlying root cause. And in cases, where not the entire estate is being observed, Instana can integrate with Cloud Pak for AIOps. Cloud Pak for AIOps can combine data from across the estate into a single view. As noted above, this again givens an opportunity for event storms to occur. Like Instana, Cloud Pak for AIOps uses the dynamic topology graph for noise reduction, and combining related events into a single incident, but given the wider range of sources it also applies additional analytics such a scope base, event co-occurrence, or seasonal patterns to further reduce the noise to the operations team. And of course, like Instana, Cloud Pak for AIOps will apply root-cause analytics which it then augments with recommended solutions and automations.
Alert channels
This use of conditions, events, grouping, and root-cause analysis means that operators can be alerted when there are issues that require their attention and with the information on where they need to focus their attention. Those alerts need to surface in a way that notifies the operator so that they don’t need to spend their time watching dashboards for events to surface. Instana supports propagating alerts and events to a range of systems that can be used to:
- Notify the operator by using systems like Slack, Microsoft Teams, Google Chat, or a notification system like PagerDuty
- Integrate with incident-management systems such as IBM Netcool Operations Insights
- Carry out further analysis and trigger automated handling of the alert, such as AI-based automated IT operations solutions like IBM Cloud Pak for AIOps.
The practice of automation
Automation can remove repeatable and potentially mundane tasks from the day-to-day work of an application developer and infrastructure operator. In reality, automation stretches beyond this basic capability, and in this article we’ll explore the value of a systematic approach to automation and what it provides to more than just a single IT operator.
It’s important to understand that the goal of automation is less about removing the need for human experience as it is to codify and automate that experience. Automation increases the consistency and speed of operations which helps to reduce unnecessary time, costs, and risk.
Automation for one = Automation for all
Automation of any process has a primary benefactor. The single person that automates one of their tasks that they are doing on a regular or semi-regular basis will gain immediately from the benefits of bringing automation to that process. However, automating a task for a single person on a team of 10, for example, really means that we are automating that task for all 10 people.
Automation = Consistency
Time is paid back in another way by automation. Not only do you get the initial time back for removing the manual process or task, but you also remove the variances on the process that result in unaccounted technical debt that is incurred as results from the process also vary.
An automated system will produce the same results because the input, the process automation, and the output are consistent. Variances within that are only caused by the change in input or output. Human interaction means that there is a consistent opportunity for variance throughout the process. If the input is fixed and the process is potentially variable, the opportunity for failure and downstream technical debt is high.
When mundane processes are automated, we can move our focus to measuring the consistency of the input. As we discover the measurable variances on the input into an automated process, we can simply adjust the process to handle the variances.
The DevOps movement uses these principles which come from the Theory of Constraints. By isolating bottlenecks in the overall process and automating throughout the system, the overall system increases in velocity and consistency of output.
Automation = Audit-Friendly
All tasks on a team need to be able to be audited to correlate the tasks with events, outages, performance changes, and other important criteria. The ideal situation that we want is to tie the automation into some other system which is logging, auditing, or measuring the changes and processes to ensure that we can track and correlate changes.
There are a lot of ways to handle the centralization of audible event handling and process handling. Using a systematic approach to automation means that the focus moves from the process to the auditing system. Each step within the process can generate logs and events to a central repository such as ServiceNow or Graylog to make it more robust for troubleshooting and observability. Systems that feed these auditing systems further the consistency, too. When you deal with IT audits, you really need to be able to point to a system of record to ensure an audit-friendly process. Happy auditors means a happy CIO and CISO.
OODA loop = trustworthy automation
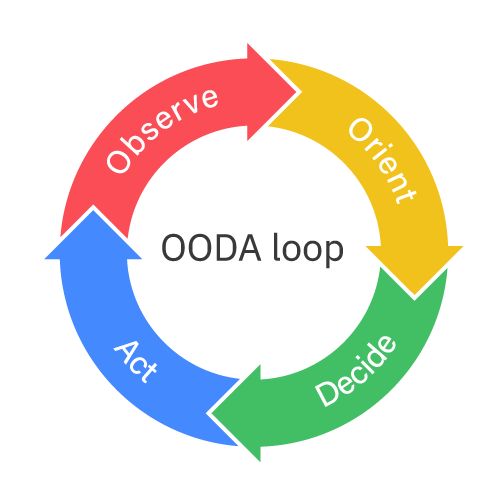
The OODA loop is the cycle known as Observe – Orient – Decide – Act. The OODA loop illustrates the flow necessary to move from observability to decision automation and then to actionable automation. Most importantly, it moves you to trustworthy automation.
Technologists and organizations have built operational and development practices on the progression from monitoring through observability. The practice of automation begins at taking the insights and signals that come through observability and systematic analysis into decision analysis.
Having observability data, like that from using Instana, can now be used to make decisions. This may have been manual processes at one point, but now we have consistent trustworthy data that can drive decision systems, like Turbonomic. Those decision systems can be driven by simple rules, algorithms, or by AI, which provide automation of the cognitive decision-making processes.
Decision analysis, or the Decide phase of the OODA loop, provides data-driven, systematic decisions that are infused with policy and procedural guardrails which can now be taken into the fourth phase which is Action. Only system-level understanding of the relationships between entities can produce actions and automation that can be trusted.
The Action phase is far beyond robotic process automation and simplified task automation. This is a system-level of automation and actionability that continues back to the OODA loop and then observes the behavioral change for continued, systematic observation and automation.
An example of a working OODA loop can be seen in practice through integrations of observability engines (such as Instana) and automated decision engines (such as Turbonomic or IBM Cloud Pak for AIOps) which can continuously gather data, act on that data, and then the new state of the environment is where we orient for the next iteration of the loop.
Observability and insights meet automation
Having comprehensive observability for IT systems and having an observability layer that can automatically detect and identify faults in near real time, especially when they impact external interfaces and users, is becoming increasingly important to enterprises. However, detection and identification only represent the first part of the incident-resolution process.
Application developers and operations teams also need to diagnose the issues in order to understand why the component that was the root cause of the incident developed a fault, to repair the diagnosed fault to restore service, and to resolve the underlying issue to ensure that the same fault does not occur again. These tasks are often lengthy. To dramatically shorten those additional steps requires acceleration of the IT service management process, which can be provided by an AIOps platform like IBM Cloud Pak for AIOps.
IBM Cloud Pak for AIOps can take the alert generated by Instana and launch collaborative engagement across the various parties involved in resolving IT incidents, including SREs, IT operations, DevOps, and developers using ChatOps. Based on machine learning and AI capabilities, Cloud Pak for AIOps can also recommend best actions to the engaged team, including executing runbooks to carry out diagnostics and analysis, and to repair and restore the affected components, drastically shortening the overall incident-resolution process.
Conclusion
Being able to vastly reduce the elapsed time of the IT service management incident process – and, therefore, client impact -- requires comprehensive observability. With comprehensive observability, operations teams can:
- Understand the underlying state of the systems
- Perform analyses and discover insights to detect faults and isolate them to root causes
- Provide automation to rapidly carry out diagnoses and repair
The practice of automation builds on top of the practice of observability and moves SREs and application developers from observability, to actionable insights, to outright automation.
The combination of Instana, Turbonomic, and IBM Cloud Pak for AIOps provides that end-to-end set of capabilities inherent in an AIOps platform, making it possible to automate large parts of the incident-management process, reducing costs, and improving uptime and availability for your deployments.
Also, for an in-depth review of the Instana solution components, check out this article, "Real-time monitoring of microservices and cloud-native applications using IBM Instana SaaS."