About cookies on this site Our websites require some cookies to function properly (required). In addition, other cookies may be used with your consent to analyze site usage, improve the user experience and for advertising. For more information, please review your options. By visiting our website, you agree to our processing of information as described in IBM’sprivacy statement. To provide a smooth navigation, your cookie preferences will be shared across the IBM web domains listed here.
Article
Understanding causal AI-based Root Cause Identification (RCI) in IBM Instana
A technical deep dive into the RCI feature in Instana
On this page
Modern applications are increasingly built as vast, intricate, distributed systems. These systems comprise various software modules, often developed by different teams using different programming languages and deployed across hundreds to thousands of machines, sometimes spanning multiple data centers. Given their scale and complexity, these applications are often designed to tolerate failures and performance issues through built-in failure recovery techniques (for example, hardware or software redundancy) or external methods (for example, health check-based restarts). Computer systems experience frequent failures despite every effort: performance degradations and violations of reliability and key performance indicators (KPIs) are inevitable. Depending on their nature, these failures can lead to catastrophic incidents impacting critical systems and customers. swift and accurate root cause identification is thus essential to avert significant incidents impacting both service quality and end users.
In this complex landscape, observability platforms that provide deep insights into system behavior and help identify performance bottlenecks are not just helpful, they are essential for maintaining reliability, ensuring optimal performance, and quickly resolving issues in production. The ability to reason about these systems in real time is critical to ensuring the scalability and stability of modern services.
To aid in these investigations, observability platforms that collect various telemetry data to inform about application behavior and its underlying infrastructure are getting popular. Examples of such platforms include IBM Instana, Dynatrace, Datadog, AppDynamics, New Relic, Grafana Labs, and several others. In addition to providing rich telemetry data, including traces, metrics, and logs, most of the available application performance monitoring (APM) tools purport to determine the root causes of system issues and pinpoint them to the Site Reliability Engineers (SREs).
IBM Instana uniquely stands out compared to other APM tools in using causal AI to surface the root causes of the system problems to the SREs in near real-time. Instana’s Root Cause Identification (RCI) algorithm honors the adage: ‘correlation is not causation’ by focusing on ‘causation’ and not ‘correlation.’ For an overview of the RCI feature, review the Instana documentation.
In this article, we highlight the practical value of Instana’s causal AI-based RCI methods by citing real-life examples and putting Instana’s RCI within the broader context of available monitoring and observability tools.
Instana's AI-infused RCI algorithm is currently in the Public Preview phase. Users can provide feedback regarding its accuracy and helpfulness The Instana team uses the feedback to improve the algorithm. IBM intends to make the AI-infused RCI generally available in early 2025.
Examples why SREs need more than distributed tracing
Distributed tracing is widely believed to be sufficient to identify the root cause of most issues. While tracing is invaluable, in the following examples, we illustrate why distributed tracing by itself might be inadequate for determining root causes in complex production environments and can lead to spurious or incomplete conclusions about the root cause of failures. Tools incorporating additional causal inference, such as IBM Instana’s RCI engine, help SREs quickly distinguish between true root causes and symptomatic side effects in large-scale distributed environments.
Example 1: Misattribution from connection pool exhaustion
Consider this scenario (see Figure 1): A user issues an HTTP request to an application server (denoted appserver), which is a WebSphere-based service. The appserver then attempts to create a new database connection to mydb2, a DB2 instance. However, the trace reveals a failure indicating that mydb2 could not allocate a connection.
Figure 1. Trace of a failed request from appserver to mydb2.
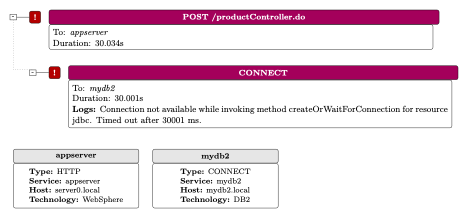
A cursory interpretation of this trace might lead SREs to conclude that mydb2 is at fault and ought to be scaled or reconfigured to accommodate additional connections. The logs of mydb2 clearly indicated that the connections were exhausted.
Upon closer inspection, it turns out that mydb2 was correctly configured for 70 active connections, but those connections were exhausted due to a deadlock condition in appserver. This deadlock triggered an uncontrolled surge of connection requests, ultimately saturating the DB2 connection pool. Consequently, the real issue lay within the application server rather than the database tier. In fact, other dependent services that also required database access began to fail in a cascading manner.
Diagnosing such deadlocks in a time-constrained, high-pressure production environment often requires deep insight and experience into both the application and the underlying infrastructure metrics (for example, CPU and memory usage or thread states).
This example also highlights a common misconception: the last node (the ‘leaf’) in a failing trace is the true root cause.
Example 2: Ambiguity in service-level vs. replica-level failures
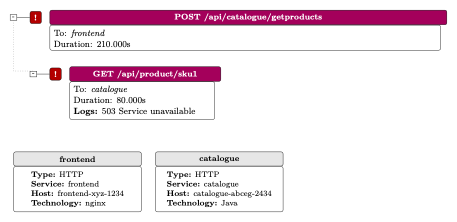
Consider this scenario (see Figure 2): A failing trace in which a frontend service interacts with the catalogue service via the endpoint /api/product/sku1. The trace concludes with an HTTP 503 “service unavailable” error.
An immediate inference might be that the catalogue service is failing outright. However, in this environment, catalogue has three replicas in production. The question arises: is the entire service (that is, its code or configuration) faulty, or is only one replica (identified in this example as catalogue-abceg-2434) exhibiting abnormally high resource consumption or other anomalies?
Figure 2. Trace of a failed request from frontend to the catalogue service.
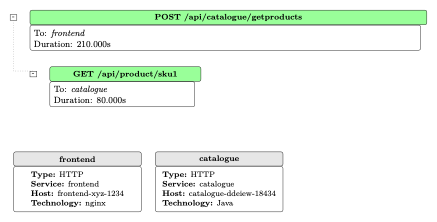
To resolve this, an SRE must look at additional traces or system metrics across all catalogue replicas. For instance, Figure 3 shows a successful trace involving the same frontend and the catalogue service but routed to a different replica (catalogue-ddeiew-18434), thereby illustrating that not all replicas are impacted. Numerous dimensions might have to be considered in large-scale distributed systems, such as different pods, containers, virtual machines, APIs, operating systems, or deployment configurations. SREs may face an inherently high-dimensional root-cause analysis problem, which is impractical to tackle manually on each occurrence of failures.
Figure 3. Trace of a successful request from frontend to the catalogue service.
Root cause identification techniques in Instana
A central challenge in modern, large-scale software systems is distinguishing true causes of failures from mere correlations. Many existing observability platforms collect abundant data (logs, metrics, traces) and then highlight coincidences in the system (for example, CPU spikes followed by a latency increase). While useful, such correlation-based methods can mislead SREs into blaming the wrong service or node, especially when cascades of errors appear in multiple places at once.
After extensive study of failure diagnosis in computers and related systems by academia and industry, we now have powerful frameworks and theoretical machinery to continue the work on accurate failure diagnosis and making computer systems more robust through proper remedial actions.
Instana’s root cause identification (RCI) engine addresses this problem with a causal perspective, showing not just “what happened” but “why.” The principle behind IBM Instana’s root cause identification uses ideas from computer system reliability, spatial and temporal differentiability, and causality.
This article provides an informal overview of Instana’s causal AI implementation without delving into mathematical details. The reader should refer to “Causal AI-based Root Cause Identification: Research to Practice at Scale,” the companion paper, for a more comprehensive treatment.
Spatial and temporal differential observability
A key ingredient in Instana’s approach is exploiting differential observability. When a fault occurs in a single component, it does not necessarily break every path through the system. By comparing which requests fail and which ones succeed across different hosts, containers, microservices, and endpoints, Instana’s engine learns each component’s contribution to an error. Two main aspects matter:
- Spatial Differentiation: Different request paths and replicas may exhibit unique failure patterns. For instance, if only one replica out of three is causing slowdowns, you see a fraction of errors specifically tied to that replica’s paths. This “who fails, who doesn’t” clue helps pinpoint the faulty replica instead of implicating the entire service.
- Temporal Differentiation: Failures do not always strike all at once; they can surface intermittently or escalate over time. Observing how different sub-systems degrade or recover throughout the timeline helps isolate whether the cause is a sudden spike in traffic, a memory leak, or a rolling deployment gone wrong.
Causal inference framework for fault localization
While differential observability tells us that not all parts of a system fail equally, merely seeing which pieces fail together still doesn’t prove root causation. Instana augments these observations with Judea Pearl’s causal inference ideas. A Pearlean framework enables structured “what-if” thinking: If we “virtually” fix the suspected component, would the rest of the system behave as observed? When the answer is yes, the probability that this component is at fault rises substantially. For an excellent overview of causality, readers can consult the Book of Why and Causal Inference in Statistics: A Primer.
Instana’s causal AI implementation uses the Pearlean framework of causal graph inference. Such causal reasoning avoids the pitfalls of pure correlation. For example, if a downstream database throws errors simply because an upstream application pool is deadlocked, Instana’s RCI pinpoints the true upstream code issue, not the database. This aligns well with real production use cases, where superficial correlations often lead engineers astray.
Causal inference provides these practical benefits:
- Clarity under complexity: In large microservices environments, faults often ripple unpredictably. By systematically leveraging which paths fail at what times, Instana provides an unambiguous, evidence-based explanation of why something fails, rather than a guess from aggregated metrics or partial anomalies.
- Reduced noise: Traditional alert storms can overwhelm operators with redundant or tangential data. Root cause identification powered by causal inference zeroes in on the “smoking gun,” dramatically cutting down unnecessary investigation steps.
- Adaptable to real systems: Spatial and temporal observability do not require perfect instrumentation or custom model training. Instana’s approach works out of the box using standard tracing and topology data, plus it gracefully falls back when certain paths or components lack sufficient visibility.
By explicitly modeling both how failures propagate and why they manifest, Instana’s RCI surpasses the limitations of correlation-based techniques. SREs and developers can fix issues faster and more confidently, relying on a grounded causal explanation rather than speculation, which provides a critical edge for the complex, ever-evolving environments that define today’s enterprise software.
How Instana implements causal AI-driven probable root cause identification
For the sake of ease of understanding, brevity, and simplicity, we will provide an overview of Instana’s implementation of root cause identification, ignoring many implementation details.
Traces
Instana automatically instruments and collects traces for all the supported technologies. A trace represents a single request and its journey through a system of services. It is a collection of operations that document the lifecycle of a request as it moves through a distributed system.
Each trace consists of one or more calls that represent communications between two services, a request and a response. Instana captures the call data both on the caller and the callee side.
The timings of code executions are called spans, which are actions with start and end times. Each operation within a trace is a span that records details like the operation name, start and end times, and contextualized metadata such as the HTTP method or status code, all added to the spans by Instana agents.
Like other distributed tracing systems, Instana’s tracing is also based on Google’s Dapper. For further details, refer to the Concepts of tracing section of the Instana documentation.
Topological graphs of dependencies
Instana also automatically creates and dynamically updates topological graphs of applications' dependencies. These graphs encompass physical components such as hosts and databases, along with logical components such as traces or services. Instana dynamically updates the states of the components.
We can logically think of two dynamic graphs:
- One graph that represents infrastructure components, as discussed in the Using the dynamic graph section of the Instana documentation
- One graph that represents application-centric components, as shown in Figure 4.
Our algorithm uses both these dynamic graphs for its analysis of fault localization. The tracing and topology data that is collected by Instana serve as the foundation for implementing the causal AI algorithm for probable root cause analysis.
In an actual implementation, Instana collects and enriches calls at regular intervals with infrastructure topologies, such as source and destination, endpoints, processes, and so on. By capturing comprehensive trace information and maintaining a dynamic, real-time view of infrastructure and application relationships, Instana provides the necessary context for understanding the interdependencies and behaviors of system components.
Causal AI algorithm
The Instana algorithm attempts to identify faulty components. However, in real life, isolating very specific faulty components is often impossible without additional measurements through special request types or SRE feedback. In such cases, our algorithm logically combines components to pinpoint faults. For example, consider a pod containing a single container running a microservice component of an application. Without other data helping to isolate components, the algorithm logically merges the pod, the container, and the corresponding process into one component for fault identification. If the process fails, the container and microservice are down, too.
The internal fault diagnosis mechanism of the previous generation of Instana, and the AI-infused Instana’s RCI analysis hinge on the dynamic directed call graph -- also known as ‘Dependencies’ in the Instana UI or simply the “dynamic graph” in Instana literature. A call graph of Instana visually displays this information:
- All the individual components of the application, along with their names as the nodes of the graph
- The connectivity between the individual components as edges
- The direction of the caller-callee request flow as the direction of the edges of the graph.
The graph is dynamic because depending on the user’s interaction with the system, the graph and the connectivity of the nodes through edges may evolve gradually:
- New directed edges can appear
- New nodes in application components can also appear, along with new directed edges connecting them with other existing or just added nodes
- Existing nodes and edges can disappear from the call graph if the corresponding paths remain dormant for a certain period.
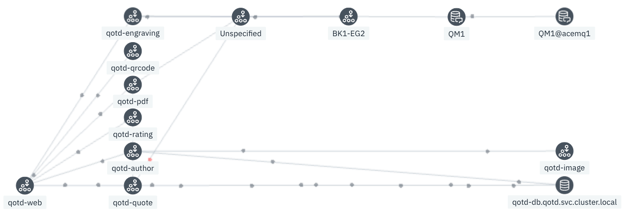
Figure 4 is a simple call graph of an application that graphically displays the components of a web application. The directed nature of the graph does not show up in a static screen capture. The Instana UI provides animation to indicate the direction of the traffic flow between components, which is the directionality of the edges between the graph’s connected nodes.
Figure 4. A call graph of an application.
The non-AI-based root cause analysis of the previous versions of Instana can start from several different places in the Instana UI:
- An Instana-generated alert, it’s triggering event, and the related events of the triggering event
- Issues noticed in one or more components in the call graph
- Directly from the events emitted from the alert-generating component of a call graph.
Regardless of the starting point, to detect the root cause, SREs typically follow standard debugging techniques: analyze calls associated with events under consideration, carefully drill down the call stack, analyze traces, and relate calls to log files, error messages, and available stack traces. Although the Instana UI provides significant help to SREs in troubleshooting, the entire process is manual, requires expertise and experience from SREs, and can be tedious, time-consuming, and error-prone.
Figure 5 shows the events related to a Triggering event corresponding to an Instana-generated Alert in an application component.
Figure 5. Related events in Instana.
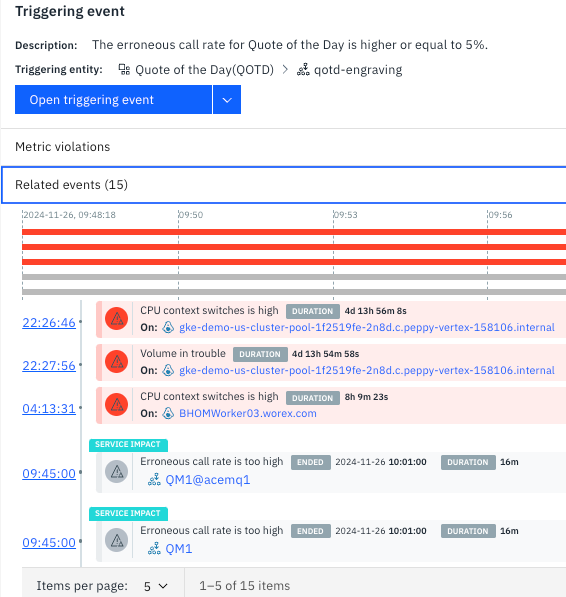
The relationship among the related events in Figure 5 is spatiotemporal. Instana essentially will correlate two events, say EventA and EventB, if they occur in connected nodes in the call graph within a specific time range of several minutes. In the formal discipline of Statistics, ‘correlation’ does not imply ‘causation,’ which means in this context that there may not be any causal relationship between two events correlated by Instana: EventA may not be the cause of EventB or vice versa. The root cause analysis using related events may yield erroneous results without a causal relationship.
Unlike the manual, time-consuming endeavor, the causal AI-infused Instana automatically identifies the root cause entities with high precision and adequate explanation in near real-time using AI on internally constructed causal graphs and other theoretically sound and well-respected formalisms – refer to “Causal AI-based Root Cause Identification: Research to Practice at Scale,” the companion paper for details.
The root cause component can be associated with any node on the call graph of Figure 4: a process, an infrastructure entity, or an endpoint of an application's component in the call graph. The RCI algorithm has a low memory footprint and does not consume significant computing resources. The powerful AI-infused RCI feature of Instana distinguishes it from other monitoring tools available in the market today.
Instana’s RCI algorithm computes and associates an internal statistical value Mi for each element Ci of the set of possible faulty components. Note that for component Ci, a lower value of the corresponding Mi indicates a higher probability of its failure. For a set of probable root cause components, the RCI algorithm also sorts the conceptual tuples < Ci, Mi> in ascending order of Mi. A component Ci is only considered for exposition in the Instana probable root cause GUI, if it’s associated Mi is less than an internal threshold value MT. The top three components in the sorted list associated with the lowest M values, all less than MT, are identified as probable root causes.
The selected probable root causes, if any, are displayed in ascending order of their Mi values from left to right; the root cause component Ci associated with the lowest Mi value of the set of components under consideration occupies the leftmost position. Instana divides the Mi values associated with the possible faulty components that are less than the threshold value MT into three disjoint categories: High, Moderate, and Low, according to their failure chances – (MHigh < MModerate < MLow) < MT. For a triggering event, the RCI algorithm may identify more than one root cause whose associated M value belongs to the same category.
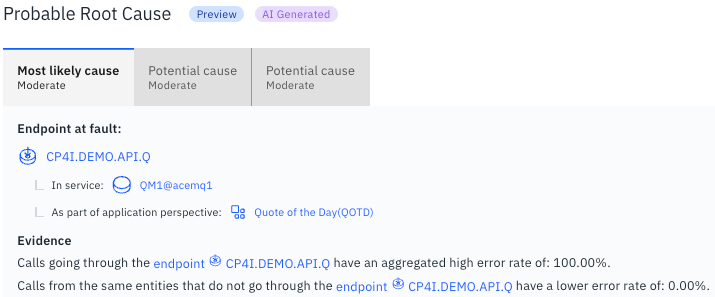
Figure 6 is a typical screen capture displaying probable root causes in the Instana GUI. Though all three M values associated with the top three probable root causes corresponding to the three tabs in Figure 6 belong to the Moderate category, based on their associated individual Mi values, the probable root causes are arranged in ascending order from left to right; the leftmost one associated with the lowest M value is explicitly labeled as ‘Most likely cause.’
Figure 6. Probable root causes.
The number of potential root causes identified by the RCI algorithm, which have associated M values less than the internal threshold, may be fewer than three. Figure 7 shows a situation where only one probable root cause is displayed. In extreme cases, no probable root cause may be displayed, implying that the algorithm failed to identify any probable root cause with a reasonable degree of certainty. This may happen for reasons like lack of detailed traces. To minimize the chance of false positives, which may negatively affect the user’s confidence, Instana does not surface any root cause if none of the associated M values of the identified root causes are less than the internal threshold MT.
Figure 7. Only one probable root cause.
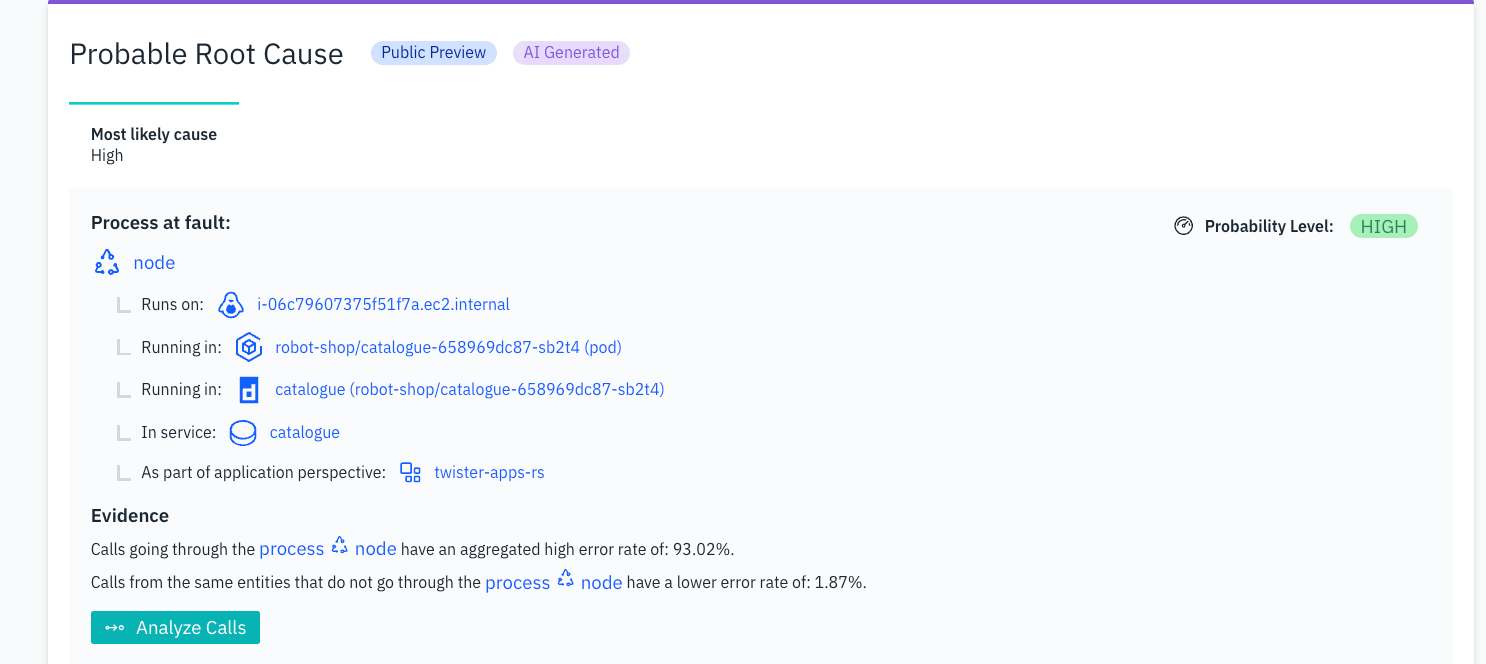
The causal AI for RCI provides explanations in the ‘Evidence’ paragraph of the corresponding root case, as shown in Figures 6 and 7. Instana also offers a detailed spatial viewpoint of the root cause component, as depicted in Figures 6 and 7.
In Figure 6, Instana gives context for the CP4I.DEMO.API.Q endpoint root cause component by detailing that it is an endpoint of service QM1@acemq1 of the Quote of the Day (QTOD) application. This context can be immensely helpful to SREs while troubleshooting and fixing faults in real life.
As another example, Figure 7 provides a detailed hierarchical spatial context for the root cause component, a Node.js process. The Node.js process in the catalogue service component of the twister-app-rs application executes in the catalogue (robot-shop/catalogue-658969dc87-sb2t4) container in the robot-shop/catalogue-658969dc87-sb2t4 pod hosted in the i-06c79---a.ec2.internal cloud virtual machine (VM). The detailed hierarchy in Figure 7 also showcases the power of RCI in pinpointing the faulty infrastructural component. In the example of Figure 7, the catalogue service is realized by three containers in three pods residing in three worker nodes hosted in three cloud VMs. The simulated fault happened in one of the containers, and Instana’s RCI algorithm accurately identified the fault-causing container, leaving the other two non-faulty ones. Note that Figure 7 displays the root cause related to the similar example discussed in Example 2 earlier in this article.
A detailed and precise root cause identification enables an SRE to quickly focus on the faulty component and take appropriate actions to resolve the issue. Corrective actions can vary based on the situation; they may involve a simple restart or a restart that requires reconfiguration or emergency code changes to the faulty component. The corrective action might necessitate a thorough analysis of diagnostic logs, events, and detailed traces related to the faulty component by the SRE before determining the necessary corrective measures.
An SRE is also expected to consult and potentially utilize AI-generated remediation actions associated with the triggering event within Instana's remediation framework. For more information, refer to the Intelligent Remediation section of the Instana documentation. Based on our study in real-life or simulated situations, we can safely conclude that the newly introduced root cause identification capability of the AI-infused Instana can reduce the Mean Time To Recovery (MTTR) by at least 80%.
Real-life experiences with Instana’s casual AI-based RCI
As mentioned earlier, the RCI feature in Instana is in Public Preview. From its initial design and implementation, the Instana RCI algorithm continued to show great promise and excelled at assisting SREs in almost all internal and external environments. Two real-life situations with severe service outages showed how the algorithm identified faulty components quickly and accurately in large, complex environments.
When the RCI algorithm was still under development, we tried it internally, involving partial service failure in a very large distributed environment. Experienced SREs followed traditional troubleshooting techniques, using the monitoring and telemetry data of the system obtained from Prometheus and Grafana. It was a very long-drawn troubleshooting process that involved several erroneous root cause identifications. It took more than twelve hours for the SREs to arrive at the actual faulty component. On the side, after the environment was stabilized, we tried the RCI algorithm using the collected traces, and it successfully pinpointed a software networking switch as the component at fault in less than five minutes. Indeed, the service was completely restored after a simple change to the configuration of the software switch.
Another example involved a severe system slowdown problem that was encountered in an internal Sterling Order Management System (OMS) environment. Experienced OMS SMEs using the traditional manual fault detection approach of analyzing single traces concluded after a significant amount of time that the DB2 database component was at fault because of its configured rate limit violations. In contrast, Instana’s RCI feature automatically detected the component at fault to be a WebSphere Application Server (WAS) instance connected to the DB2 database. Further analysis from logs and metric data confirmed the RCI’s algorithm’s correctness. The WAS instance was at fault, not the DB2 instance, because the WAS instance had exhausted its configured thread pool.
We also verified and validated the effectiveness of our causal AI-based RCI algorithm in several customer scenarios, working with their SREs in external environments of varying complexity. In all cases, when sufficient telemetry data was available, our RCI feature could correctly identify the possible components at fault. In instances where telemetry data was sparse, Instana’s RCI feature did not surface any faulty component because of a perceived lack of certainty, as described earlier.
Comparing the Instana RCI feature with traditional APM and observability platforms
Modern enterprise applications are becoming more distributed, scalable, fault-tolerant, highly available, and hybrid, spanning cloud and on-prem components. These applications are quickly embracing and incorporating newer technologies such as containerization, Kubernetes, AI, amongst others. The traditional monitoring tools that served their purpose earlier have not kept up with the rapid technological advances of highly dynamic distributed hybrid applications.
Many vendors currently offer APM and observability utilities for enterprise applications. The commercially available APM and observability products can be roughly divided into these categories:
- Traditional APM tools collect system performance data and display them flexibly to users. They also produce reports to track performance and availability data trends. SREs use all this information for troubleshooting. However, as mentioned earlier, these tools may not generally be adequate for modern highly distributed hybrid applications.
- A class of APM tools performs anomaly detection on the collected performance data and traces. Events and alerts are generated using one or more anomaly detection techniques. However, these tools can generate significant noise by creating events storms, which can seriously impede root cause detection in real-life troubleshooting.
- To reduce noise and help SREs focus on important events and alerts, another class of observability vendors uses correlation coefficients and machine learning models to correlate components for their root cause analyses. As we mentioned earlier in this article, correlation is not causation. While some of these tools are popular in the field, their theoretical basis is weaker than that of Instana, which is based on causality. Our initial observations conform to the above statement.
A fourth class of APM tools tries to learn models by identifying the root cause from known fingerprints of symptoms curated manually. This class of observability tools uses built-in models of dependent variables, which we informally call patterns, to identify common root causes in cloud-native environments accurately. This approach is interesting and may quickly determine the correct root causes in some cases. However, due to the fundamentally static nature of the built-in models of patterns, this approach may face significant issues in real-life scenarios.
- After extensive efforts, it is possible to enumerate common patterns involving popular middleware and other systems hosting standard microservice applications. However, anticipating and preloading pattern configurations for every possible middleware, system, application, and runtime environment is impractical. All software, including middleware, databases, customer applications, and others, undergo change; bugs are fixed, enhancements are made, and new specifications are implemented. These modifications can alter existing symptoms, remove some of them, or introduce new ones along with their altered or new associated fingerprints. Considering the potential combinations of software components and the inherent dynamism of their life cycles, built-in pattern models may often require careful modifications and expansions to include the diverse components and contexts encountered in large-scale enterprise deployments. This process can be labor-intensive, costly, and prone to errors.
- Even in relatively simple cases, the pre-populated built-in models of patterns may not fully account for the possible existence of malicious (erroneous) components that can act as confounders, resulting in the erroneous identification of root causes.
A causal-AI based observability platform, like IBM Instana. Instana uses the Pearlean framework for its causal inference. Given sufficient trace data, Instana’s probabilistic algorithm will identify root causes with high precision in near real-time without consuming significant computing resources for all types of middleware, systems, and applications in any environment: cloud-native, traditional, or hybrid.
Because of its powerful features, including its root cause detection ability, Instana's selection as CRN’s 2024 Product Of The Year in the Application Performance and Observability category is not surprising.
Conclusions
The probabilistic approach to fault localization presented in this article provides a powerful framework for dealing with the complexities and uncertainties inherent in modern distributed systems. Our theoretically sound inferencing techniques can effectively detect faults even in environments with partial observability and complex failure modes.
Future research directions in this field include:
- Incorporating machine learning techniques to improve causal graph generation.
- Developing methods for handling dynamic system topologies, such as those in containerized serverless environments.
- Integrating natural language processing to incorporate unstructured data sources like logs and error messages into the probabilistic model.
- Exploring reinforcement learning approaches for adaptive fault localization strategies that improve over time.
As systems grow in complexity, advanced fault localization techniques will become increasingly critical for maintaining the reliability and availability of digital services. IBM Instana’s RCI concepts and methods provide a solid foundation for addressing these challenges and pave the way for further innovations in dependable computing.
Do you have feedback on this article? Please contact Debasish at debasish.banerjee@guildsys.com.
Acknowledgments
The authors gratefully acknowledge the technical contributions, valuable discussion sessions, and all the support received from Ameet Rahane, Marc Palaci-Olgun, Ragu Kattinakere, Brad Blancett, Arthur de Magalhases of Instana development; Jesus Rios, Ph. D., Laura Shwartz, Ph. D., DE, Daby Sow, Ph. D., Director, Ruchir Puri, Ph. D., Chief Scientist, Fellow, and VP, Nicholas Fuller, Ph. D., VP of IBM Research; Danilo Florissi, Ph. D., VP of Instana and Turbonomic development. Special thanks to Laura Shwartz for reviewing the drafts and suggesting improvements.
Debasish acknowledges the support of Om Bachu, the founder of Guild Systems Inc. Debasish fondly remembers the support and encouragement of Laura Scott, the retired IBM CSM VP, and Aboud Ghazi, the IBM US Industry CSM leader.
The authors also thank Michelle Corbin for her meticulous work in quickly publishing this article.