Observability Labs
Explore Elastic Observability Labs for expert-led resources and hands-on learning. Enhance your skills and optimize your observability strategy with Elastic.

Nine ES|QL queries that show where your Foundry agent’s tokens go
The spans your Foundry agent already sends to Agent 365 can go to Elastic as well, where one Kibana dashboard shows cost by model, which tool calls run slow, which spans fail, and who is spending the most.
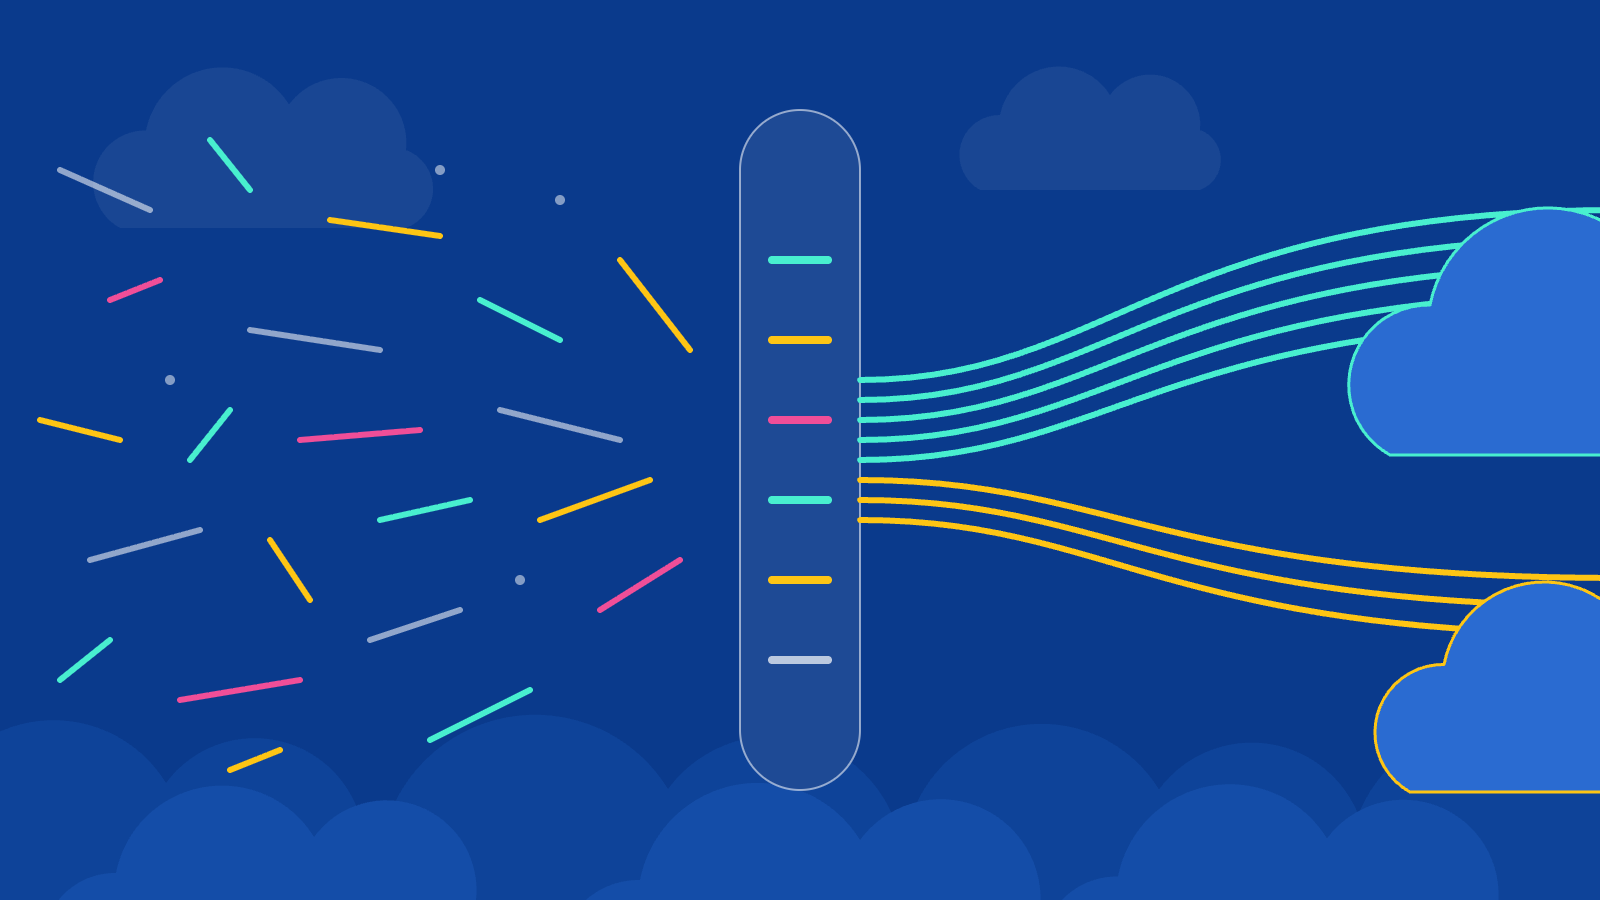
Meet the new Elastic Streams: Managed data pipelines for telemetry
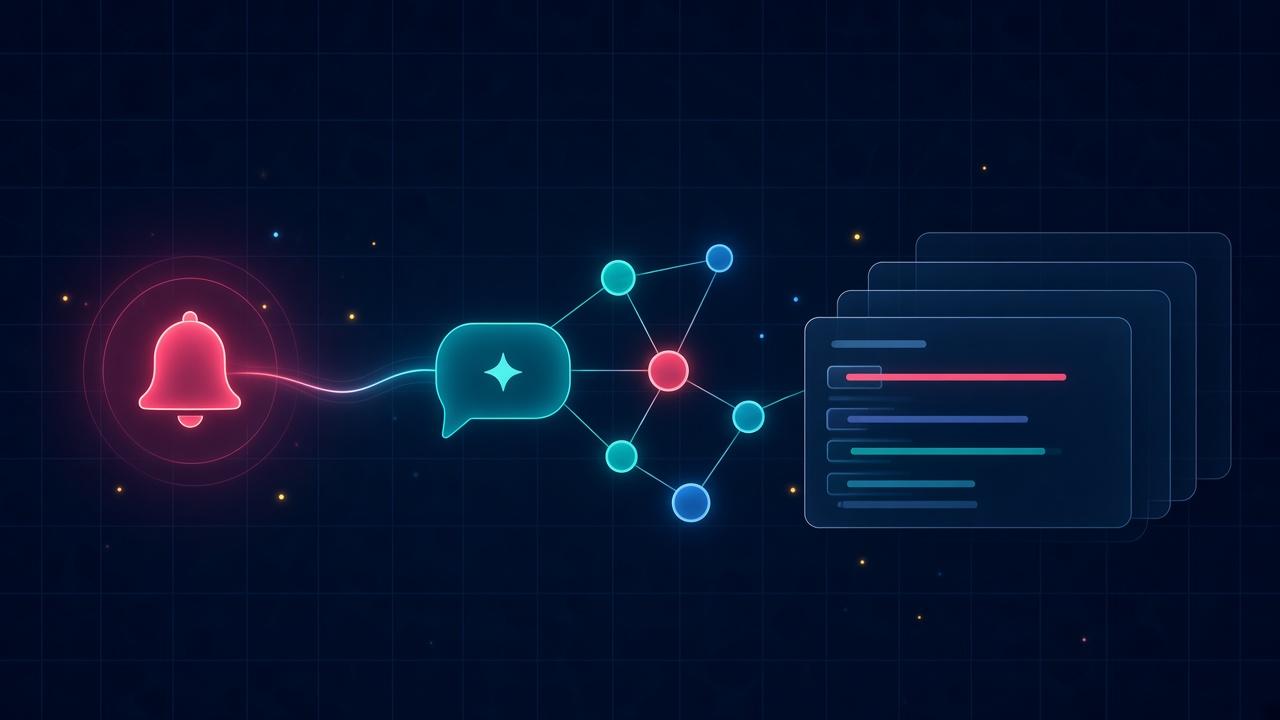
From a checkout alert to the failing span: Investigating with the Elastic AI Agent and Elastic APM flyouts
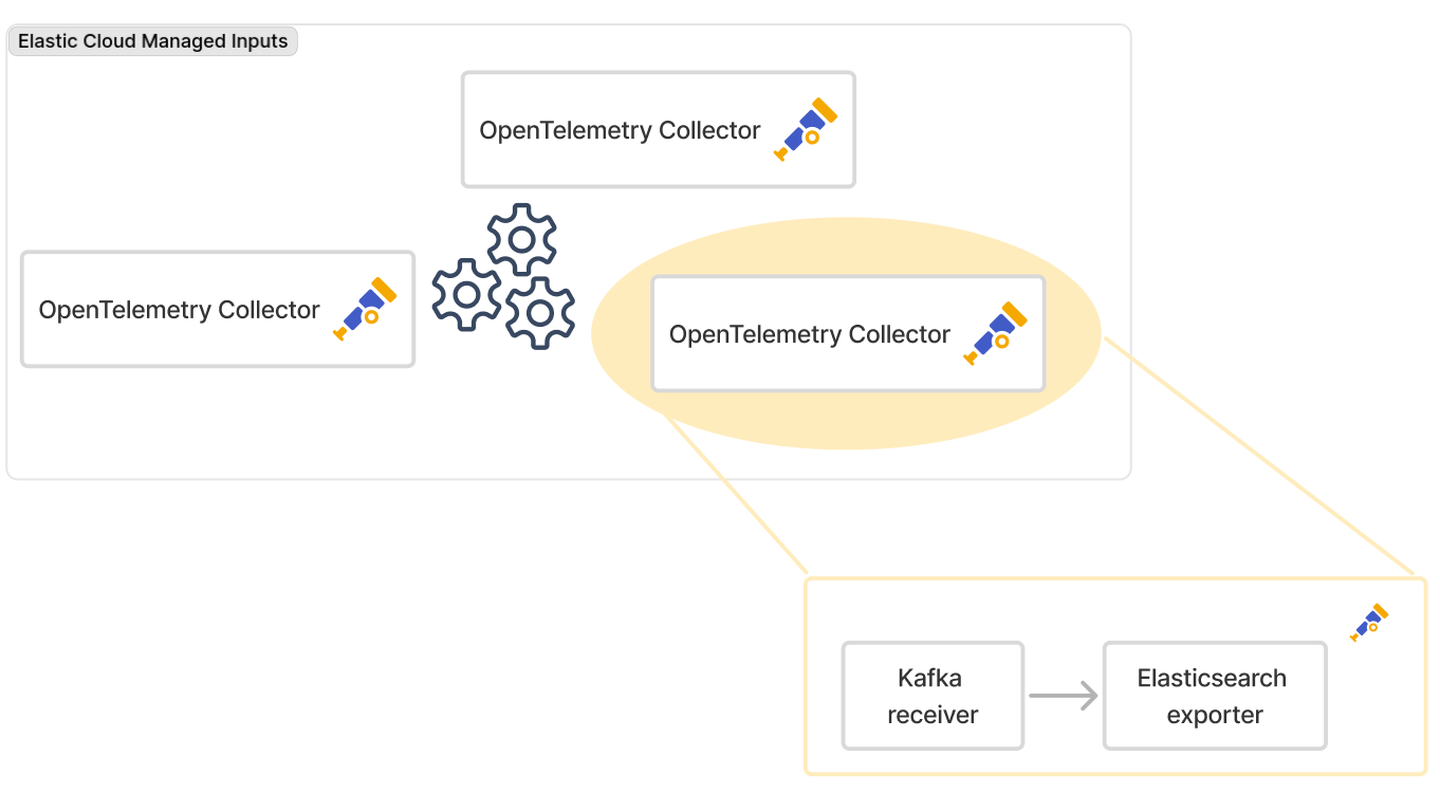
Two changes to the OpenTelemetry Kafka receiver that stop one slow tenant stalling the rest
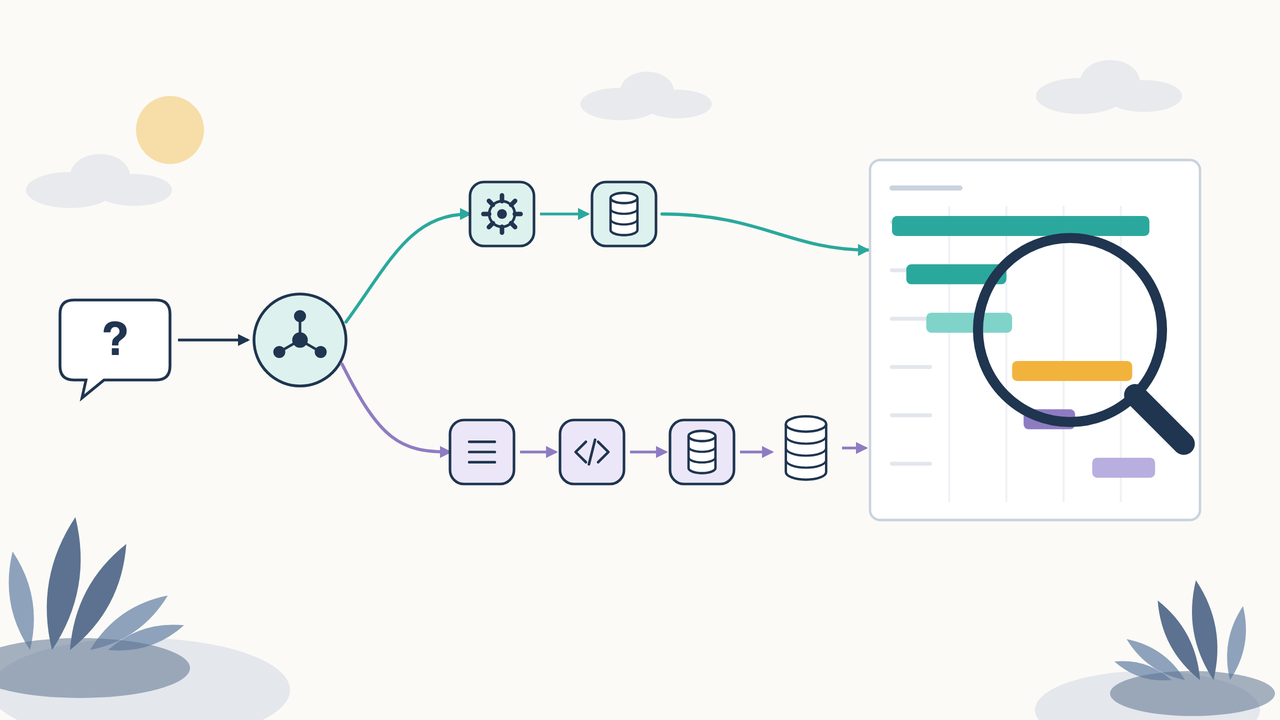
Three model calls, 92% of the wait: AI agent observability with OpenTelemetry
Blog
Developer insights and practical observability articles from our experts to inspire and empower your monitoring stack
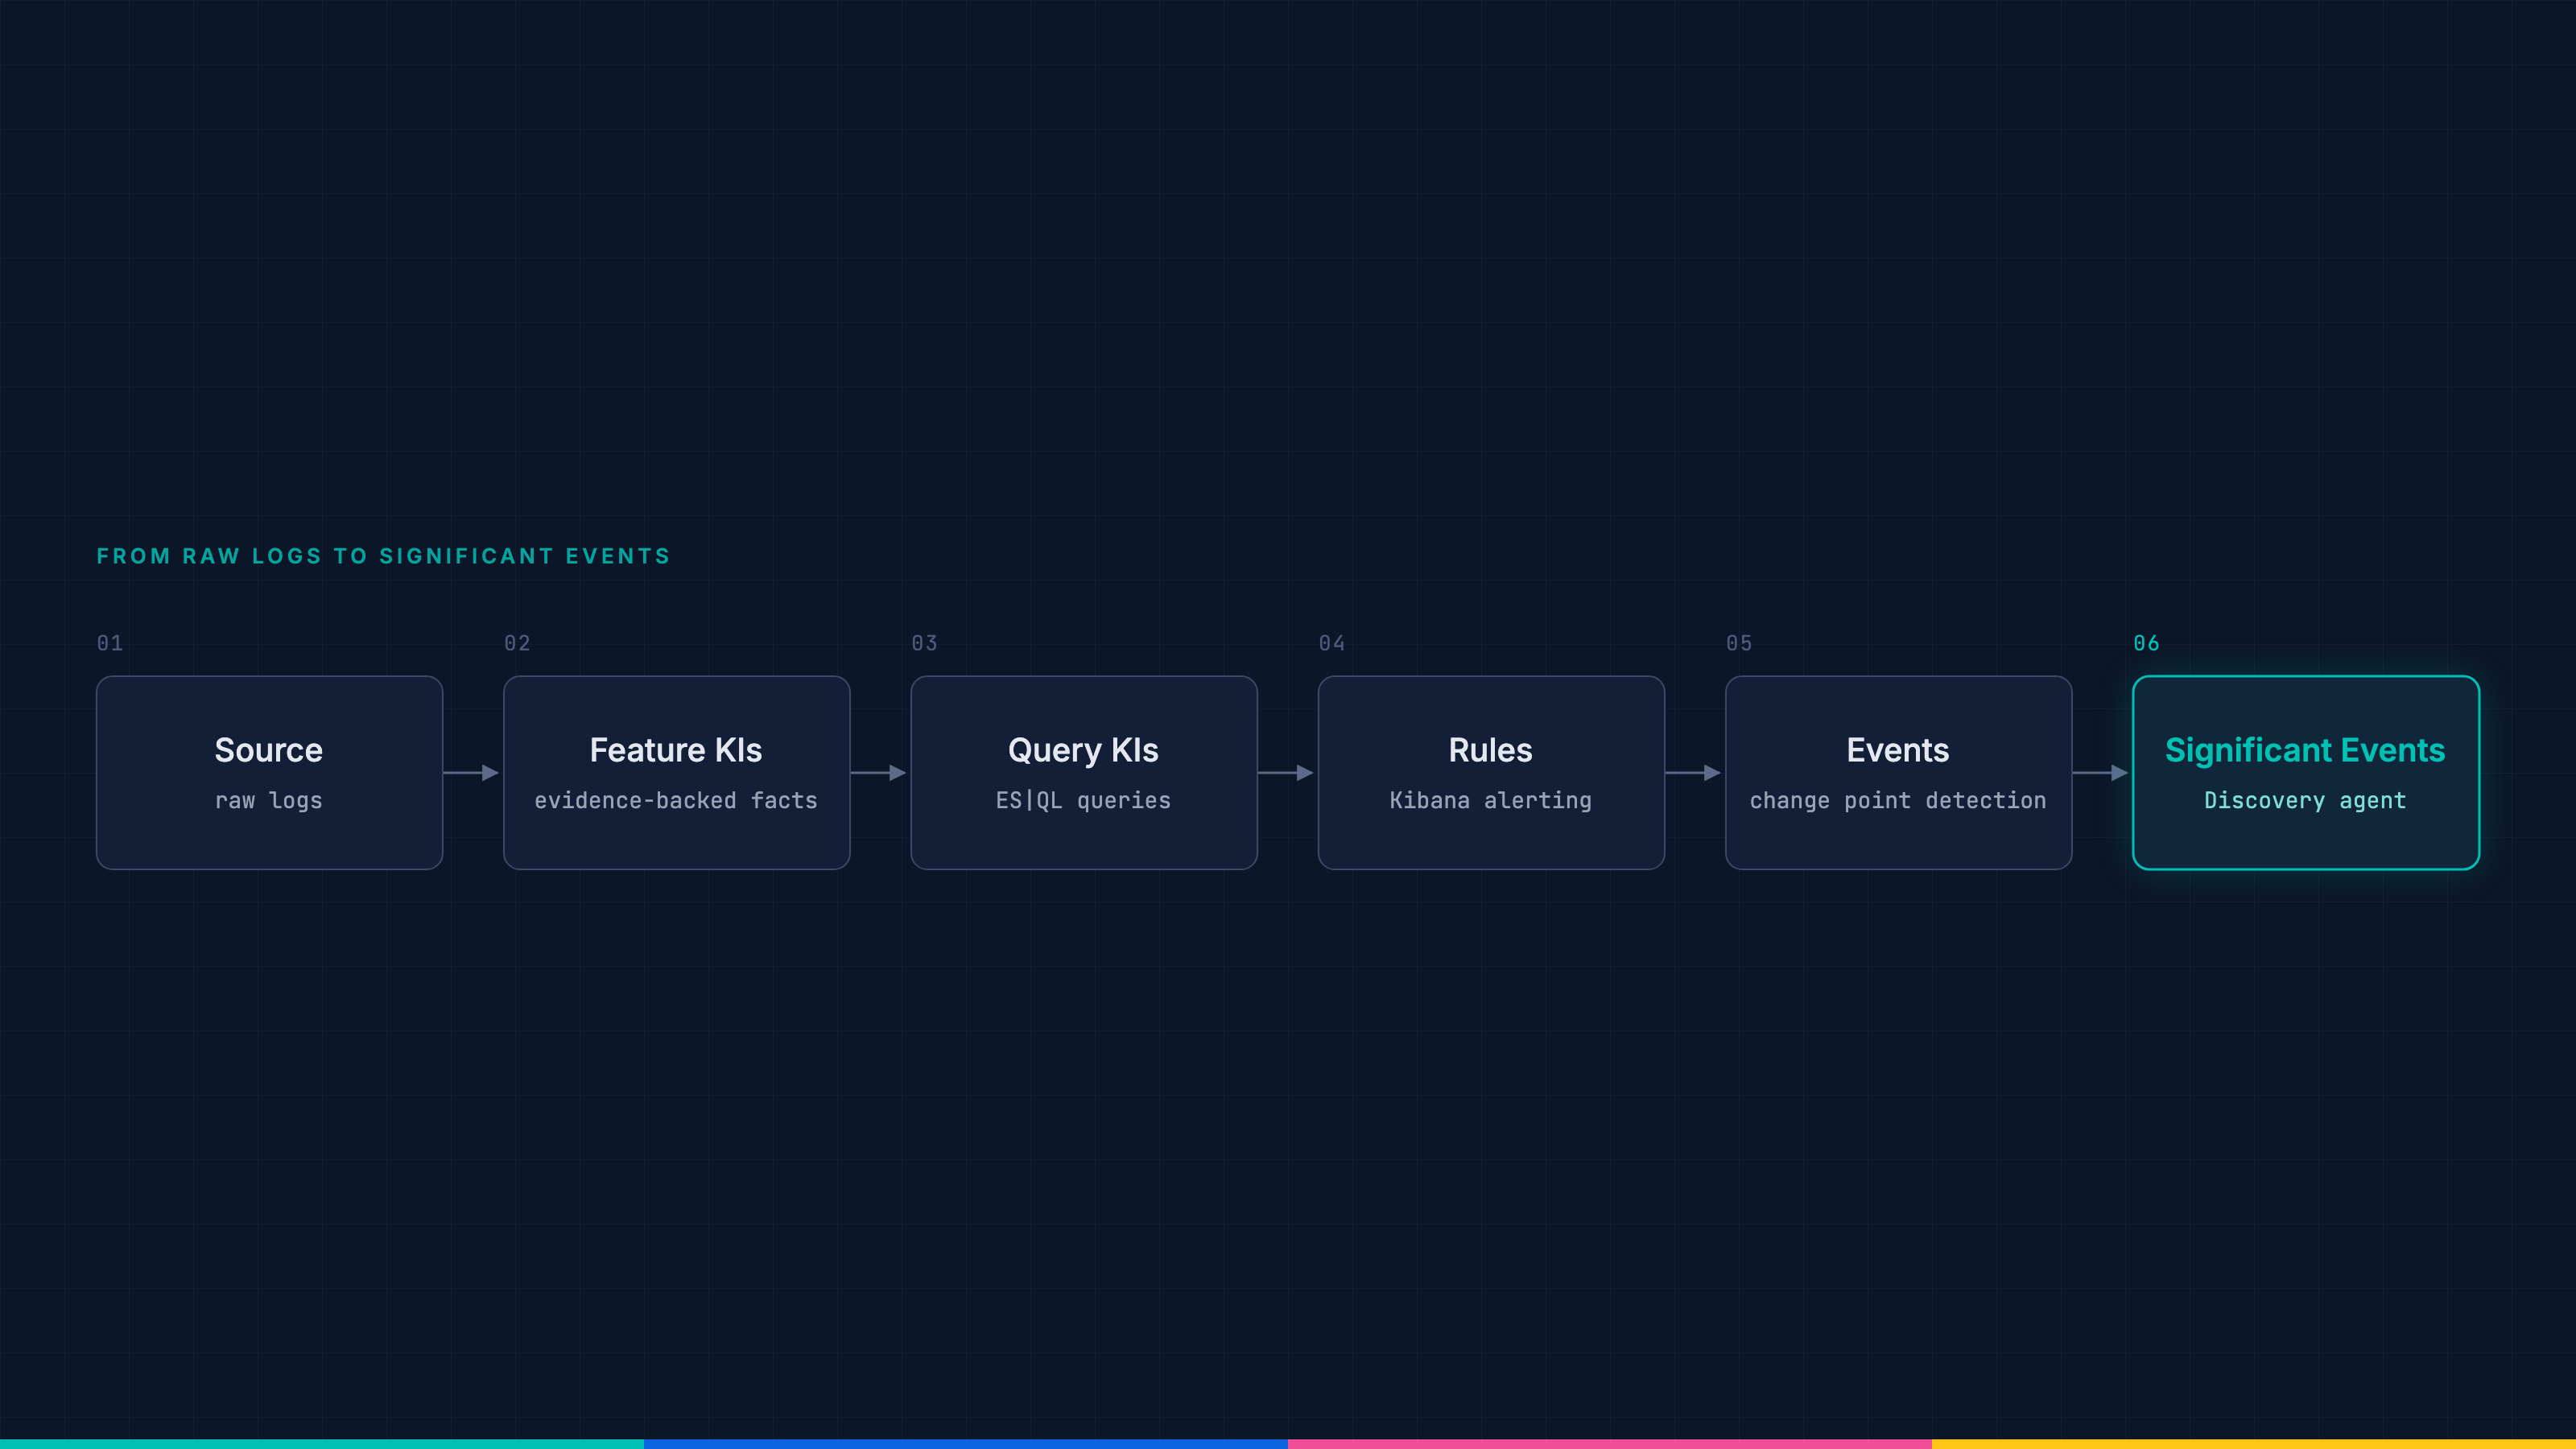
Two rules, one outage, one alert: How change point detection cuts alert noise
The discovery agent re-runs each firing rule’s own ES|QL query against the logs unchanged, so the alert names the unreachable service with the query that proves it.
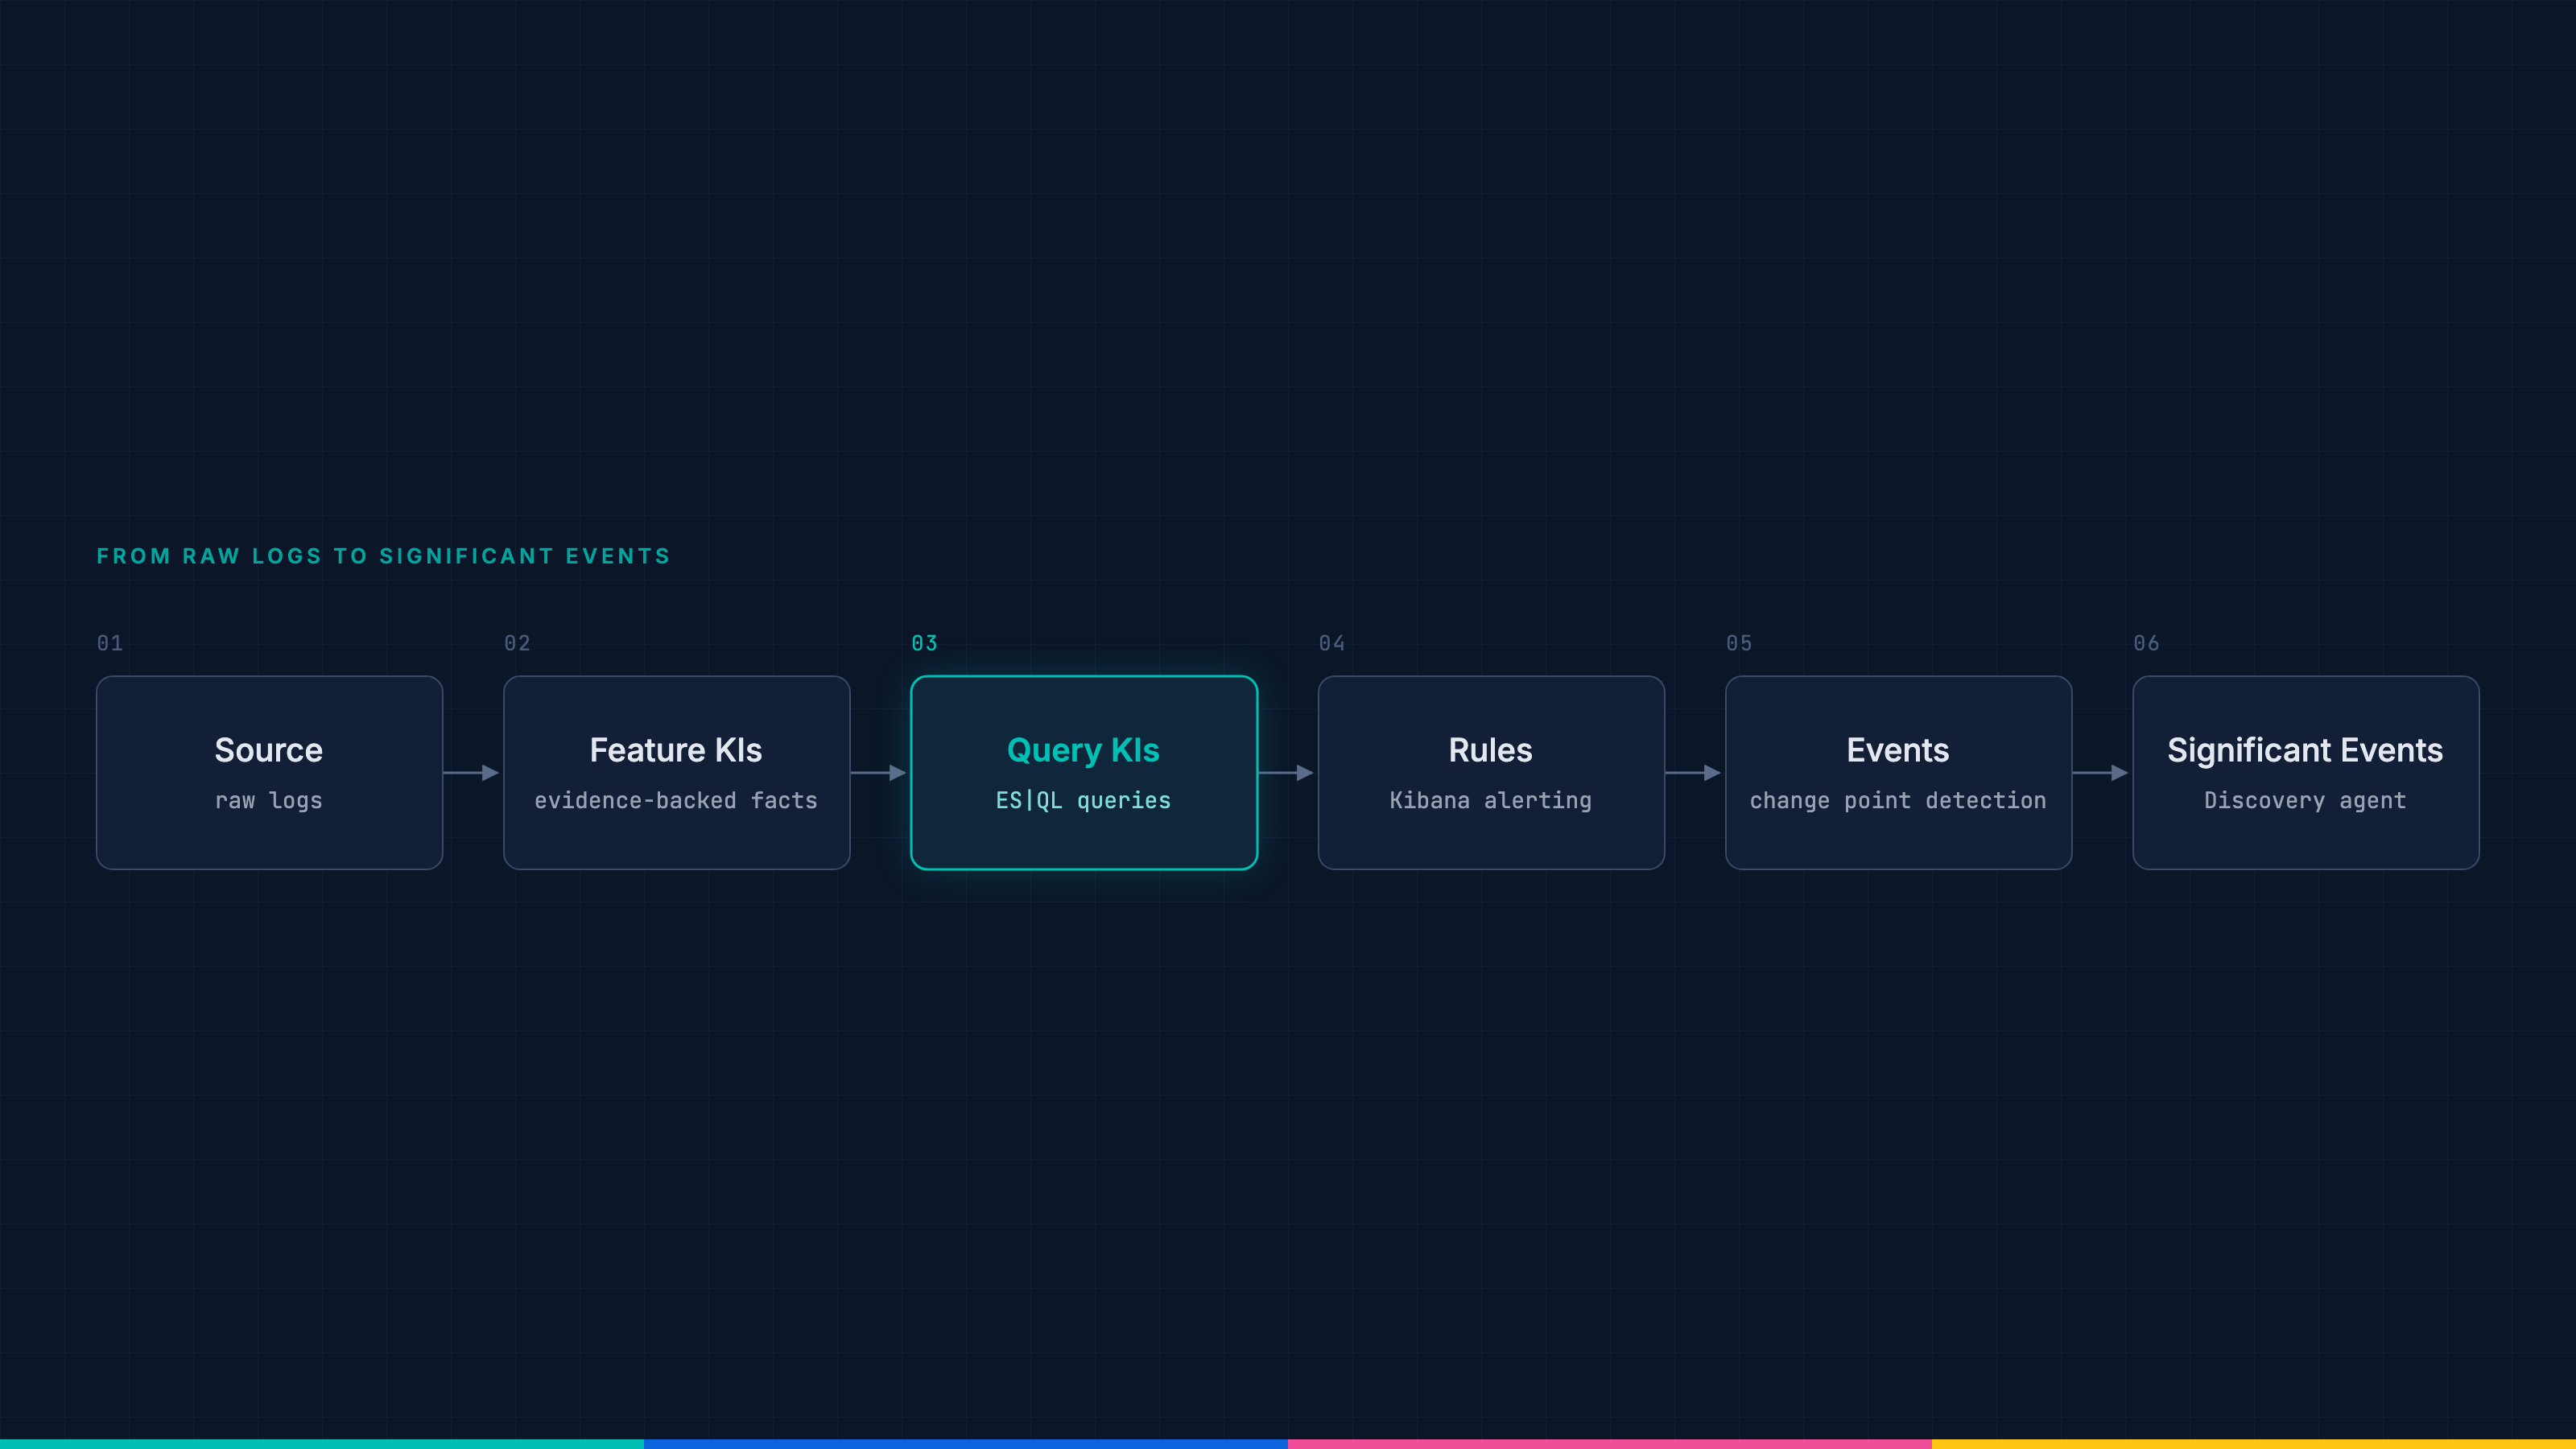
Your logs already wrote the alert: Generating ES|QL detection queries in Elasticsearch
On the OpenTelemetry demo, the top generated ES|QL detection query matches 0 documents while the shop is healthy and 676 during a payment outage.
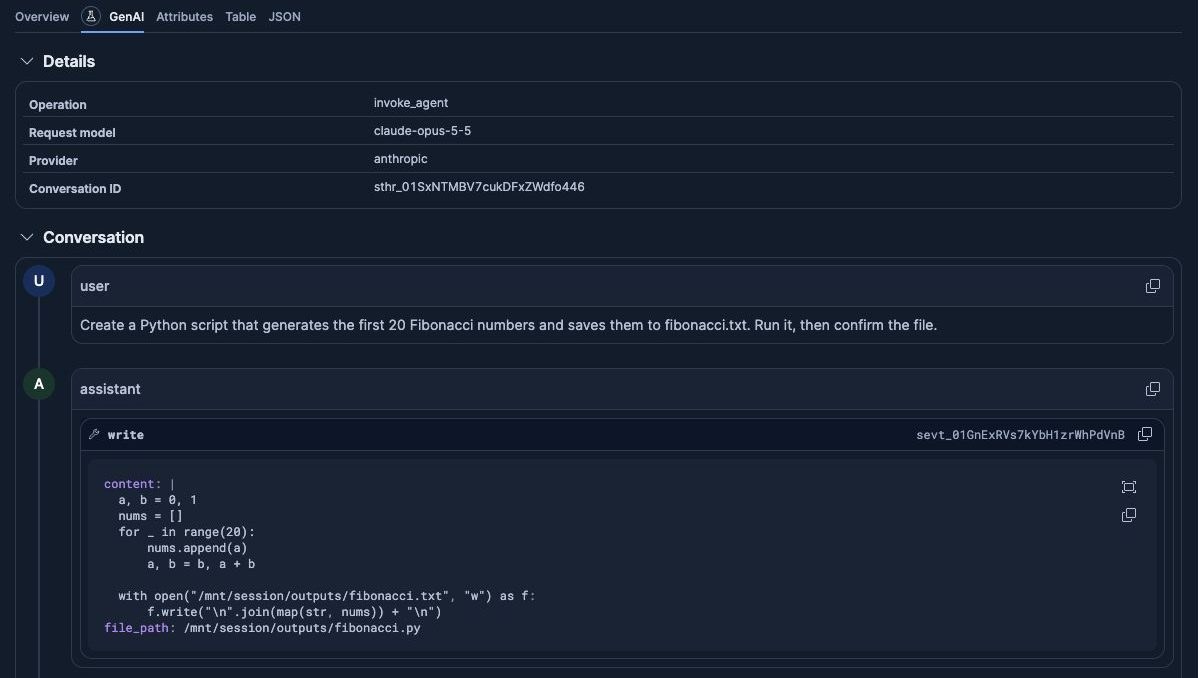
AI agent observability in Elastic for Claude Platform with OpenTelemetry
Send Claude Platform traces to Elastic and the whole turn arrives in Kibana. The service sits in your service inventory next to the rest of your stack, so you can observe it, create alert rules, and create SLOs.
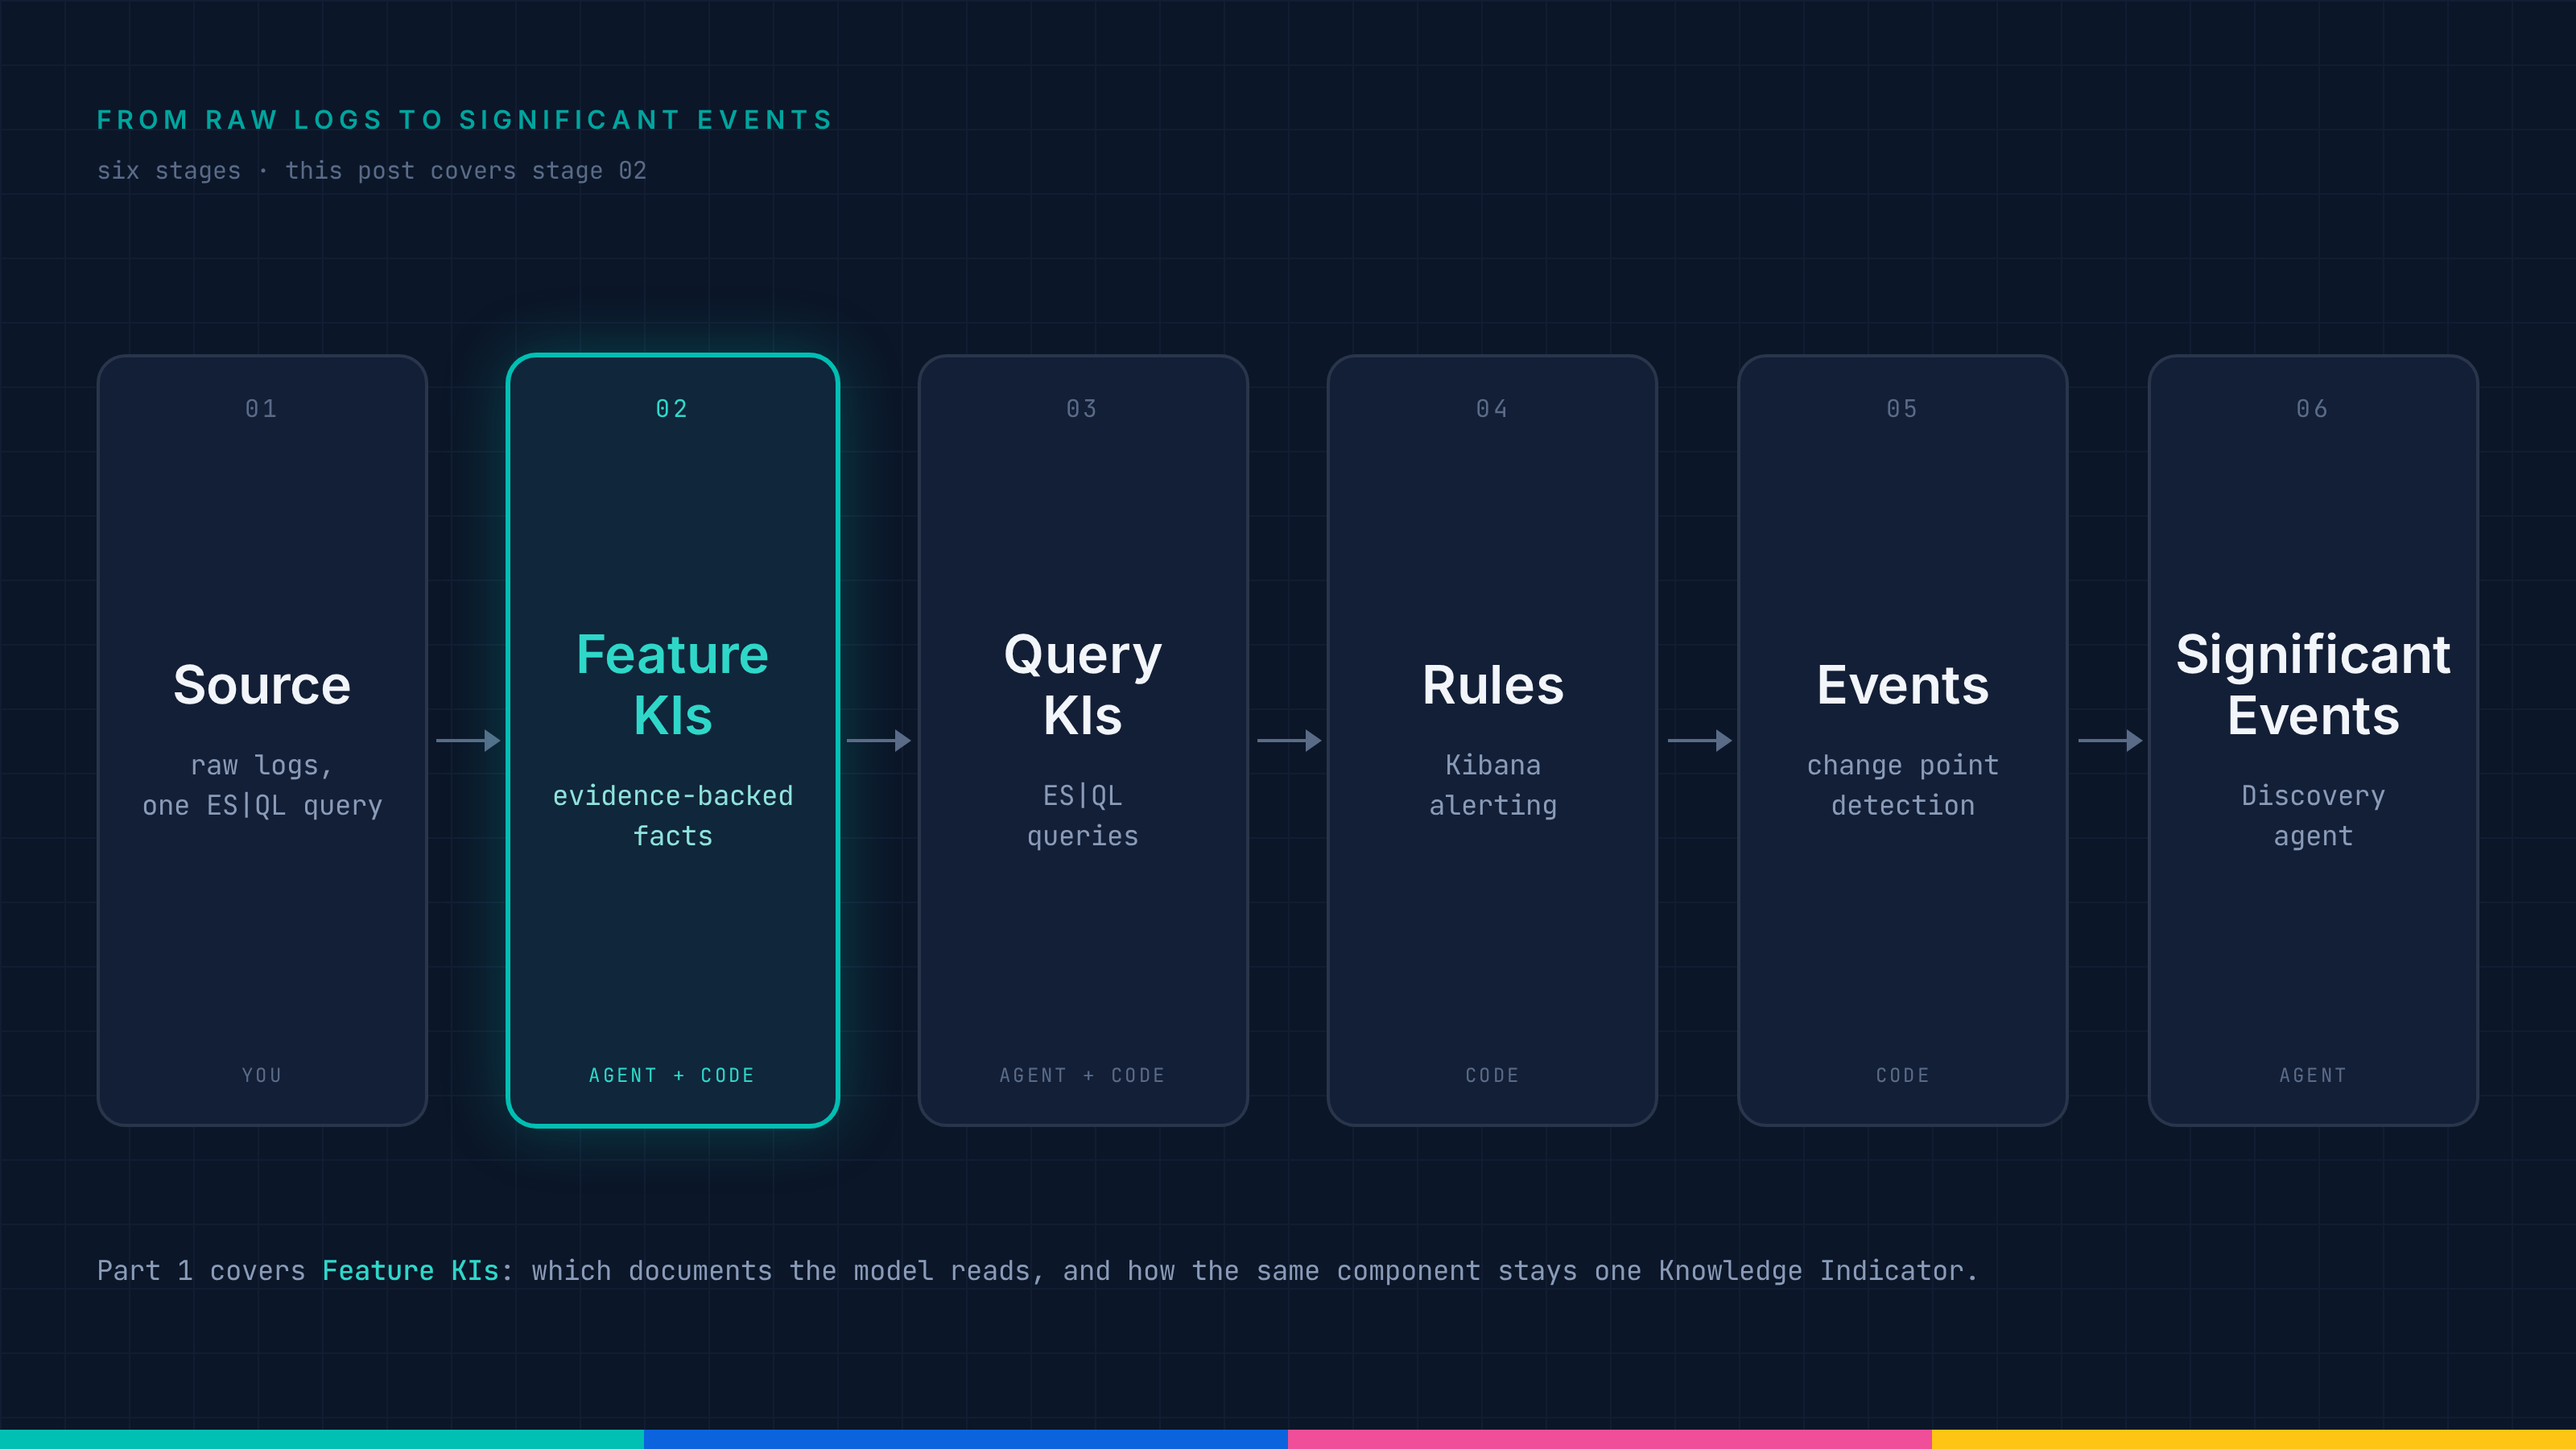
How Elastic Significant Events turns 100 log samples into detection rules
Pick the wrong 100 and you get `log.level: error`, a rule that fires on every request or finds nothing at all, and log sampling is what decides between them.

Three regions, three Kibanas, one view: Cross-cluster search comes to Elastic Synthetics
Monitors from every connected cluster appear in one Kibana, with journey waterfalls, screenshots, errors and certificates. Nothing is replicated, and each cluster still owns its monitors.

How we moved the OpenTelemetry Java agent to invokedynamic in 70+ pull requests
We did the same migration twice, three years apart, and the second time there were a hundred contributors instead of three. What changes when you rebuild how a Java agent instruments code and nothing in production is allowed to break.
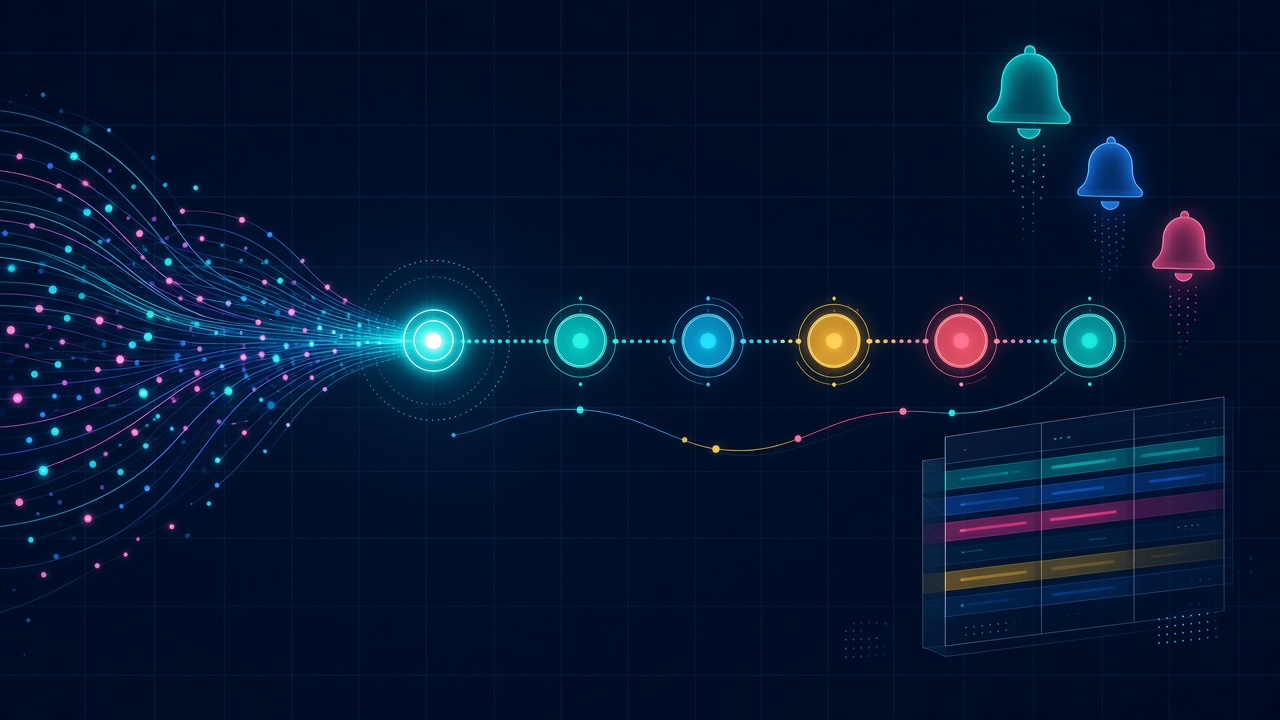
Control how alerts activate, recover and notify: Kibana Universal Alerting in Elastic Observability
Turn ES|QL queries into alert data using Kibana Universal Alerting, and triage Classic and external alerts alongside Universal alerts in a single view.

YAML meets IConfiguration: Declarative configuration for the OpenTelemetry .NET SDK
You can change sampling without shipping a new build, because the first declarative configuration package parses YAML into a typed model and projects it into the flat keys the OpenTelemetry .NET SDK already reads.

The Great Cat Escape: A hands-on guide to OpenTelemetry, Elastic APM, and Kibana alerting
Six cats are plotting their escape and you get one alert to stop them. Instrument a Python game with OpenTelemetry, ship it to Elastic APM, and the ES|QL rule you write decides whether you catch the worst offender before it hits ten attempts.
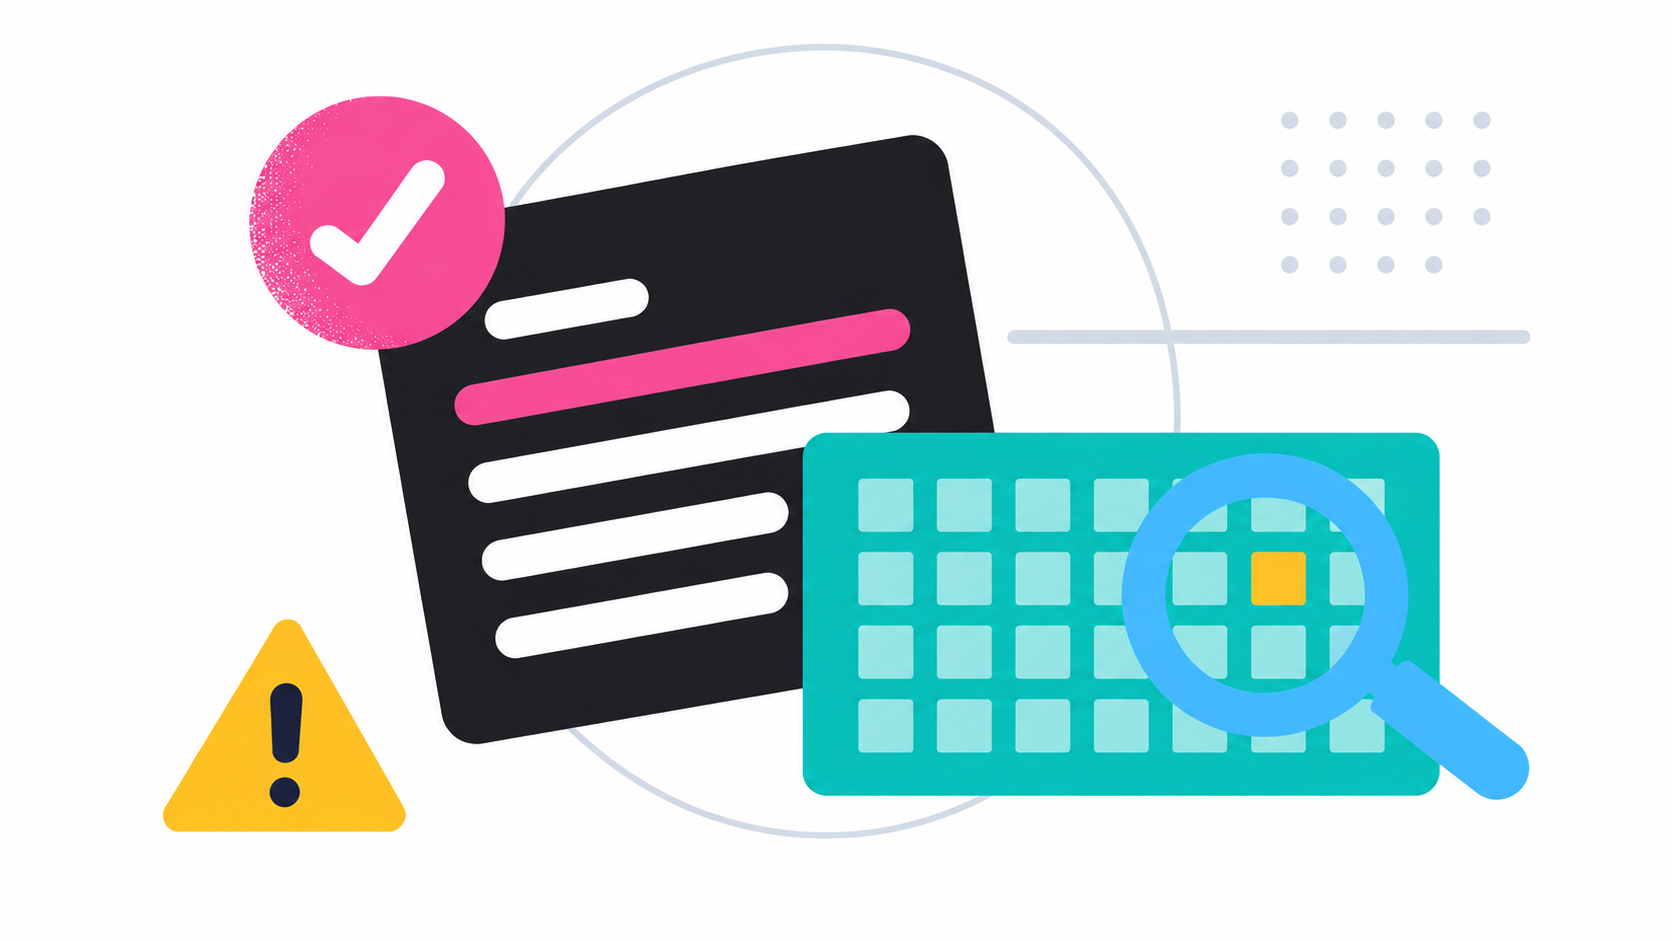
One ES|QL query, 365 days of audit logs: Same search on hot data and searchable snapshots
Collect audit logs with the EDOT Collector, then confirm the 365-day retention policy actually applied before an auditor asks you to.
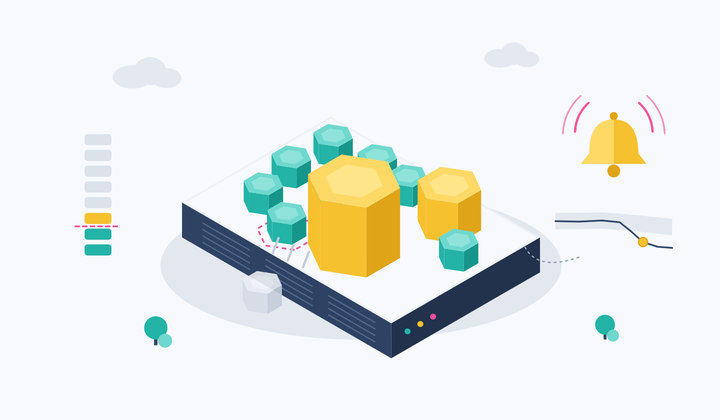
Kubernetes node pressure: Catching the memory drop 7 minutes before the first pod eviction
The pod you lose is rarely the pod that grew. This walkthrough follows a per-node anomaly detection alert all the way to the pod whose working set moved.
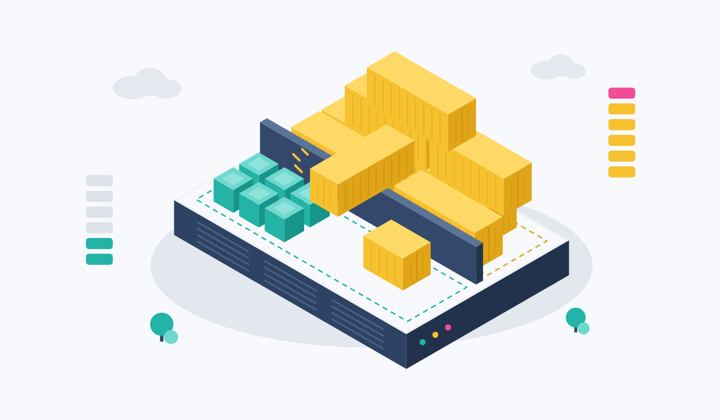
Kubernetes noisy neighbor in a multi-tenant cluster: Find it with ES|QL
Every pod was Running, and storefront requests under 500 ms still fell from 99.6% to 59%. ES|QL on kubelet metrics found a batch job taking 1.7 of the node's 2 cores, and a 500m cap brought the storefront back above 99%.
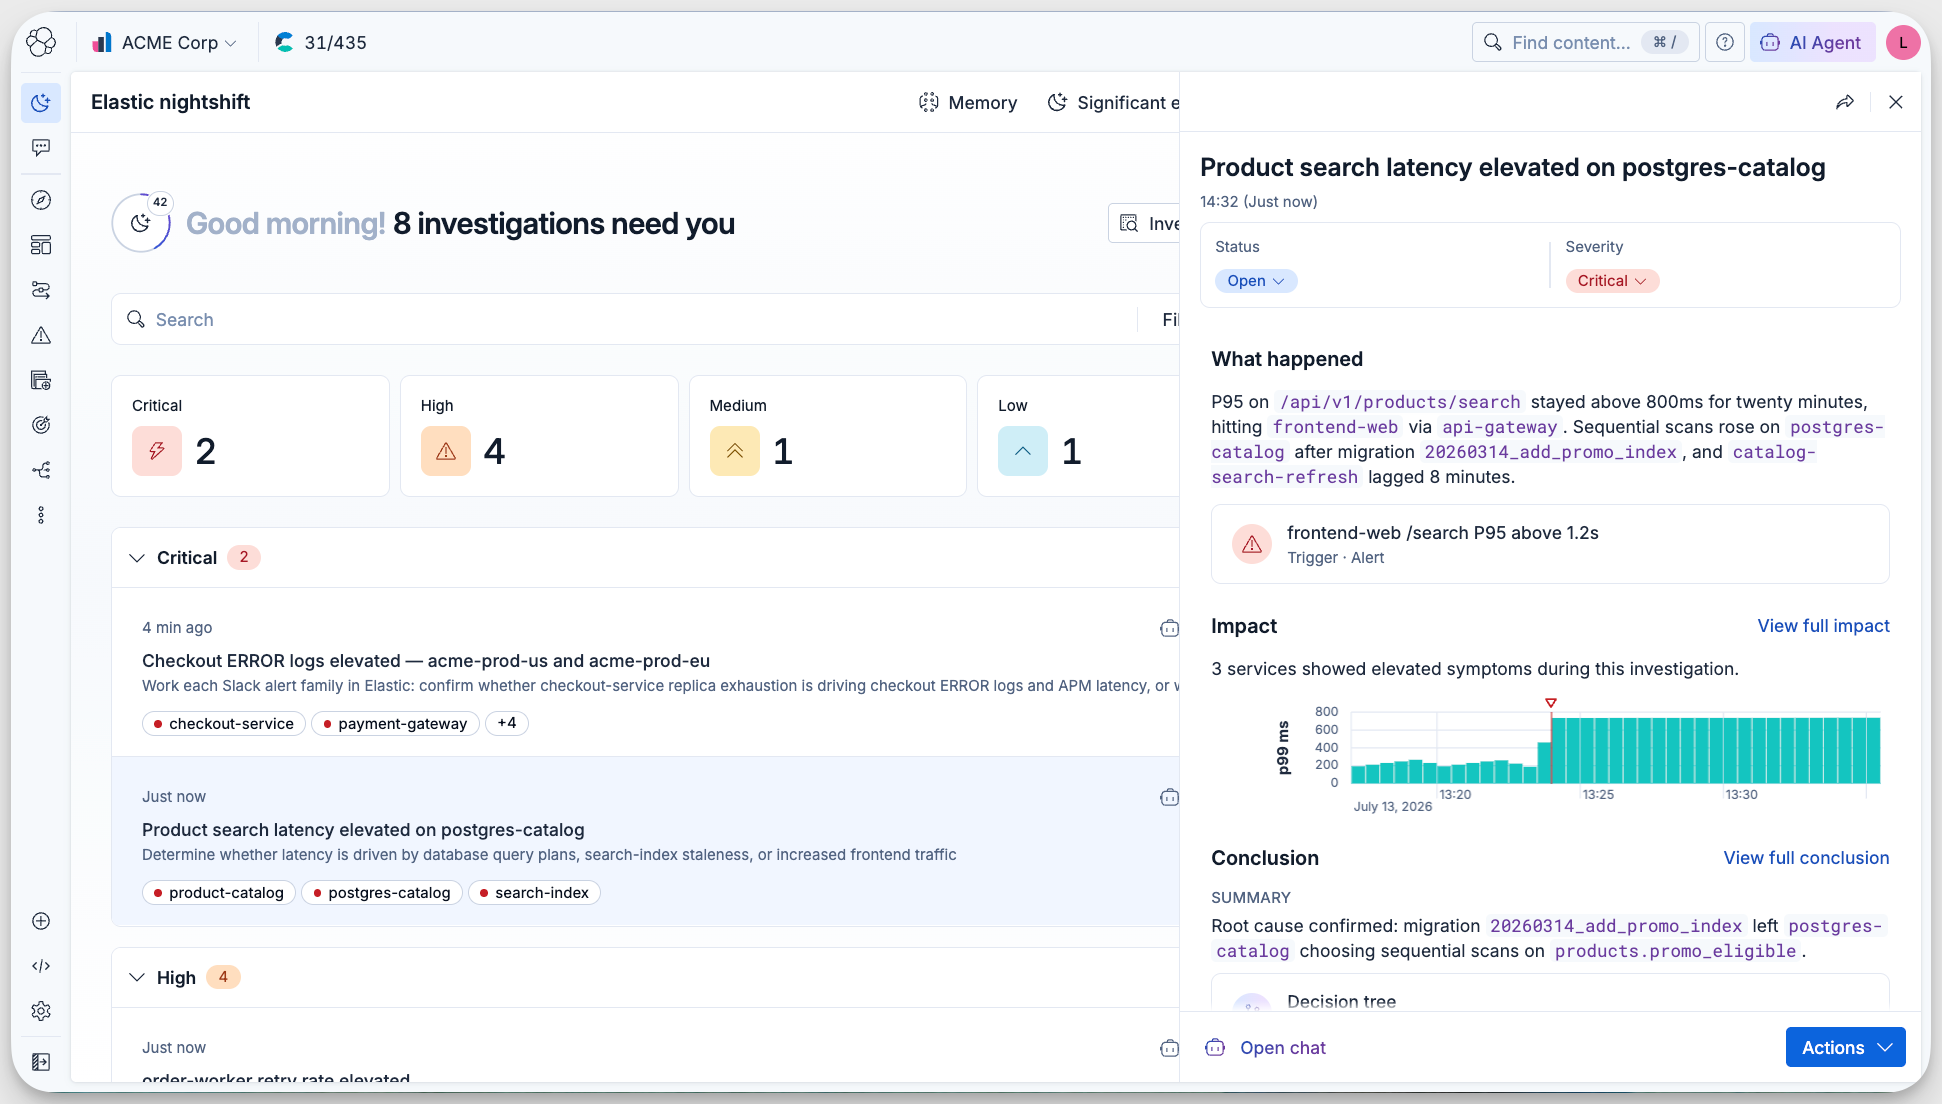
Meet Elastic nightshift AI SRE, your always-on SRE coworker
Elastic's SRE team has been running Elastic nightshift against our own production environment. It picks up incidents that never triggered an alert and shows its working for every conclusion it reaches.

Automated root cause analysis for AWS: From a CloudWatch alert to a diagnosed incident in 36 seconds
We broke a live RDS instance with a connection leak, and the workflow came back with the Postgres refusals, the downstream 5xx and a root cause nobody had to write by hand.
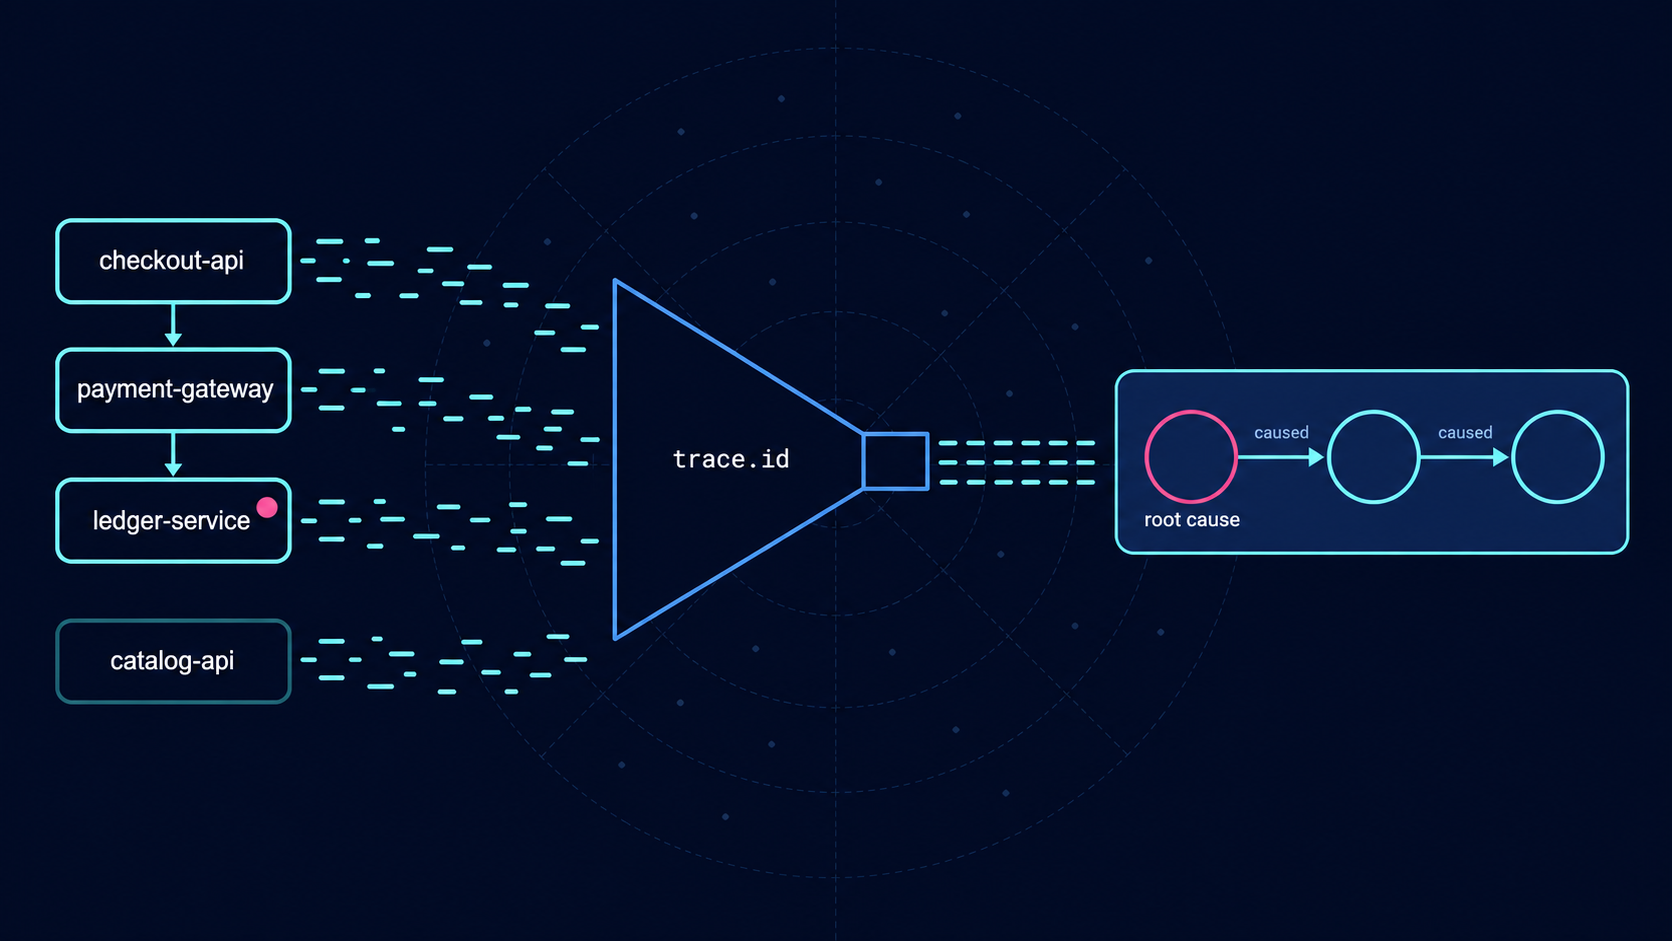
The service with the most errors was healthy: root cause analysis from logs with ES|QL
Metrics ranked three services identically at 19.1%. Four ES|QL queries over the same 4,688 OpenTelemetry log records traced 955 of 956 failure chains back to one of them, and needed no service dependency model to do it.