About cookies on this site Our websites require some cookies to function properly (required). In addition, other cookies may be used with your consent to analyze site usage, improve the user experience and for advertising. For more information, please review your options. By visiting our website, you agree to our processing of information as described in IBM’sprivacy statement. To provide a smooth navigation, your cookie preferences will be shared across the IBM web domains listed here.
Tutorial
AgentOps in watsonx Orchestrate: Observability for Agents with Langfuse and IBM Telemetry
A developer’s guide for instrumenting and observing Agents with Langfuse and IBM Telemetry in watsonx Orchestrate
Imagine a smart AI agent that answers questions, automates workflows, and makes decisions. But, do you really know what happens inside its mind? Is it choosing the actions correctly, responding to queries quickly, or wasting system resources?
This is where AgentOps and LLM observability help. Similar to DevOps for software engineering, AgentOps and LLM observability platforms such as Langfuse and IBM Telemetry provide complete visibility into your AI applications. They help with:
- Tracking prompts, responses, and metadata for every model call
- Measuring latency, costs, and token usage over time
- Capturing success and failure rates with root causes
- Running A/B tests for prompts or model settings
- Displaying real-time dashboards to optimize performance and ensure compliance
In this tutorial, learn how to choose and use the right LLM observability in watsonx Orchestrate Agent Development Kit (ADK) to build production-ready AI agent workflows. This tutorial also helps you to establish end-to-end visibility, streamline debugging, and optimize agentic workflows for production environments.
Prerequisites
A local setup of the IBM watsonx Orchestrate Agent Development Kit (ADK). For detailed setup instructions, see getting started with the watsonx Orchestrate ADK.
Note: This tutorial is tested on watsonx Orchestrate ADK version 1.9.0.
The watsonx Orchestrate ADK needs Python 3.11, or later. The watsonx Orchestrate ADK works with newer versions, but this tutorial is tested with Python 3.11.
Get started with Observability in watsonx Orchestrate
Building reliable agentic workflows requires strong observability, and watsonx Orchestrate gives you multiple ways to achieve it. Depending on your needs, you can set up observability locally with IBM Telemetry or Langfuse, or connect to Langfuse SaaS for a managed solution. For teams who want rapid insights, watsonx Orchestrate also includes built-in Agent Analytics that is powered by IBM Telemetry. A glimpse at the sections in this tutorial that explains each option, its benefits, and when to choose it, follows:
IBM Telemetry setup on watsonx Orchestrate ADK: Learn how to configure IBM Telemetry on your local watsonx Orchestrate ADK to monitor agent performance, track errors, and analyze interactions in detail. Choose this option if you need enterprise-grade observability with compliance and end-to-end control.
Langfuse setup on watsonx Orchestrate ADK: Set up Langfuse locally to trace prompts, responses, and metrics across your agents. Pick Langfuse for flexible, open source observability, and fast iteration during development.
Langfuse setup (SaaS) on watsonx Orchestrate: Connect your local or SaaS watsonx Orchestrate instance to a cloud-hosted Langfuse account for scalable and managed monitoring without infrastructure. Ideal for teams who want quick setup and cloud-based insights.
Agent Analytics on watsonx Orchestrate: Explore built-in analytics powered by IBM Telemetry to see AI agent performance metrics, message traces, and troubleshoot issues across all AI agents. Use Agent Analytics for quick access to dashboards and detailed metrics without extra setup.
IBM Telemetry setup on watsonx Orchestrate ADK
By connecting your local watsonx Orchestrate ADK environment with IBM Telemetry, you can monitor agent interactions, track performance, and analyze detailed traces. This section walks you through the setup steps, from starting the server to creating a sample agent for testing.
By default, IBM Telemetry is not explicitly enabled on the watsonx Orchestrate server. Start watsonx Orchestrate server and enable IBM Telemetry:
orchestrate server start -e .env -iOr
orchestrate server start -e .env --with-ibm-Telemetry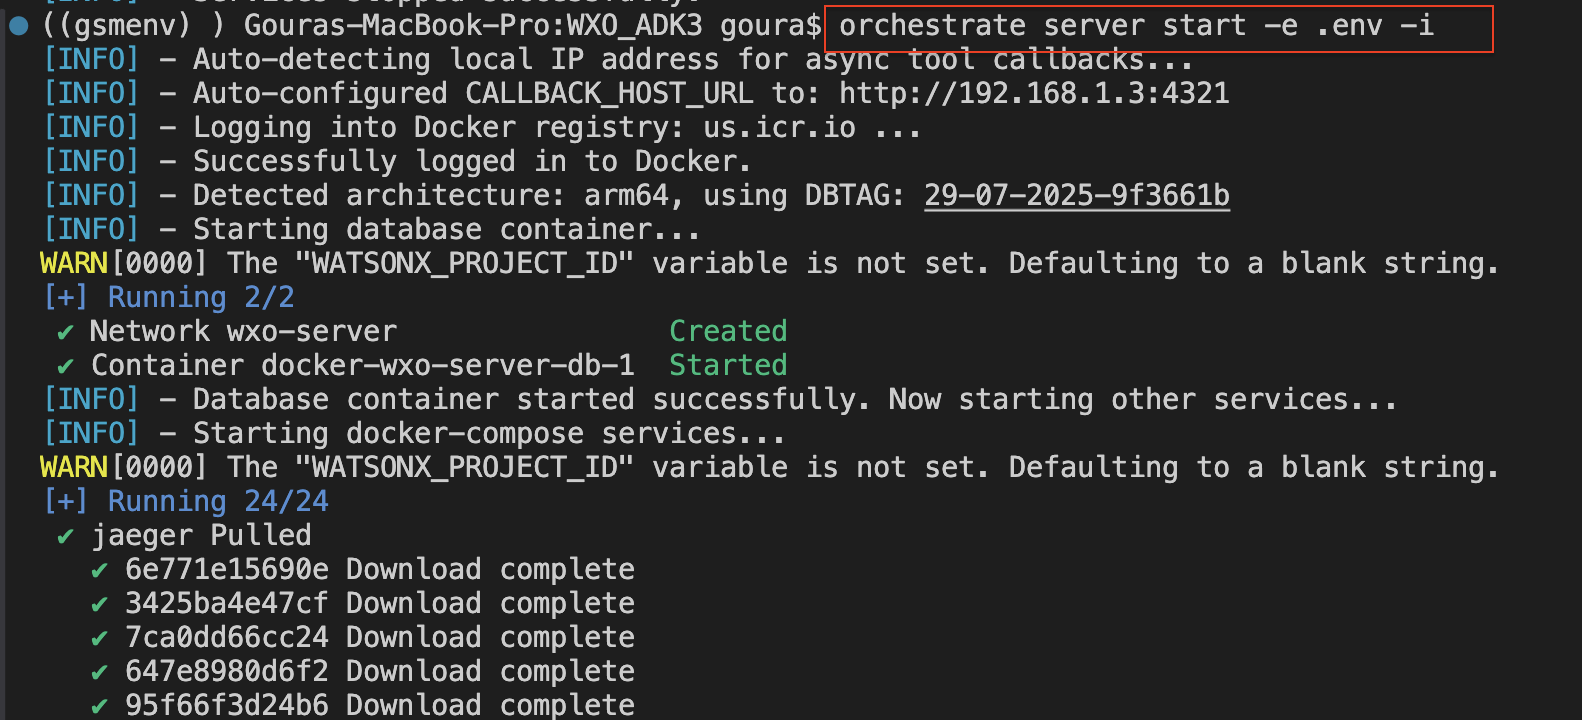
Activate the local watsonx Orchestrate environment:
orchestrate env activate local
Start chat in the watsonx Orchestrate environment:
orchestrate chat start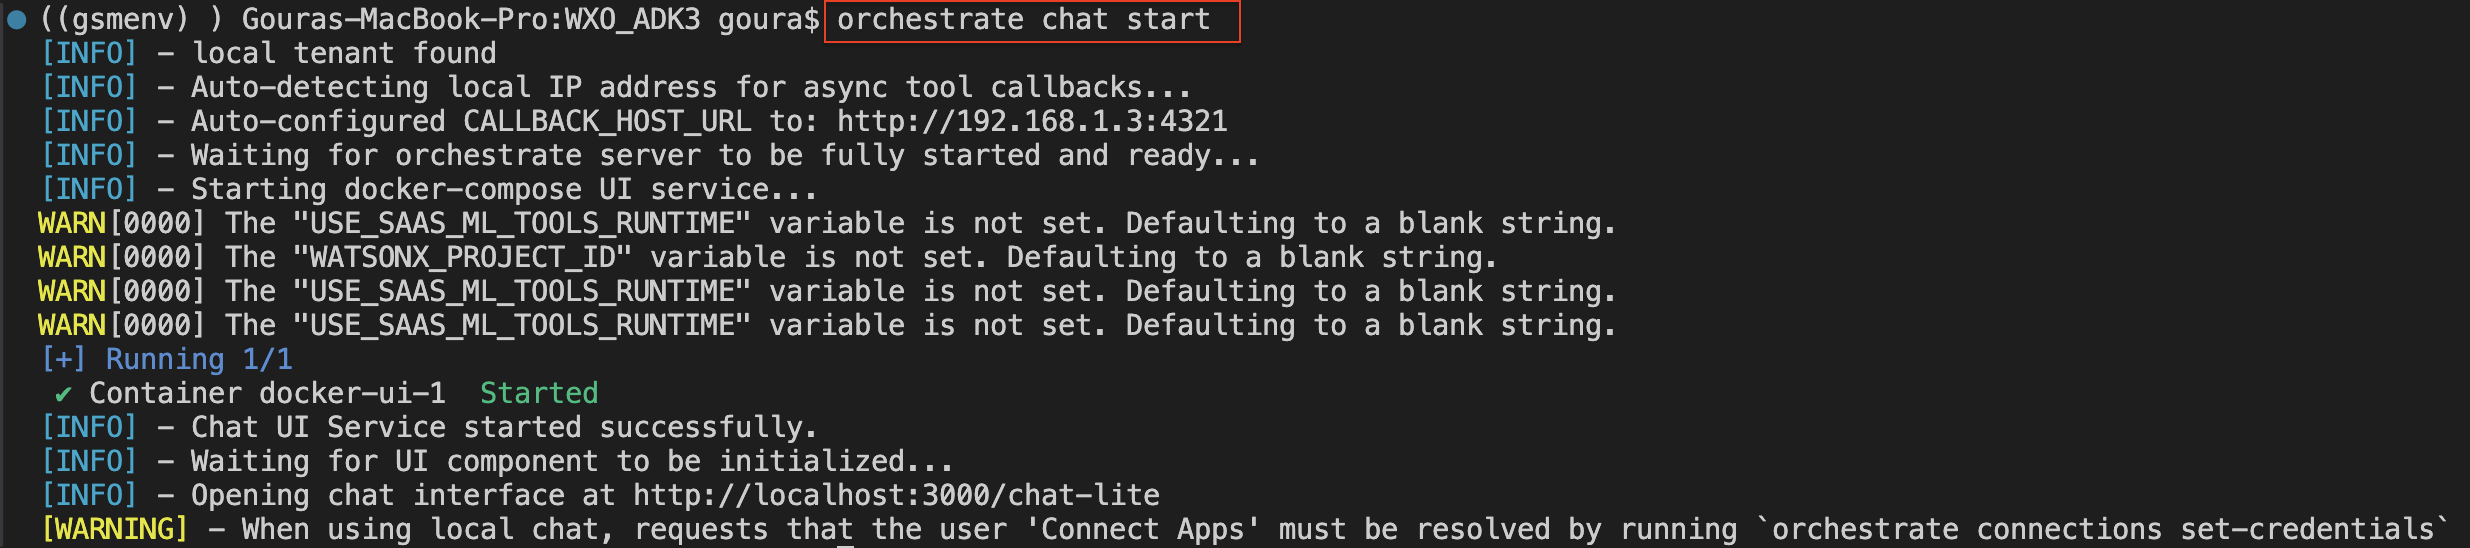
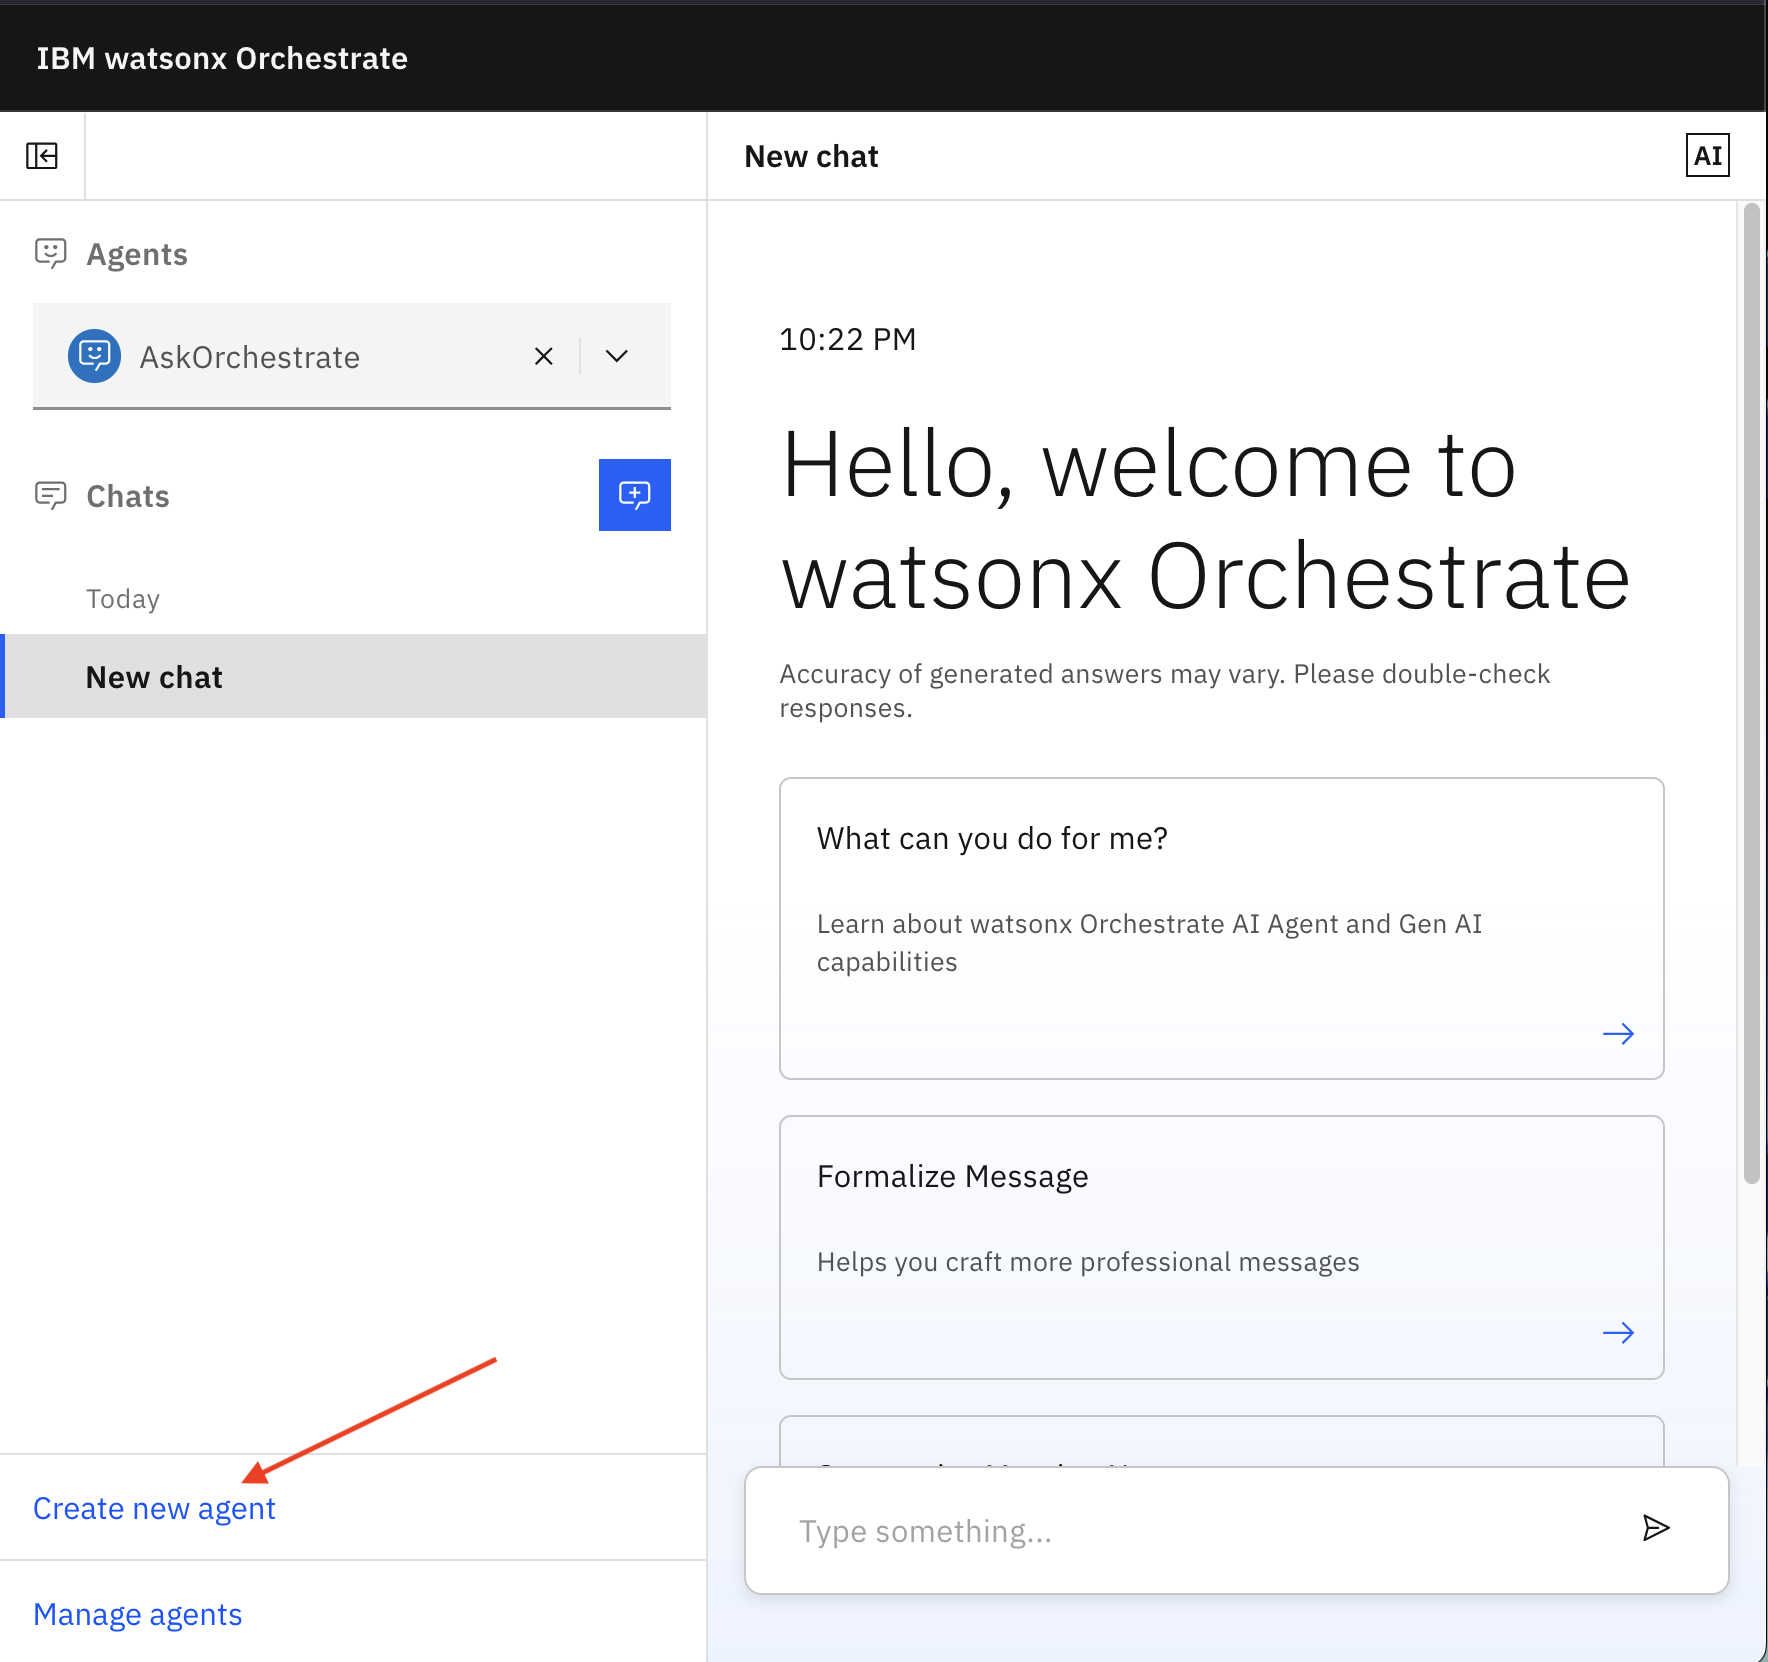
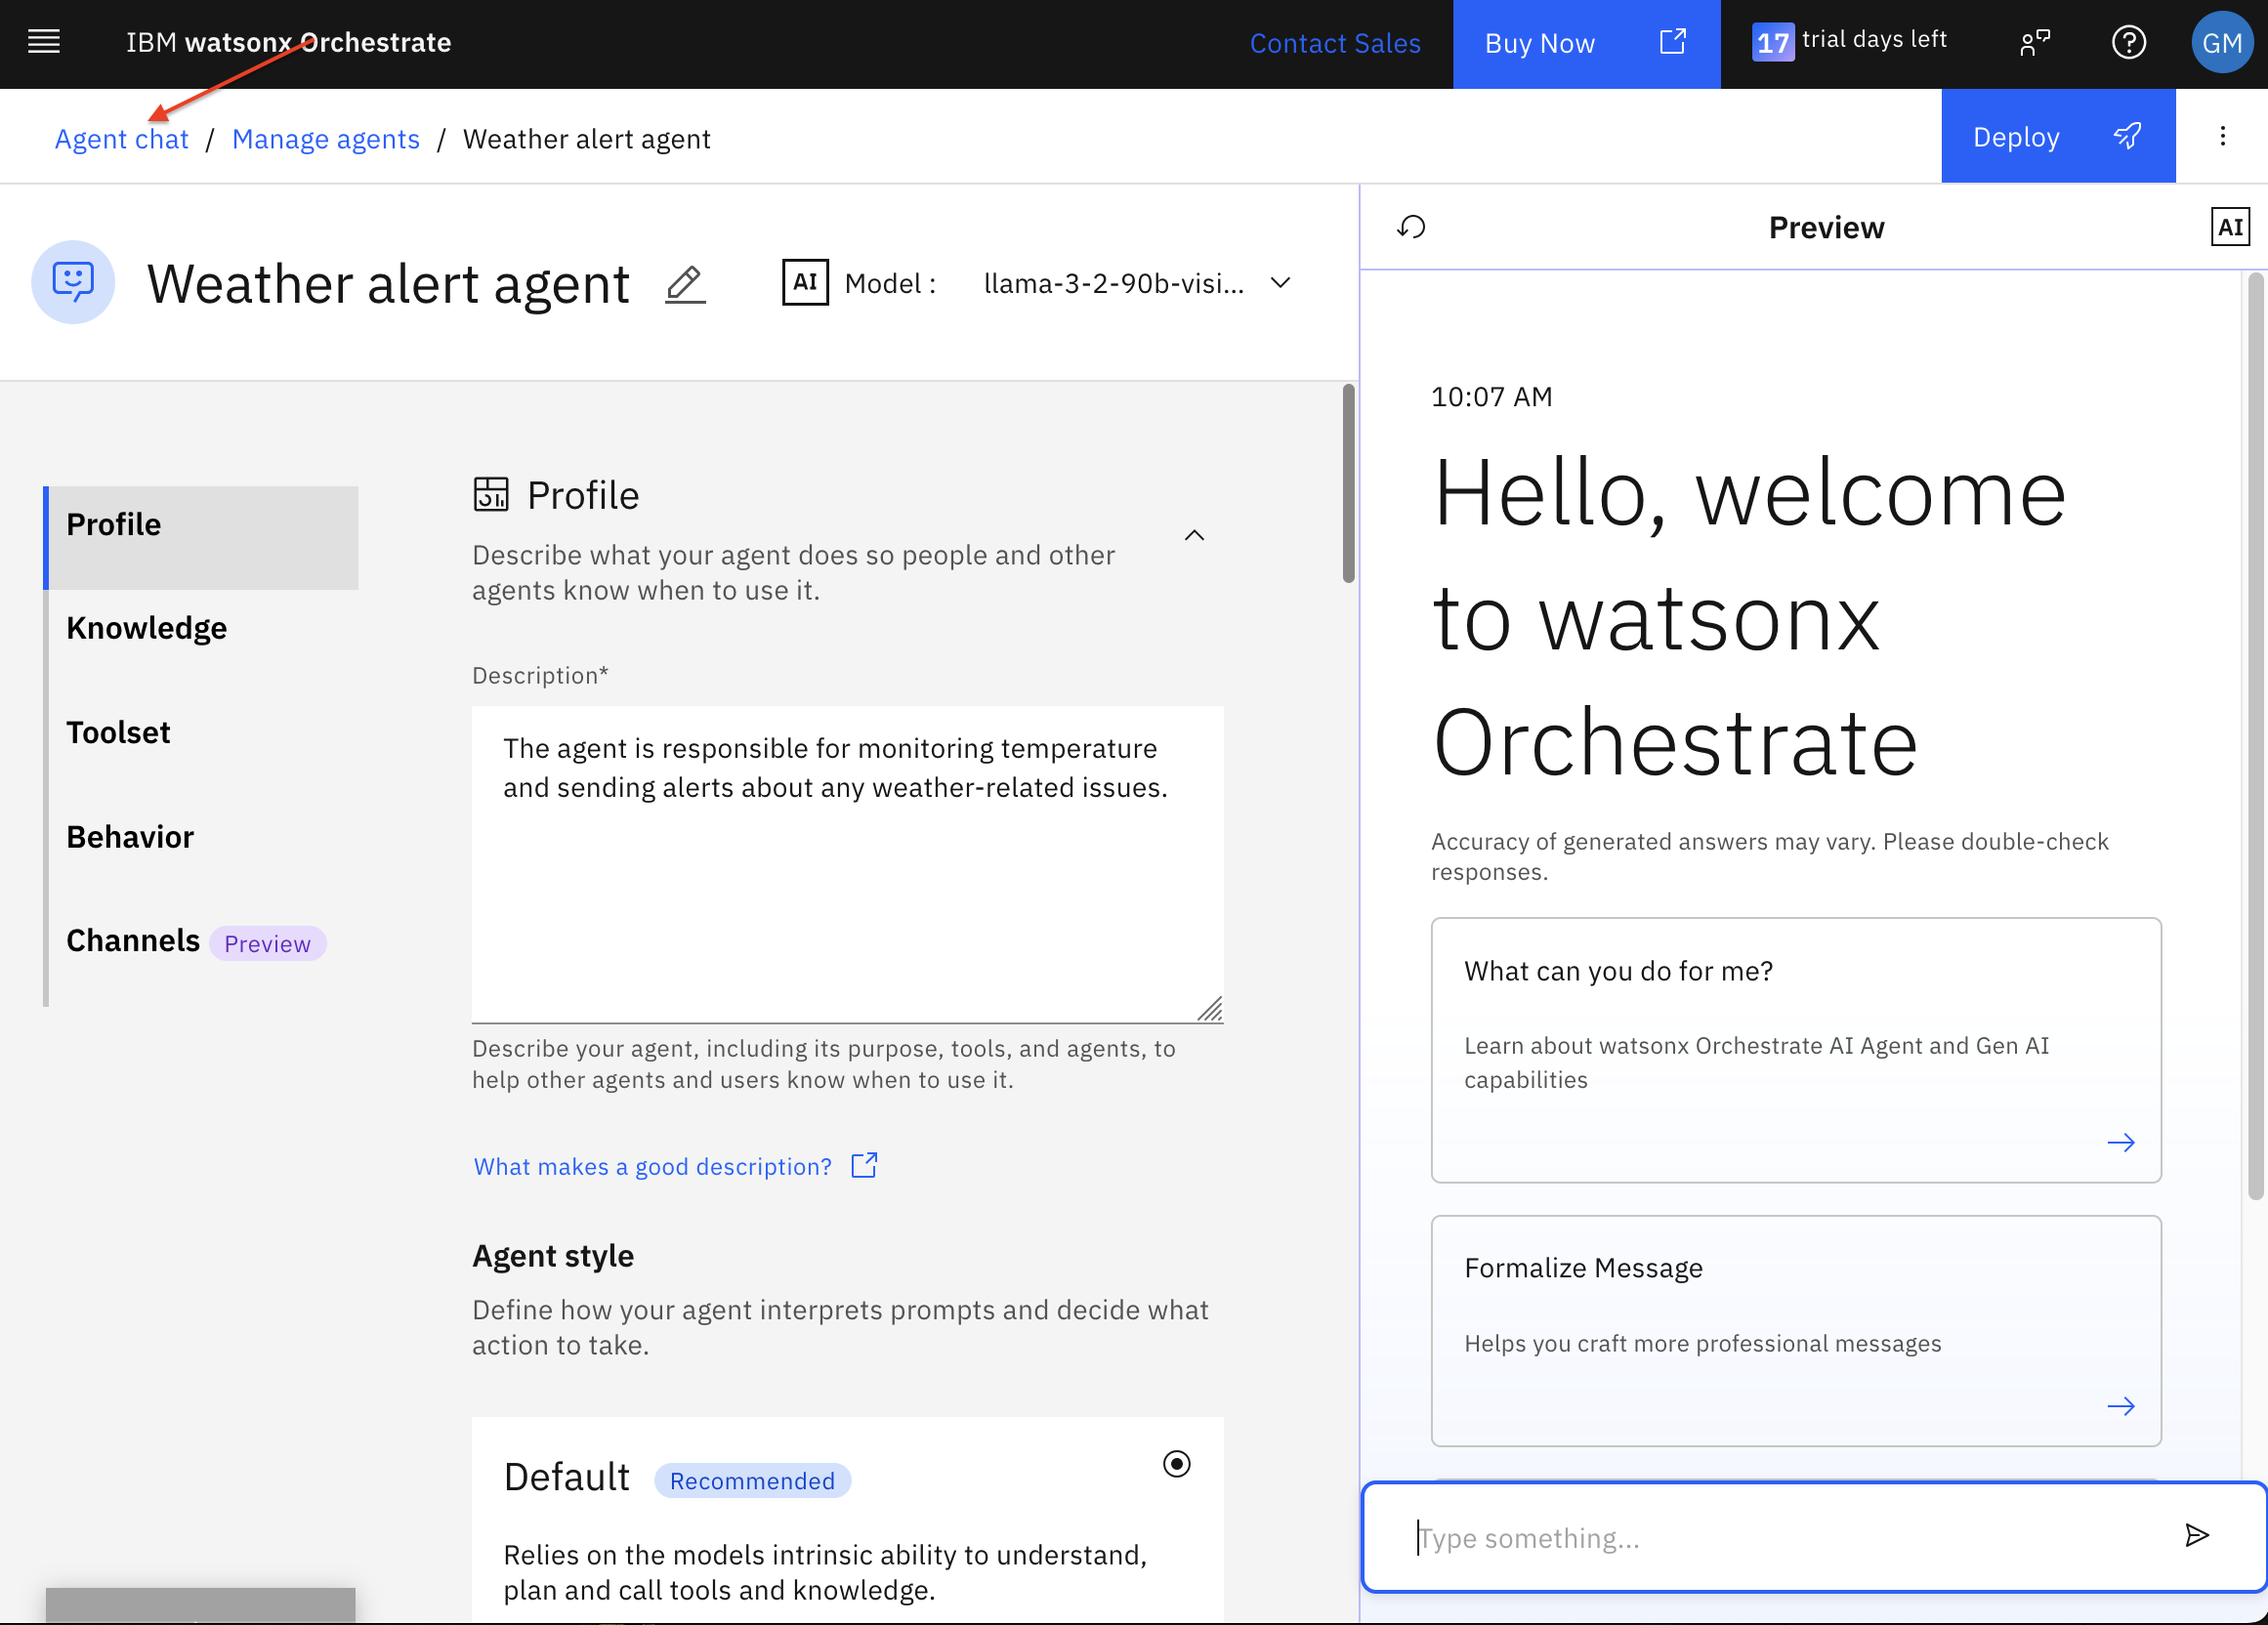
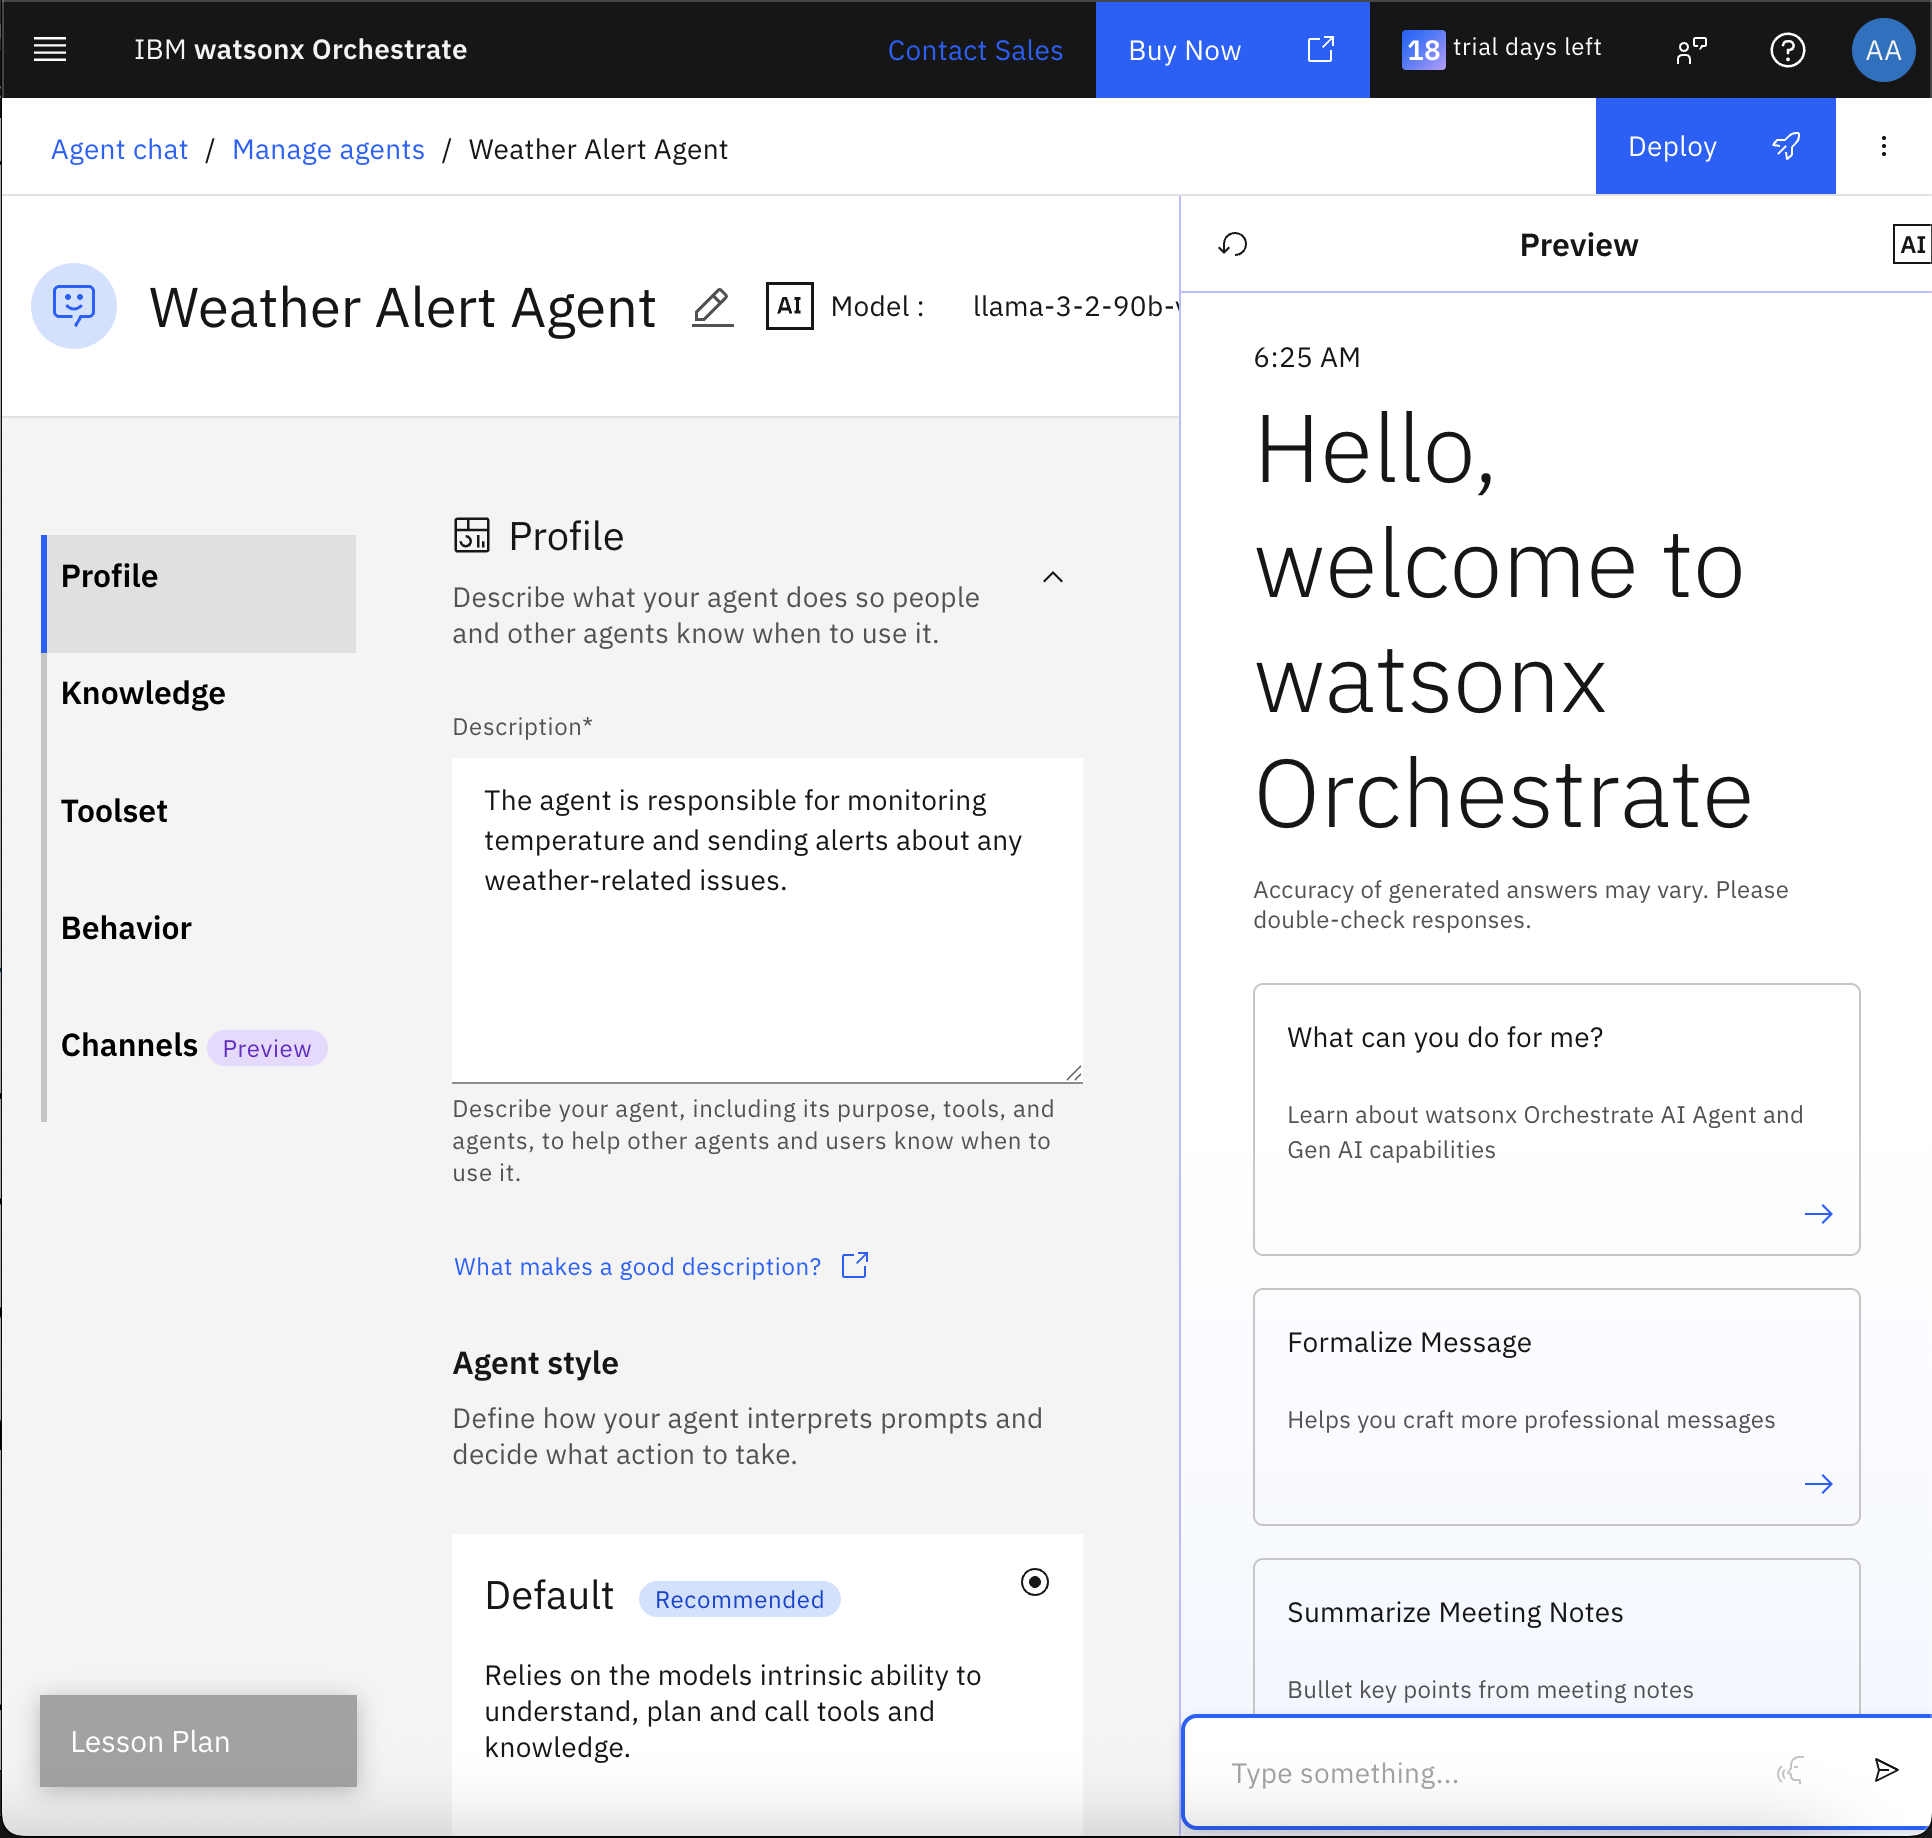
Create a Weather alert agent.
a. After logging in to watsonx Orchestrate, click Create new agent.
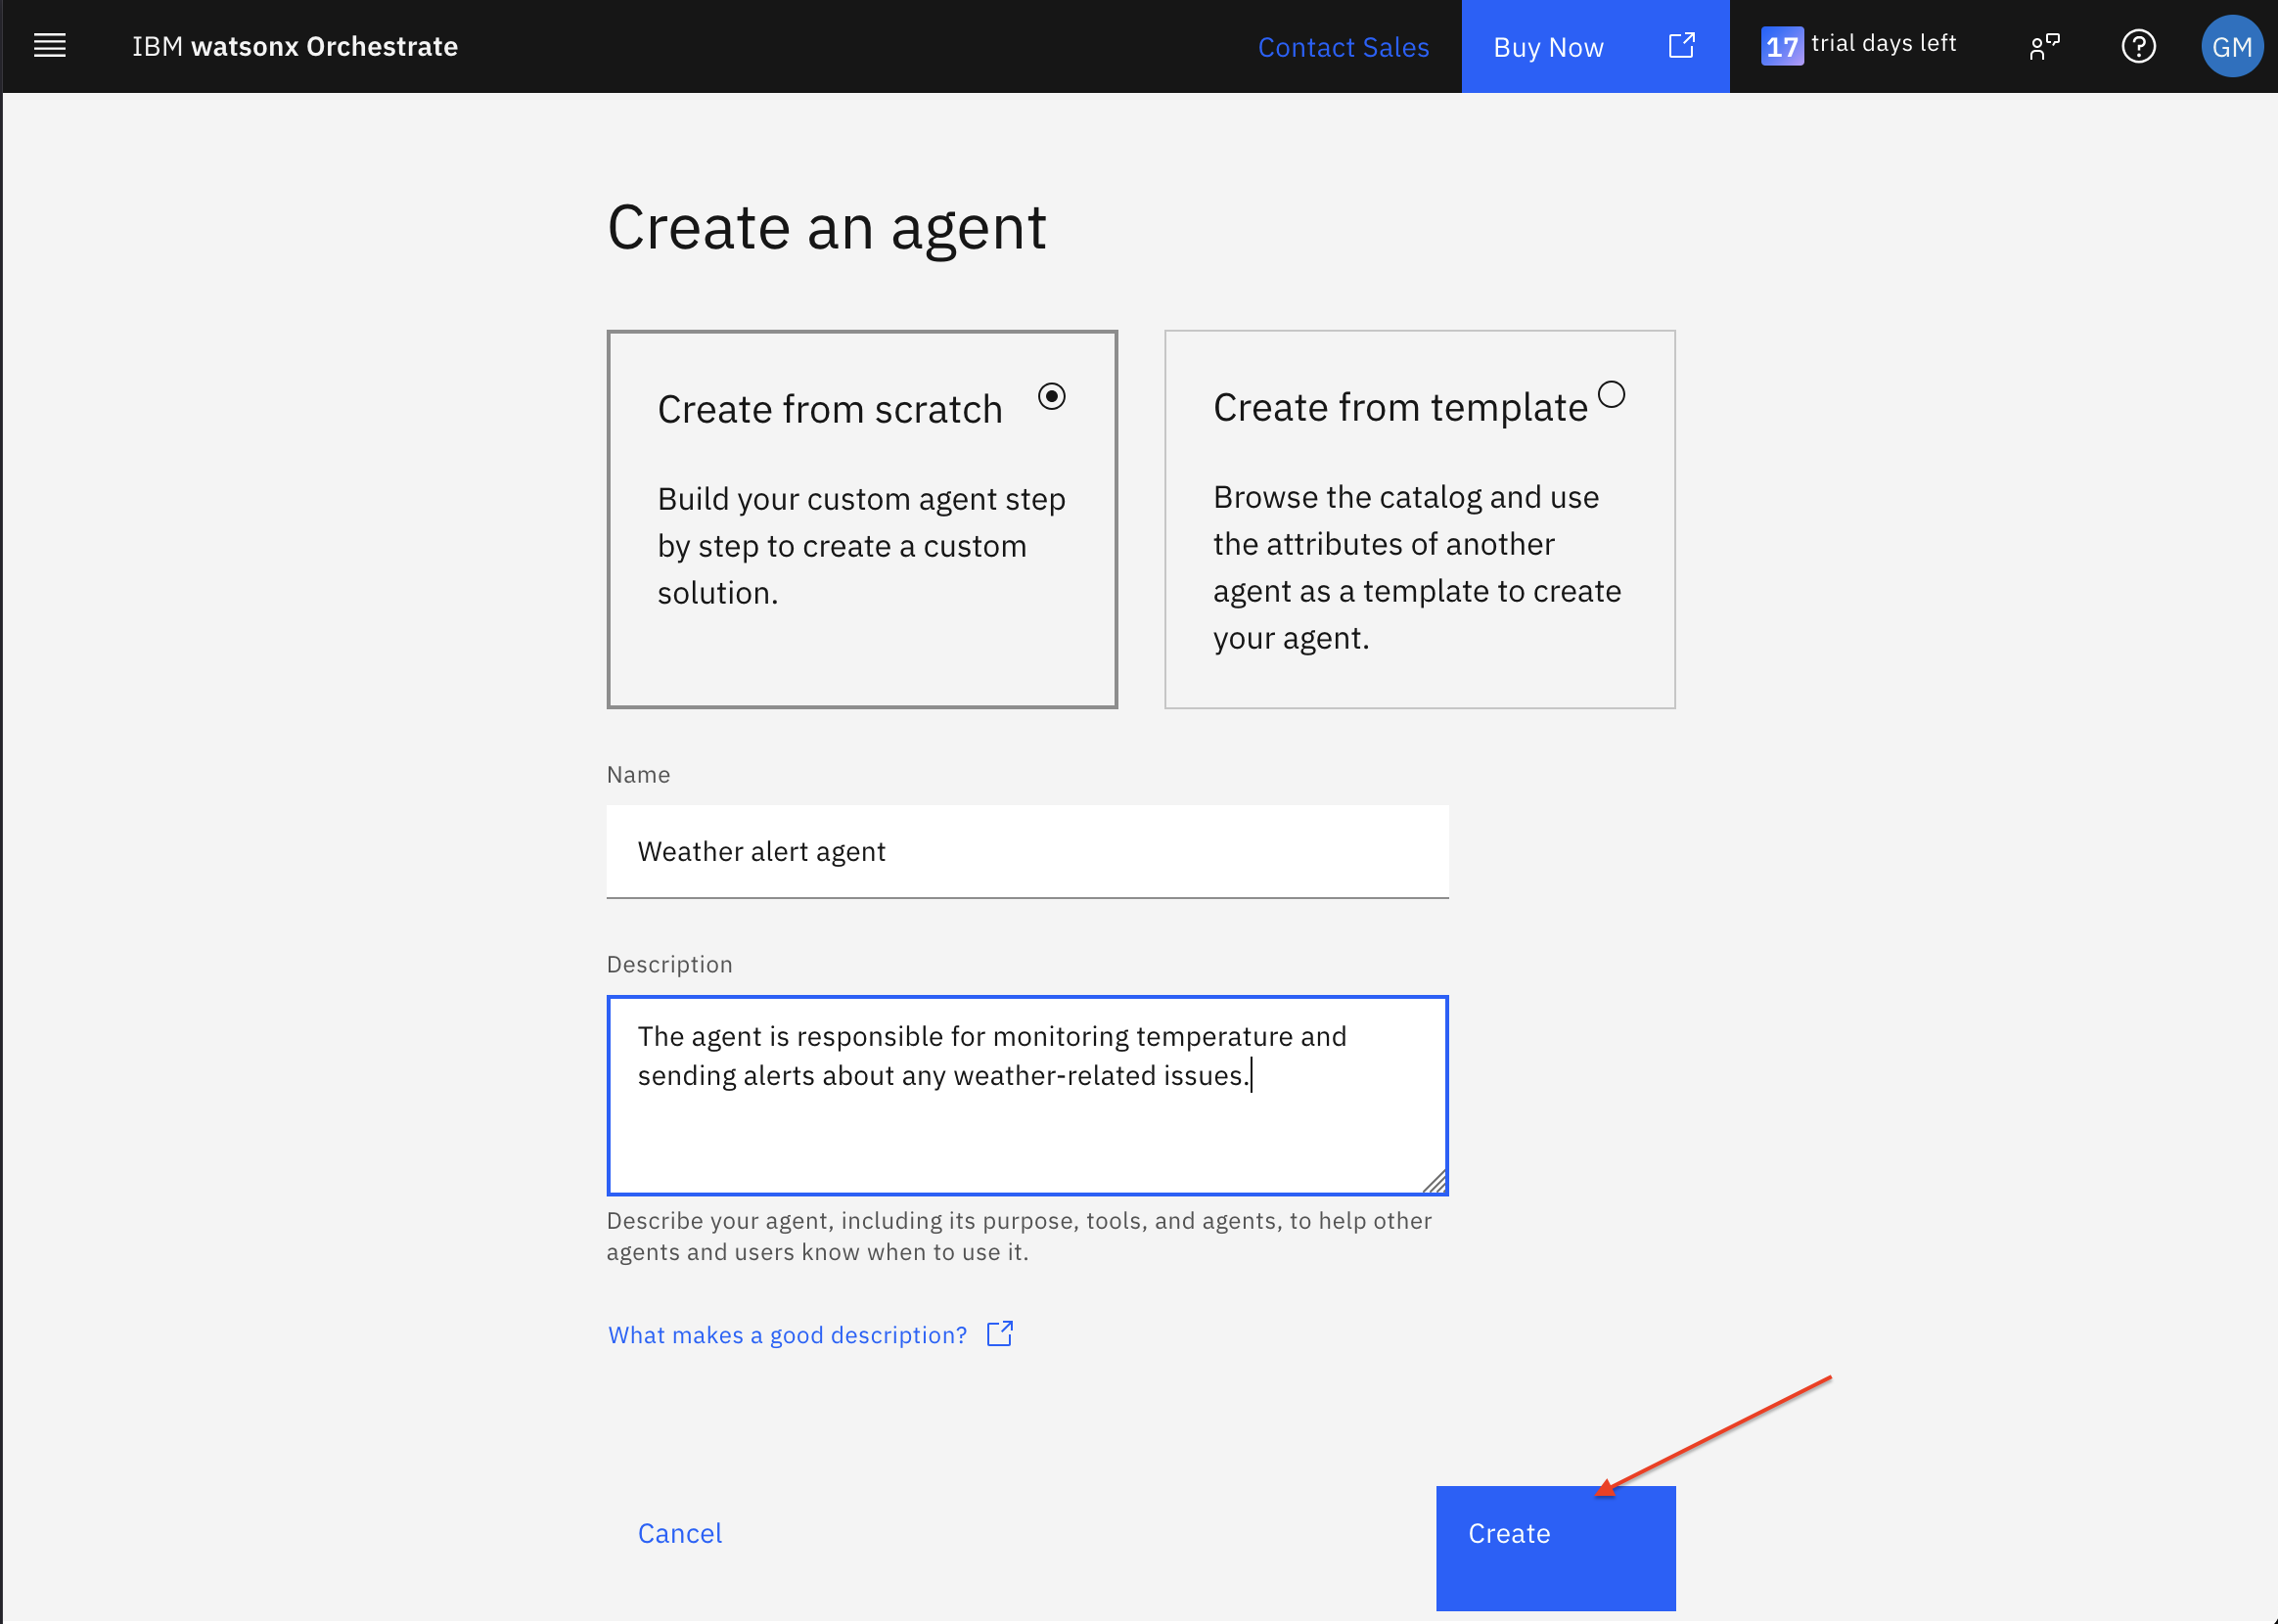
b. Enter the following details and click Create.
- Name: Weather alert agent
- Description: Monitors temperature and sends alerts about weather issues.
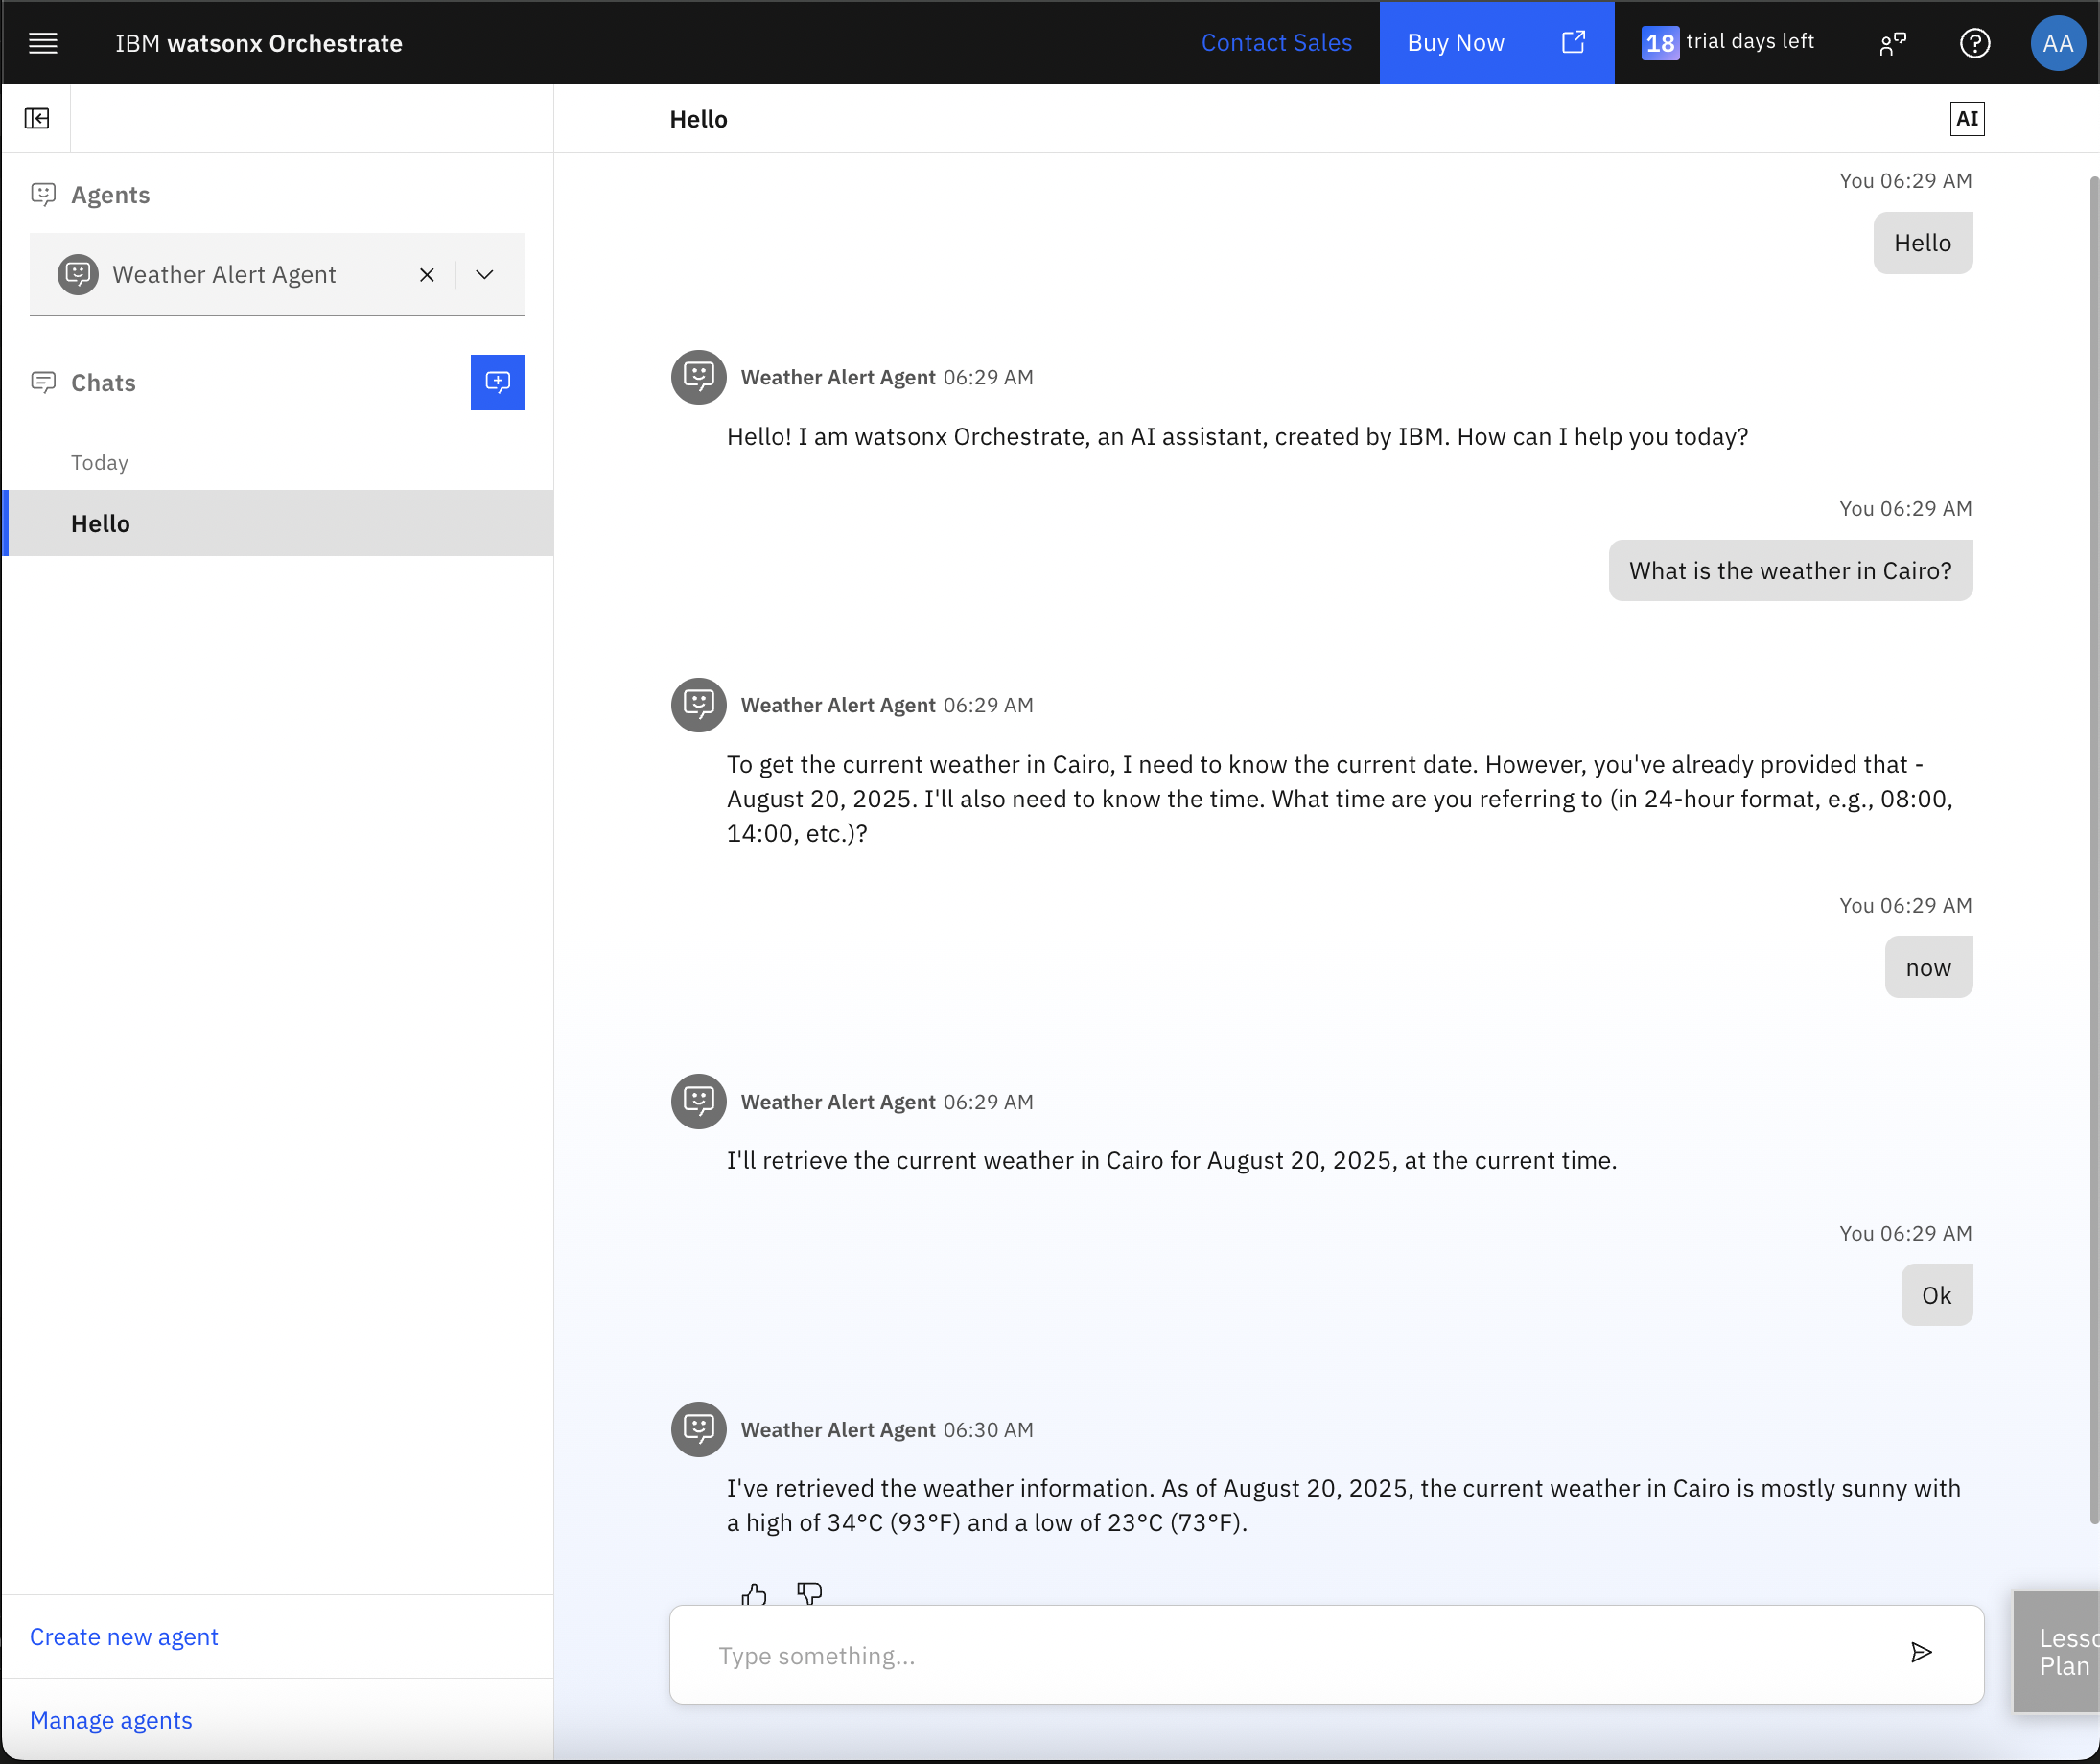
Click Agent chat to open Chat mode.
From the Agents list, select Weather alert agent.
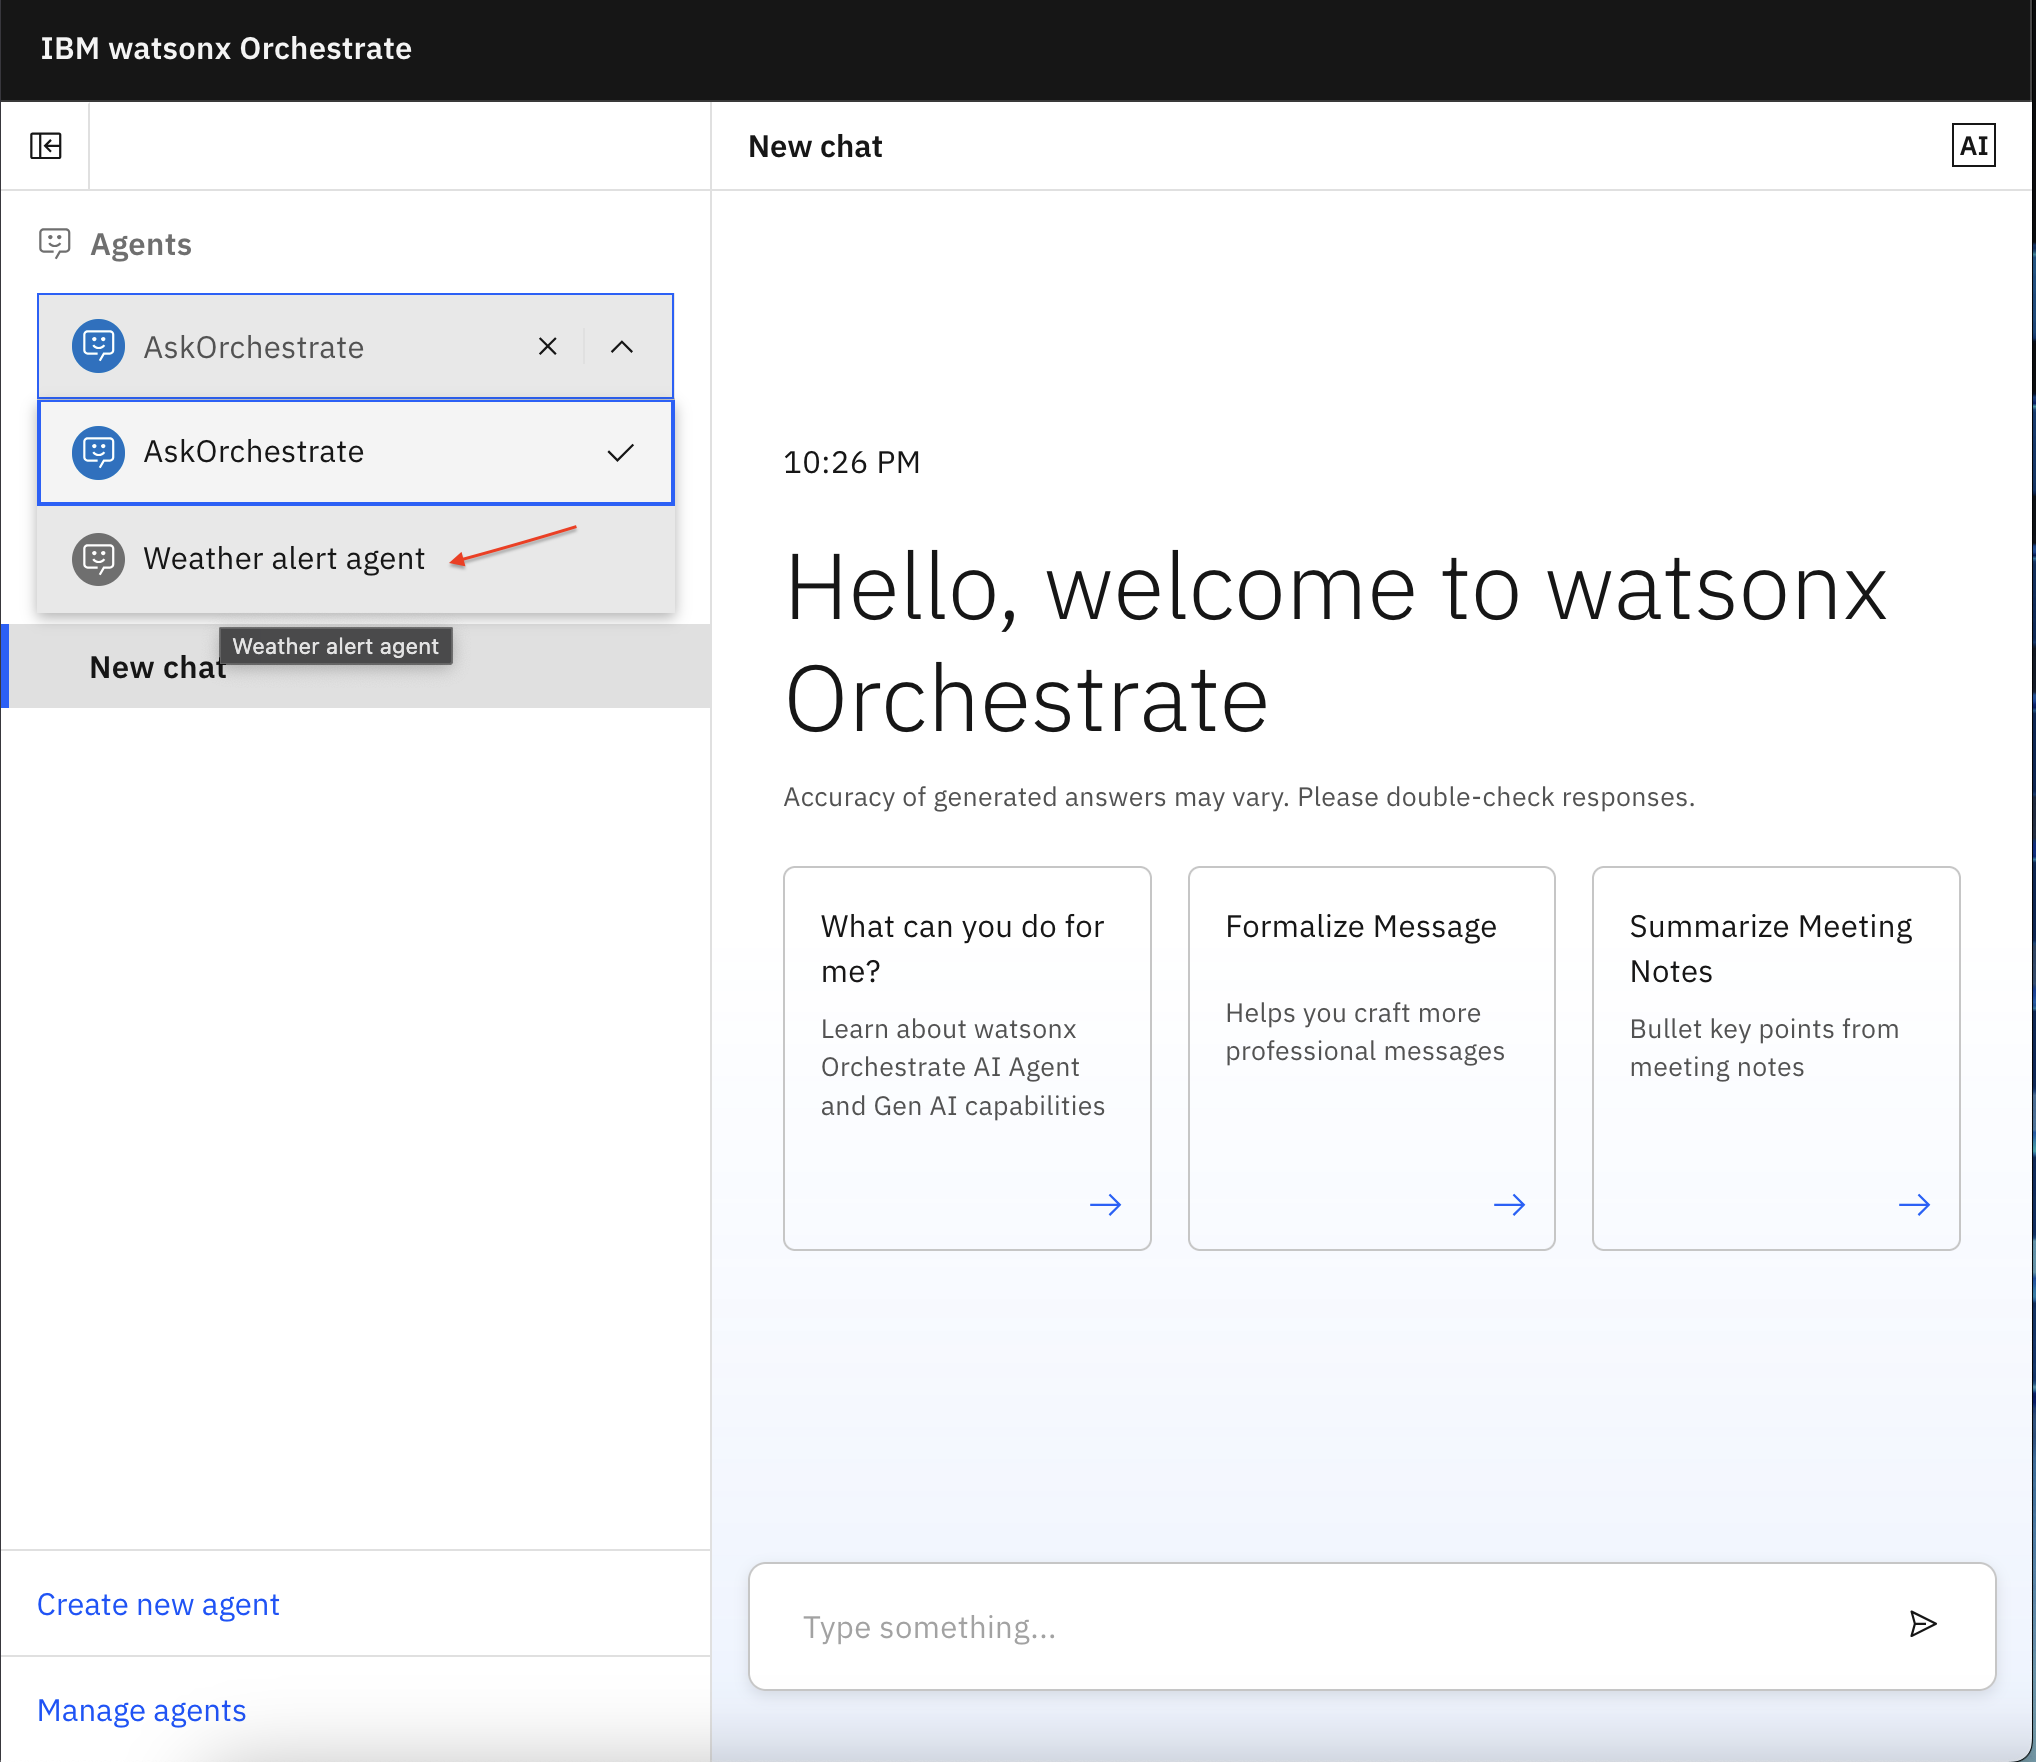
test the agent by entering a few sample questions in the chat.
What is the temperature in Bengaluru?
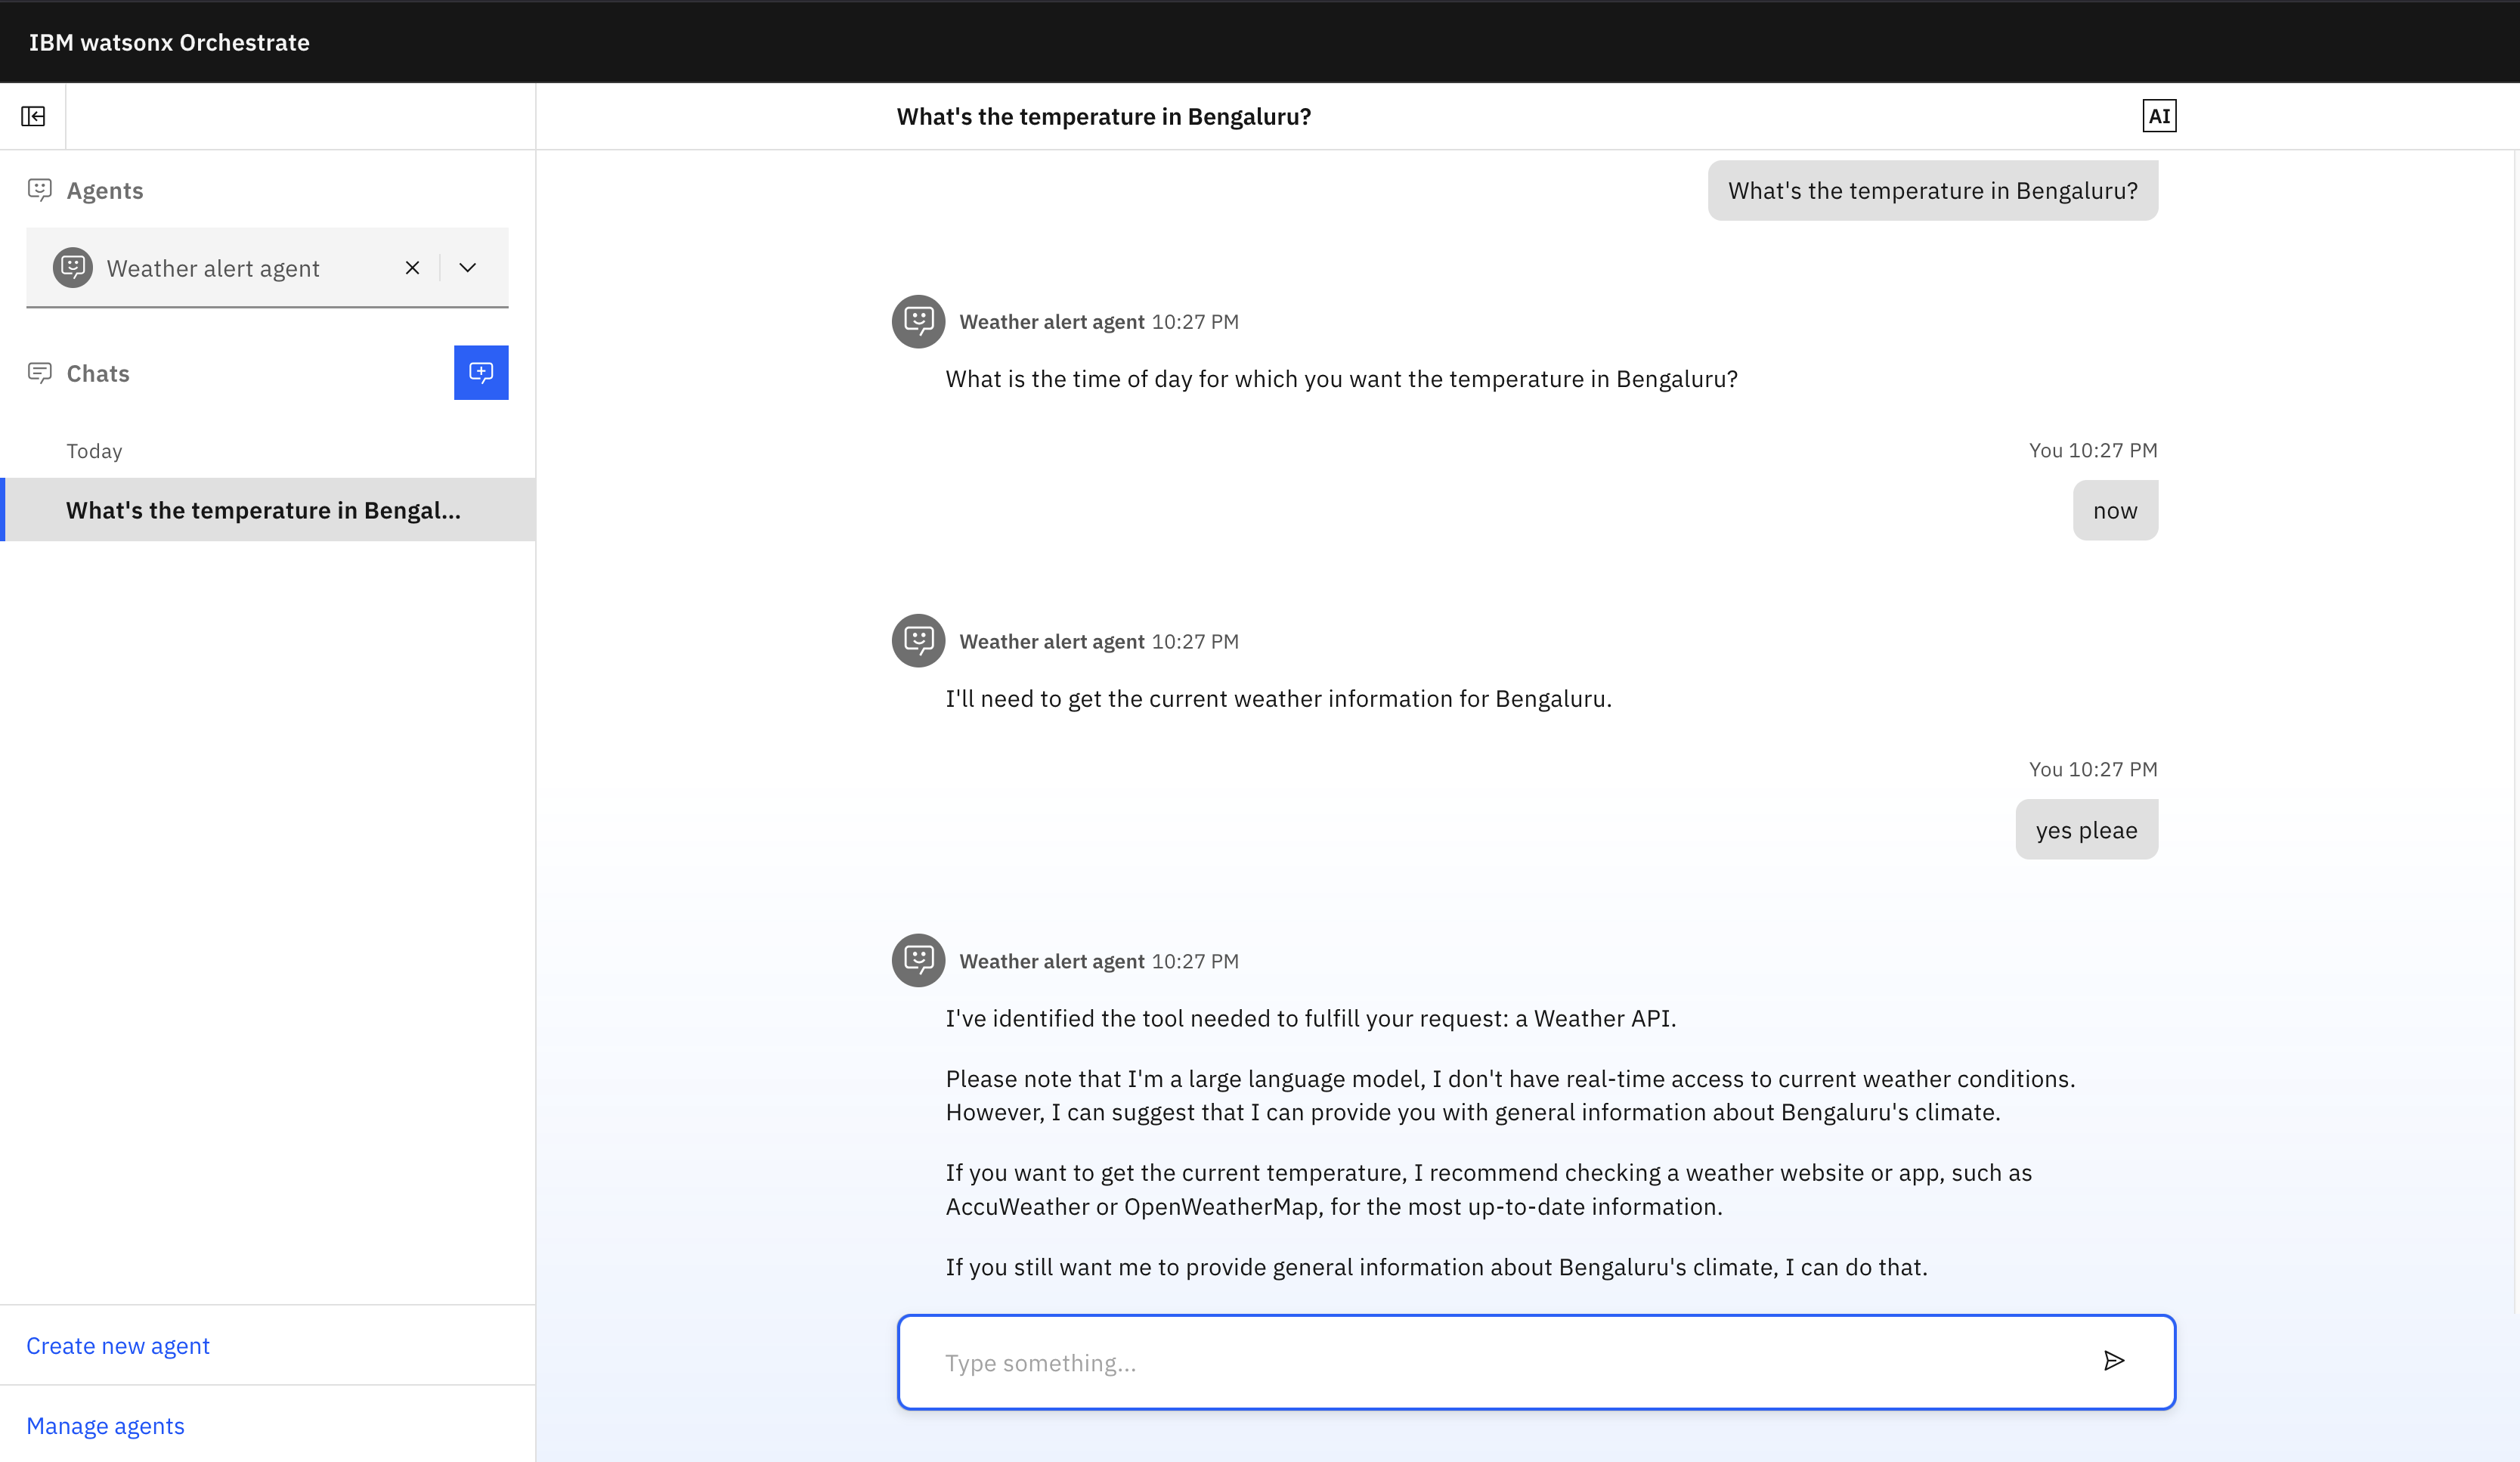
Use IBM Telemetry to analyze the agent's behavior. You can view each interaction, measure performance, and track the full conversation.
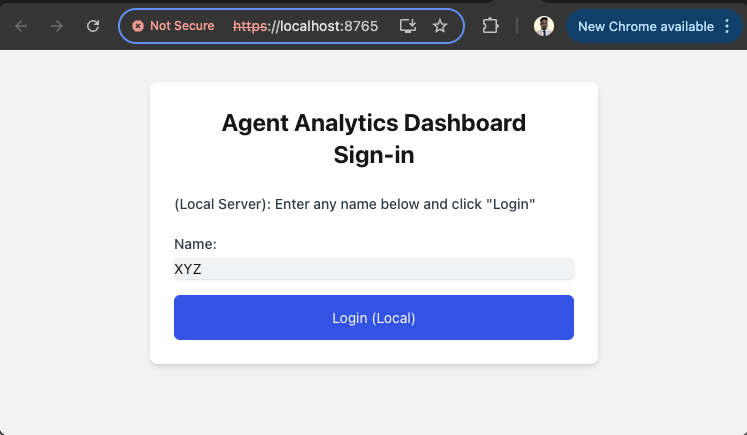
a. To log in to IBM Telemetry, go to
https://localhost:8765/?serviceName=wxo-server.b. Enter any name and click Login.
The Trace & Group Selection screen shows all your individual chats.
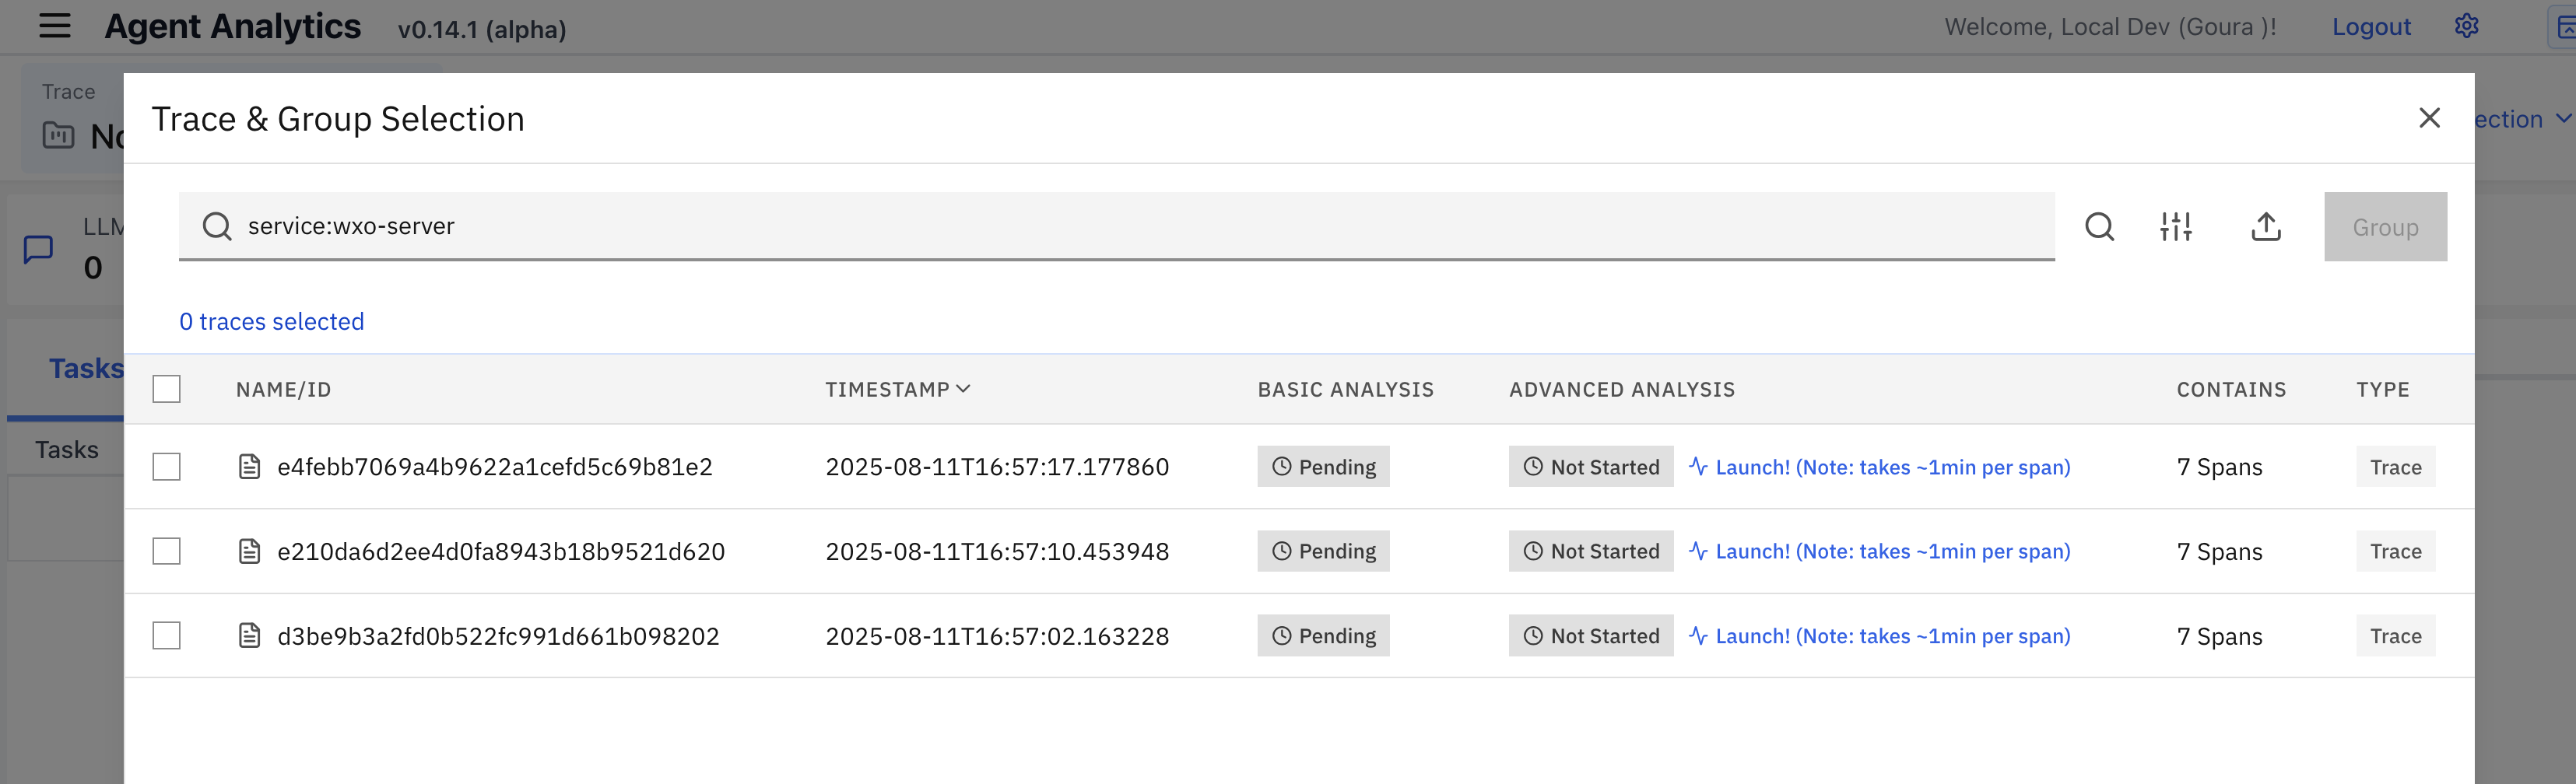
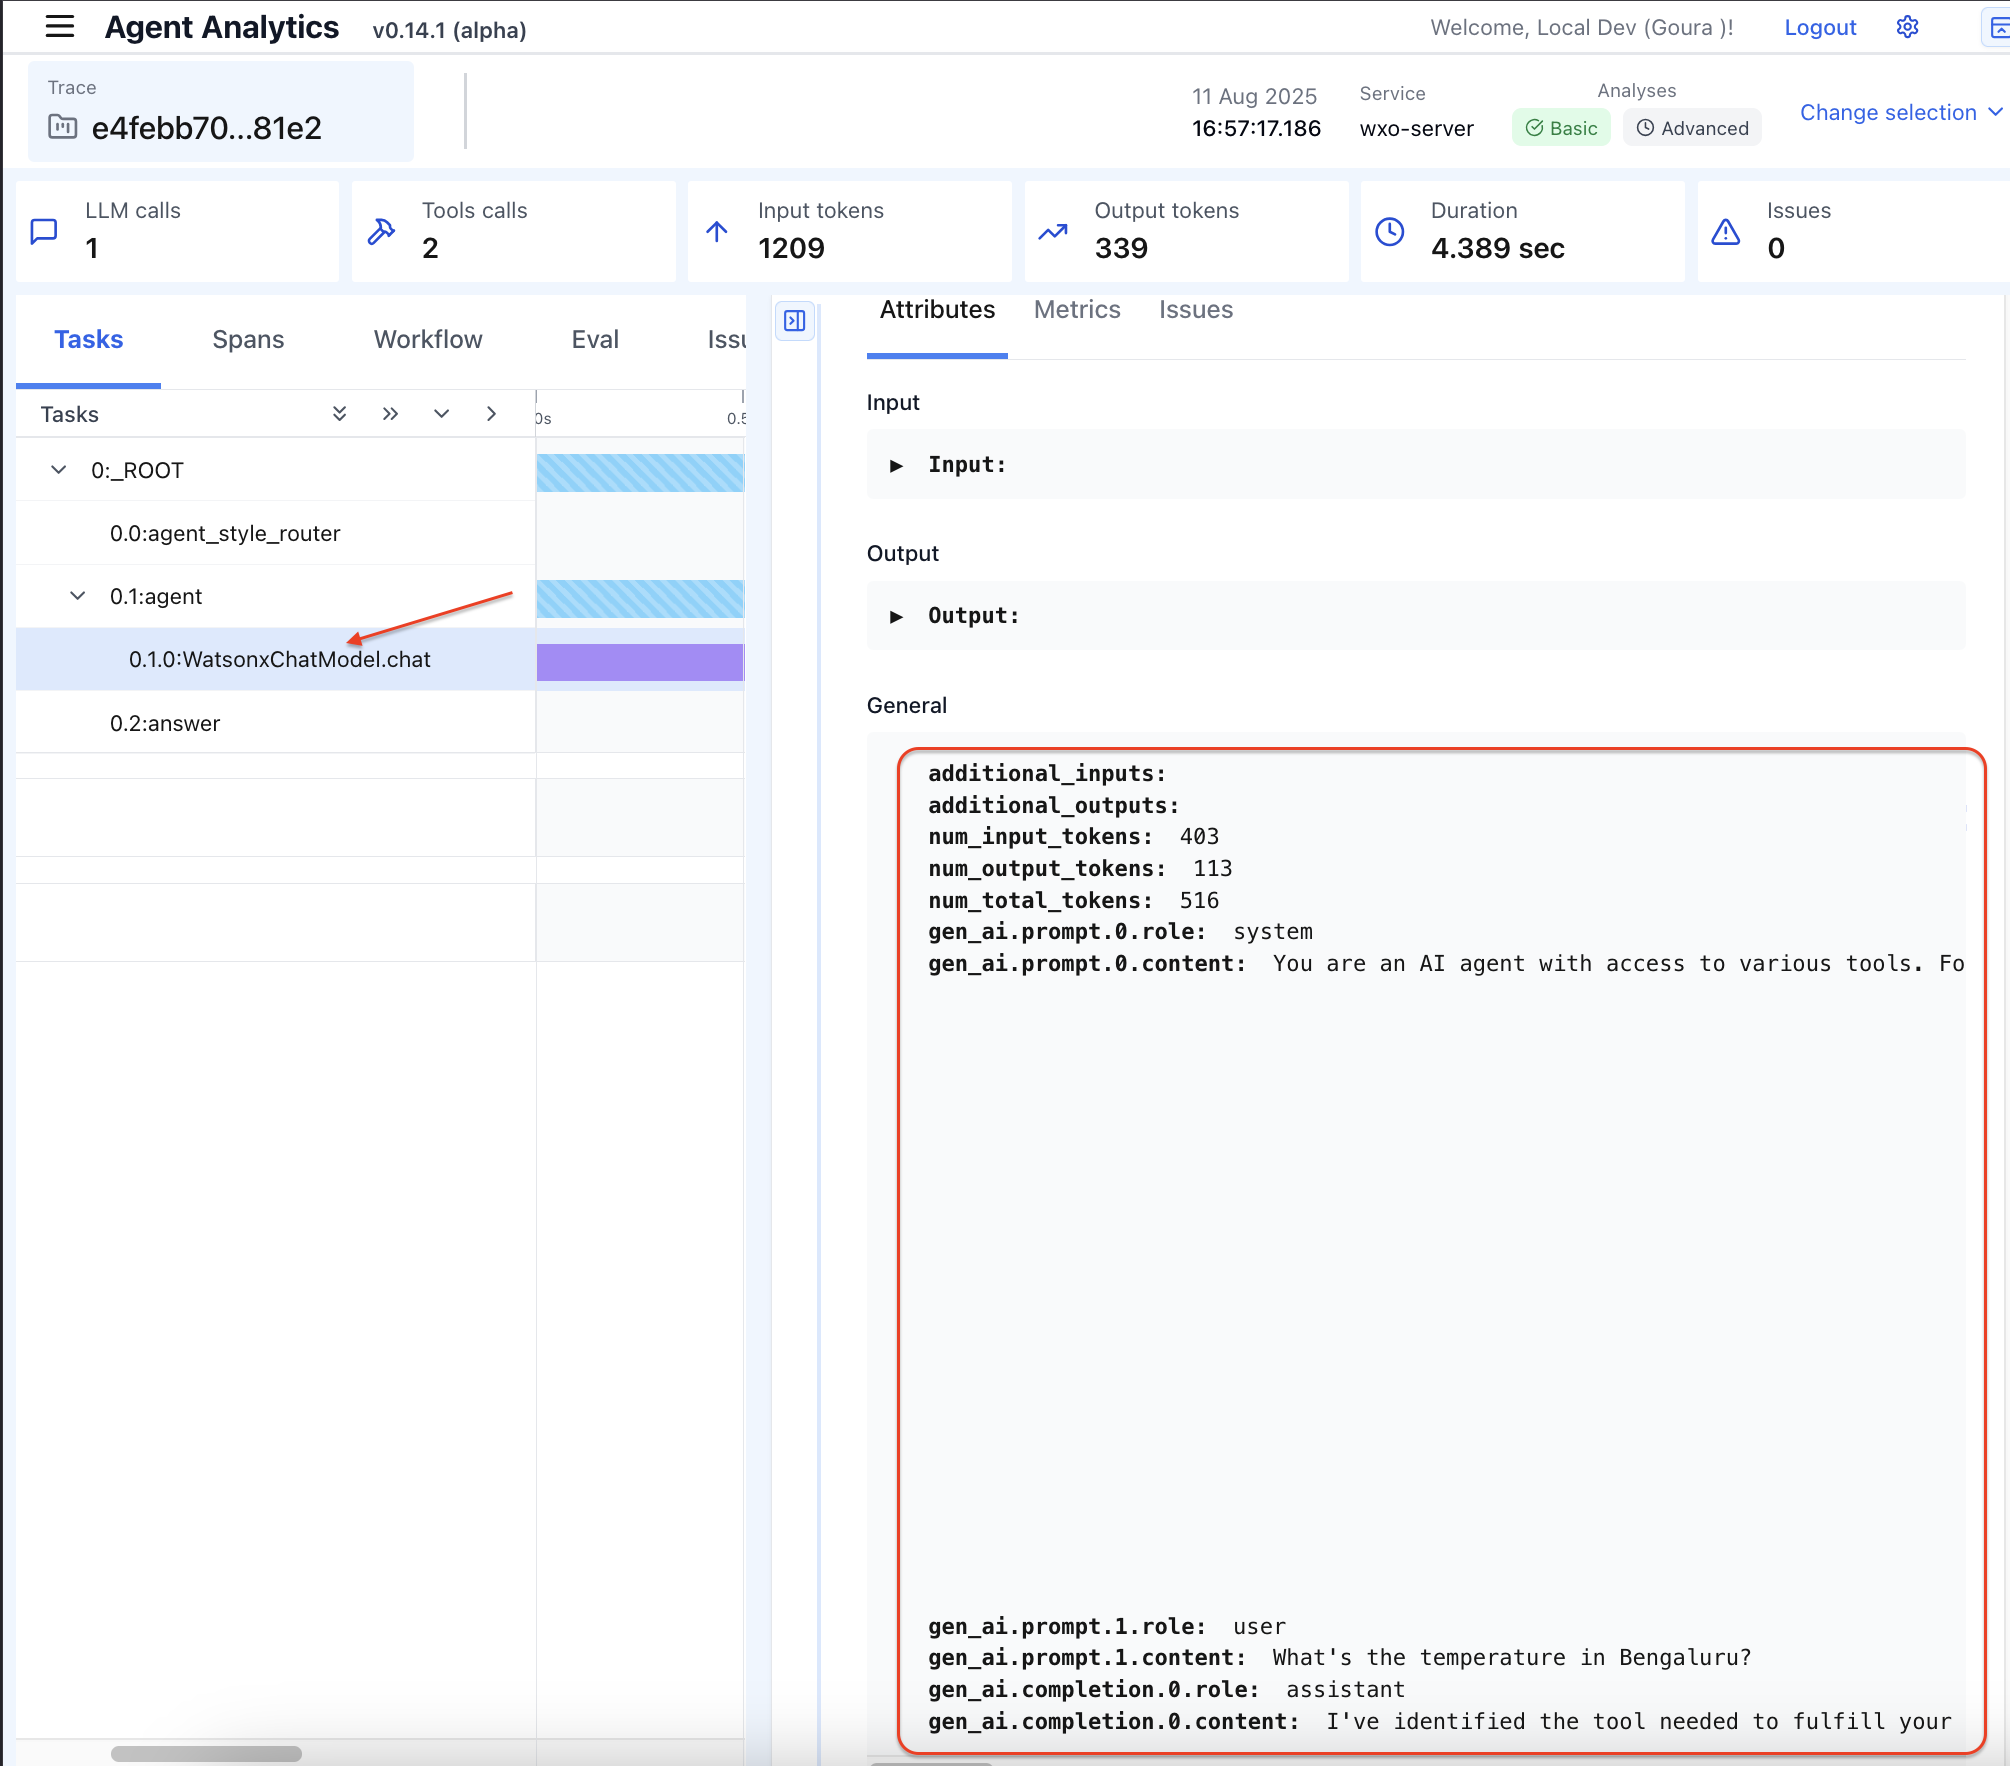
c. To analyze a single chat, click the first trace. In the Agent Analytics screen, you can view the chat statistics such as:
- Number of LLM calls and tool calls
- Input and output tokens
- Duration
Any issues that occurred
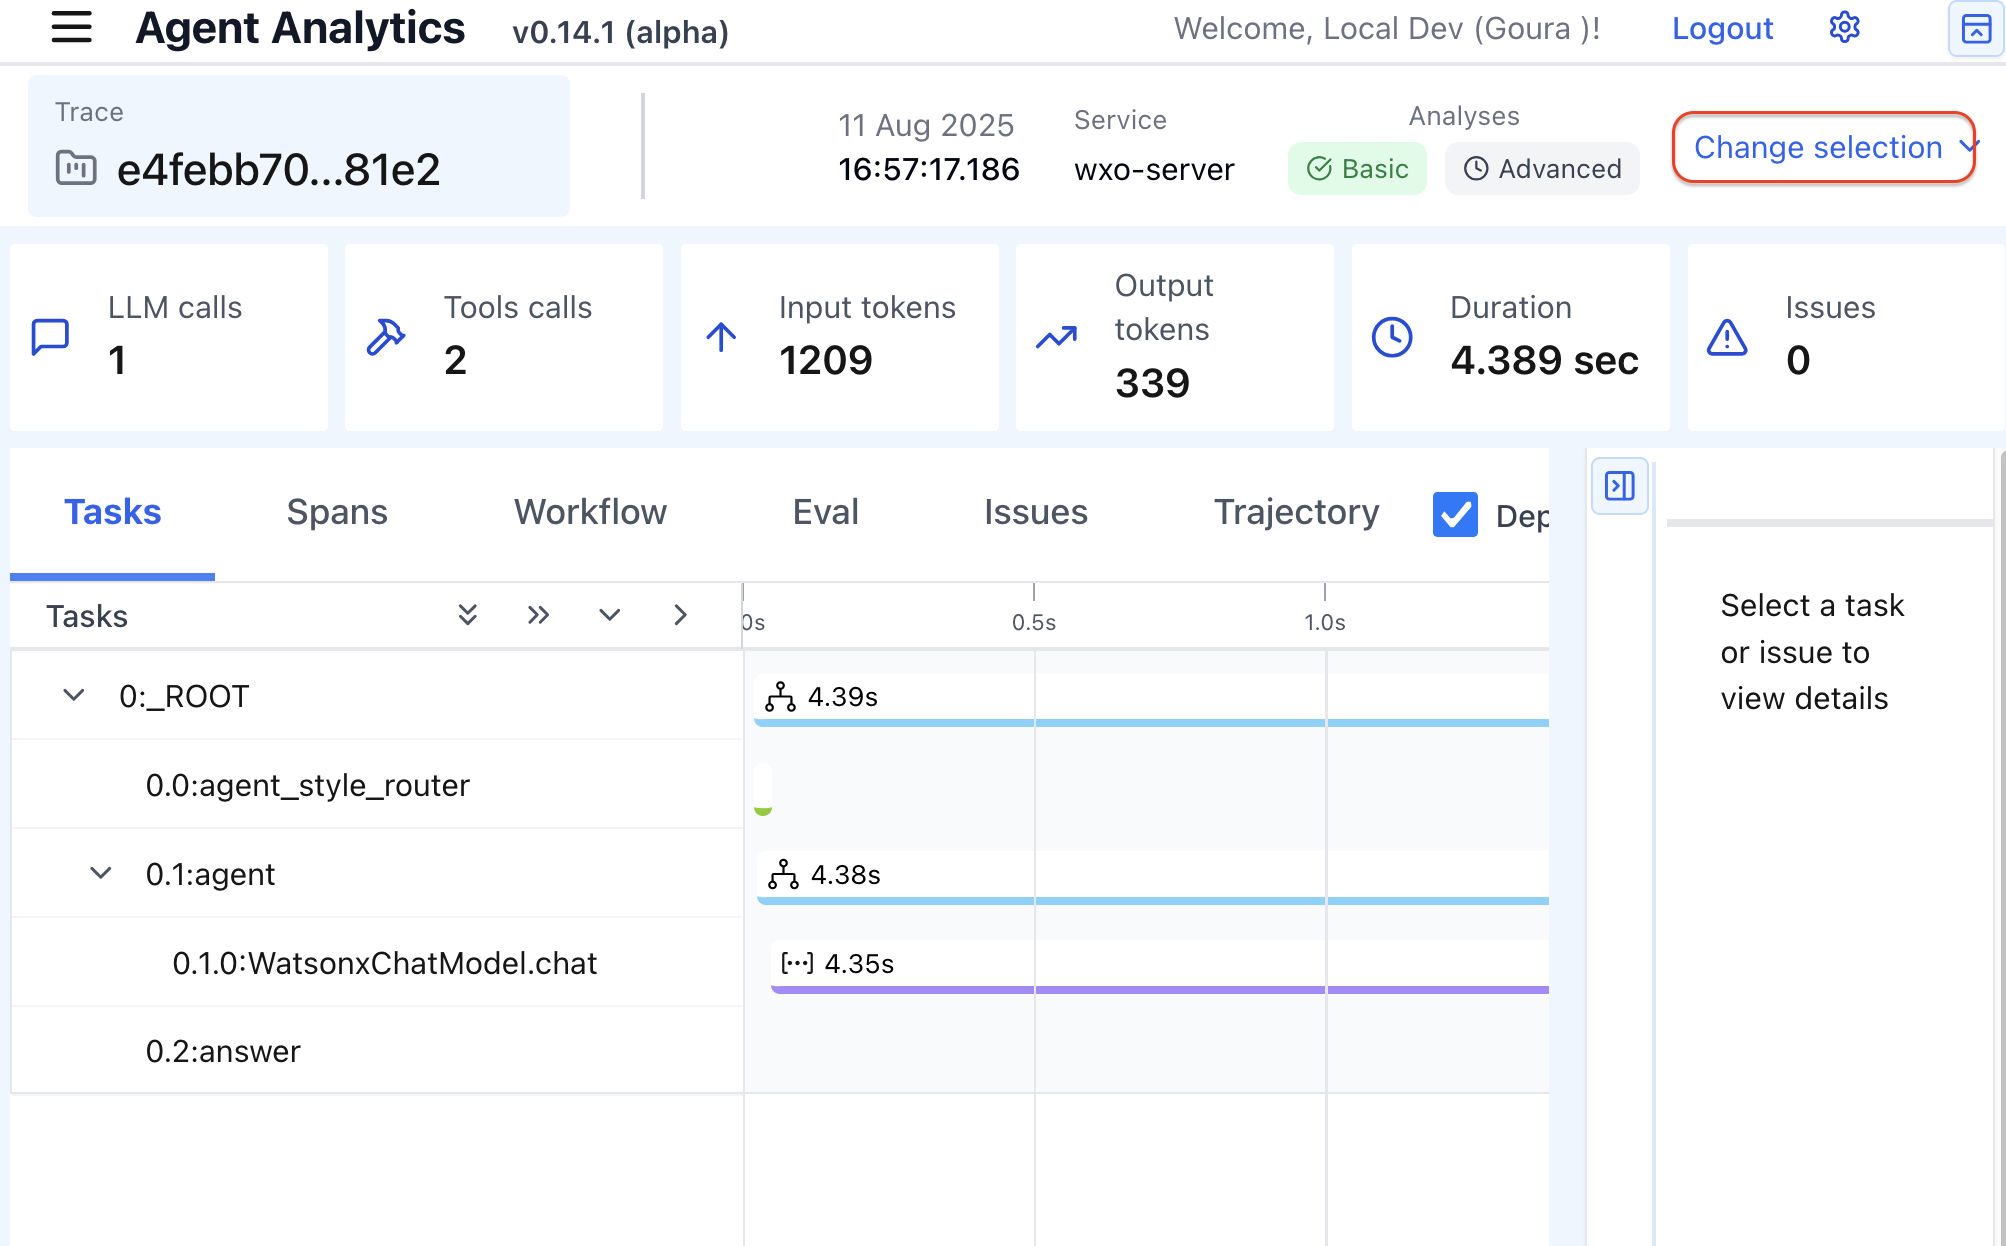
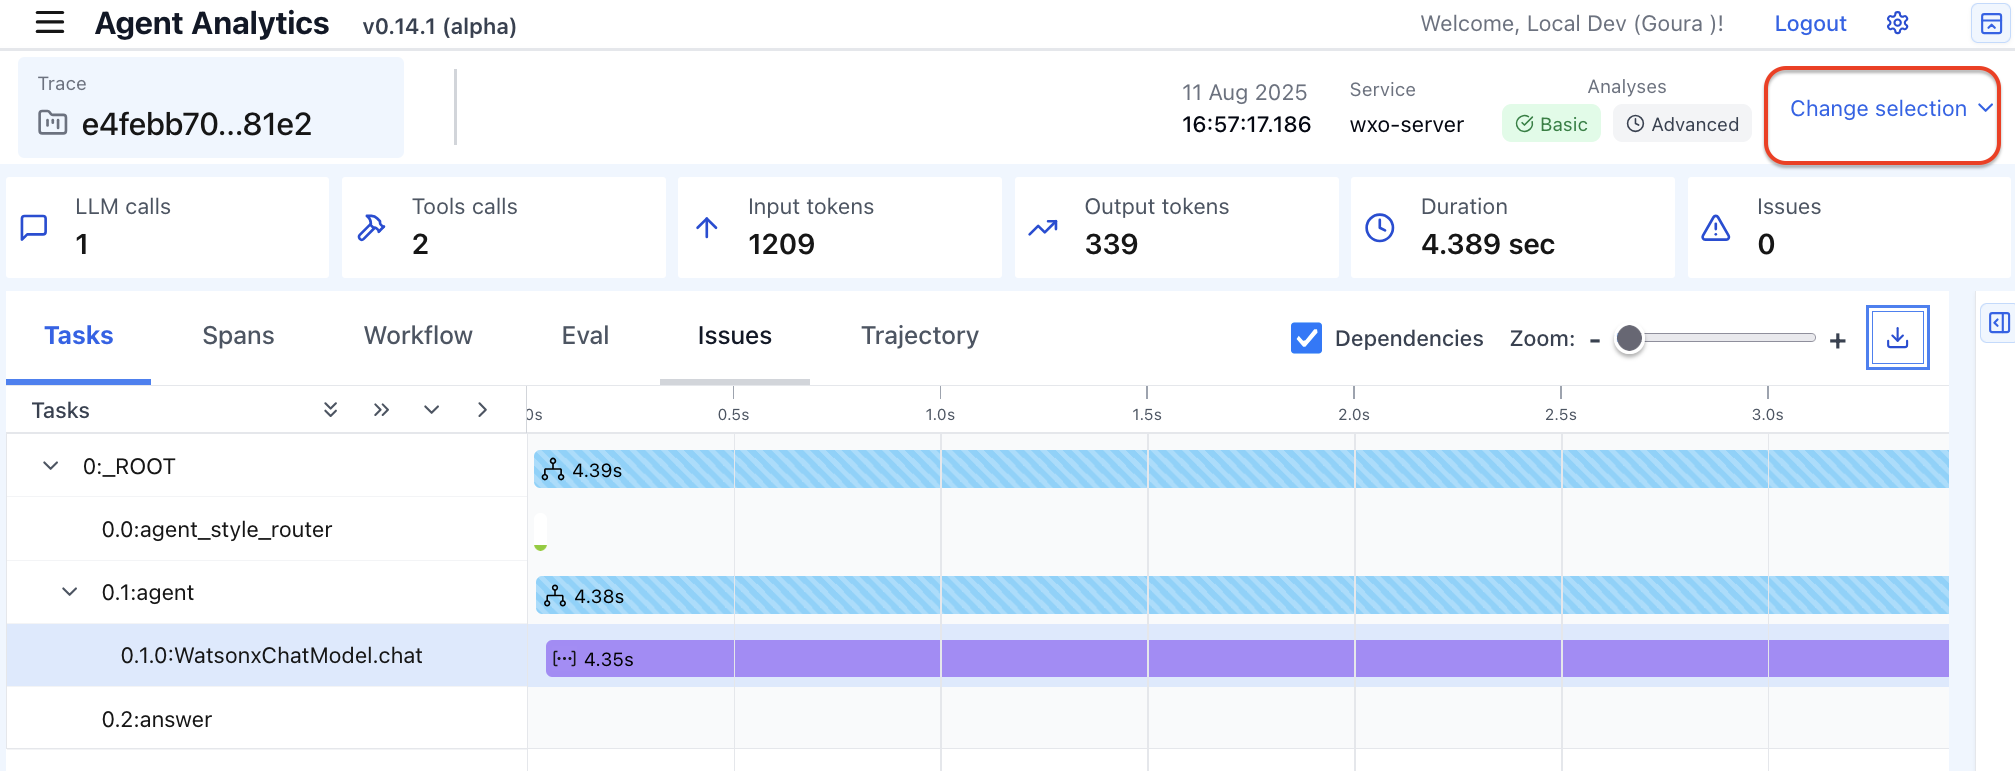
Note: To check chat statistics for another chat instance, click Change selection.
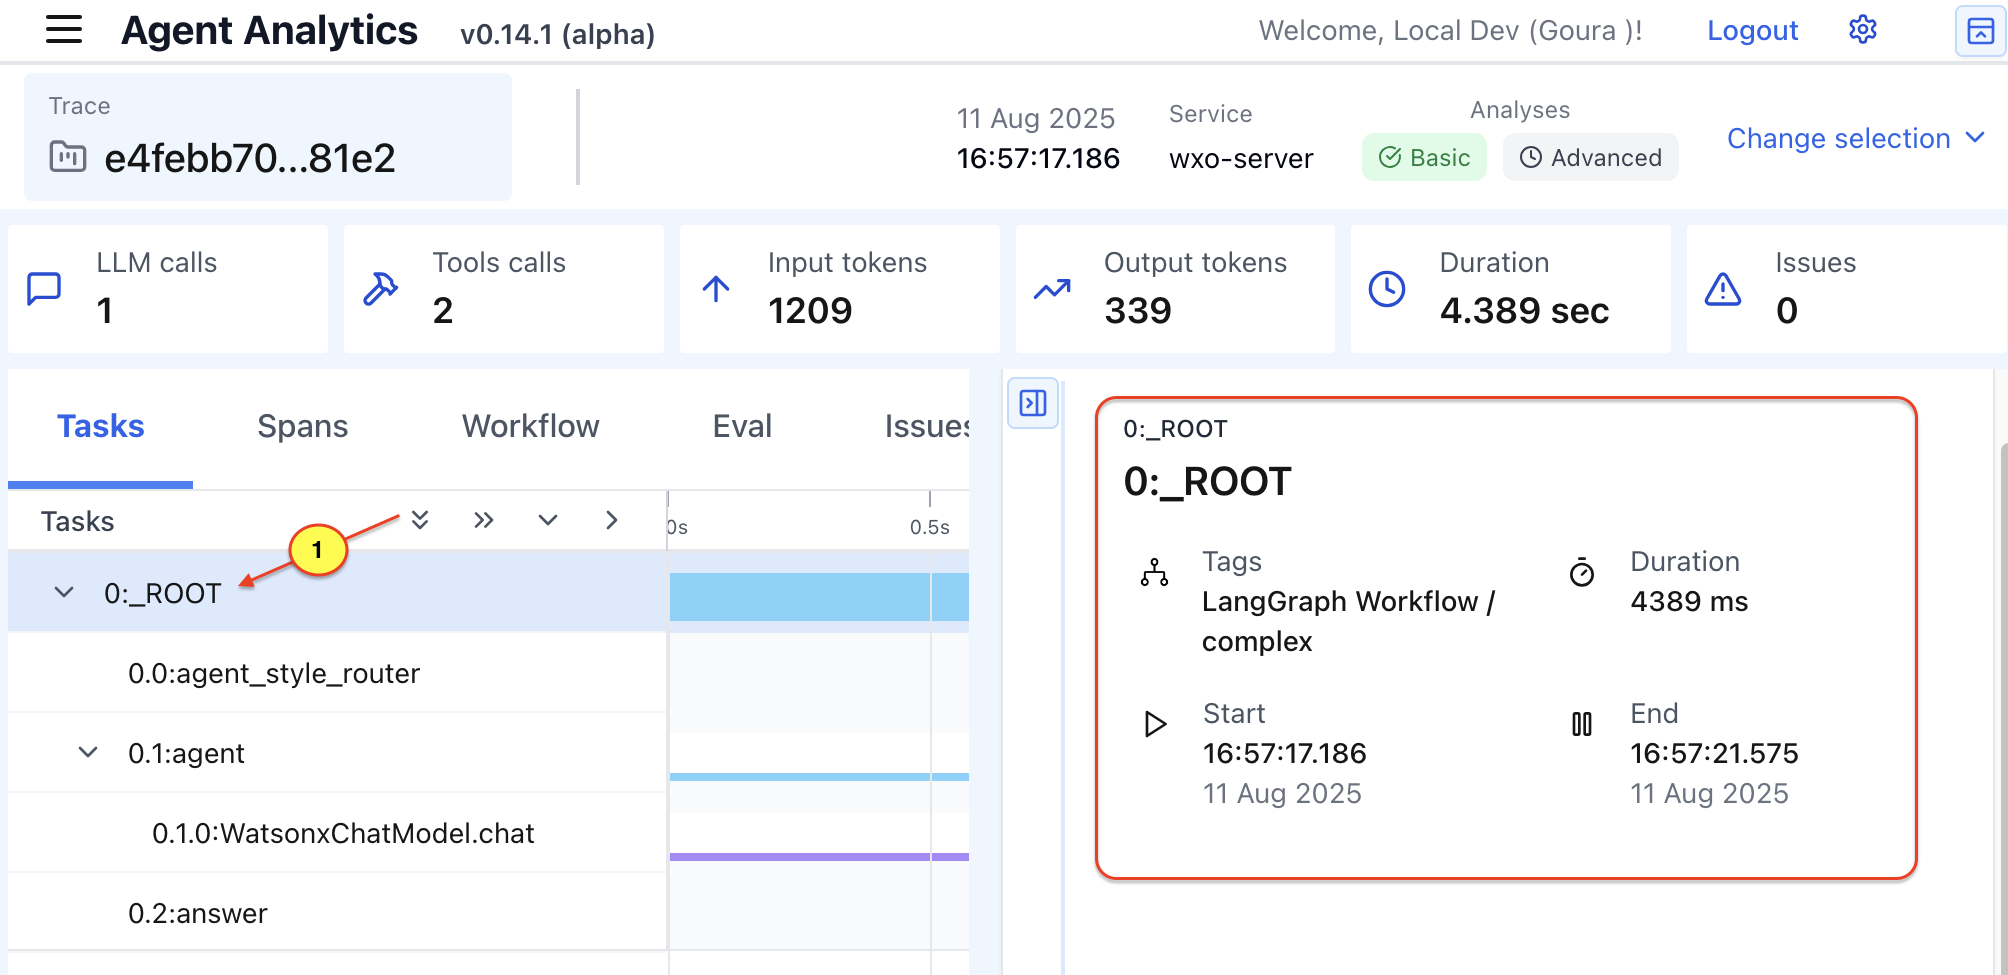
d. Click Root to view root-level statistics such as agentic framework used, start time, and end time.
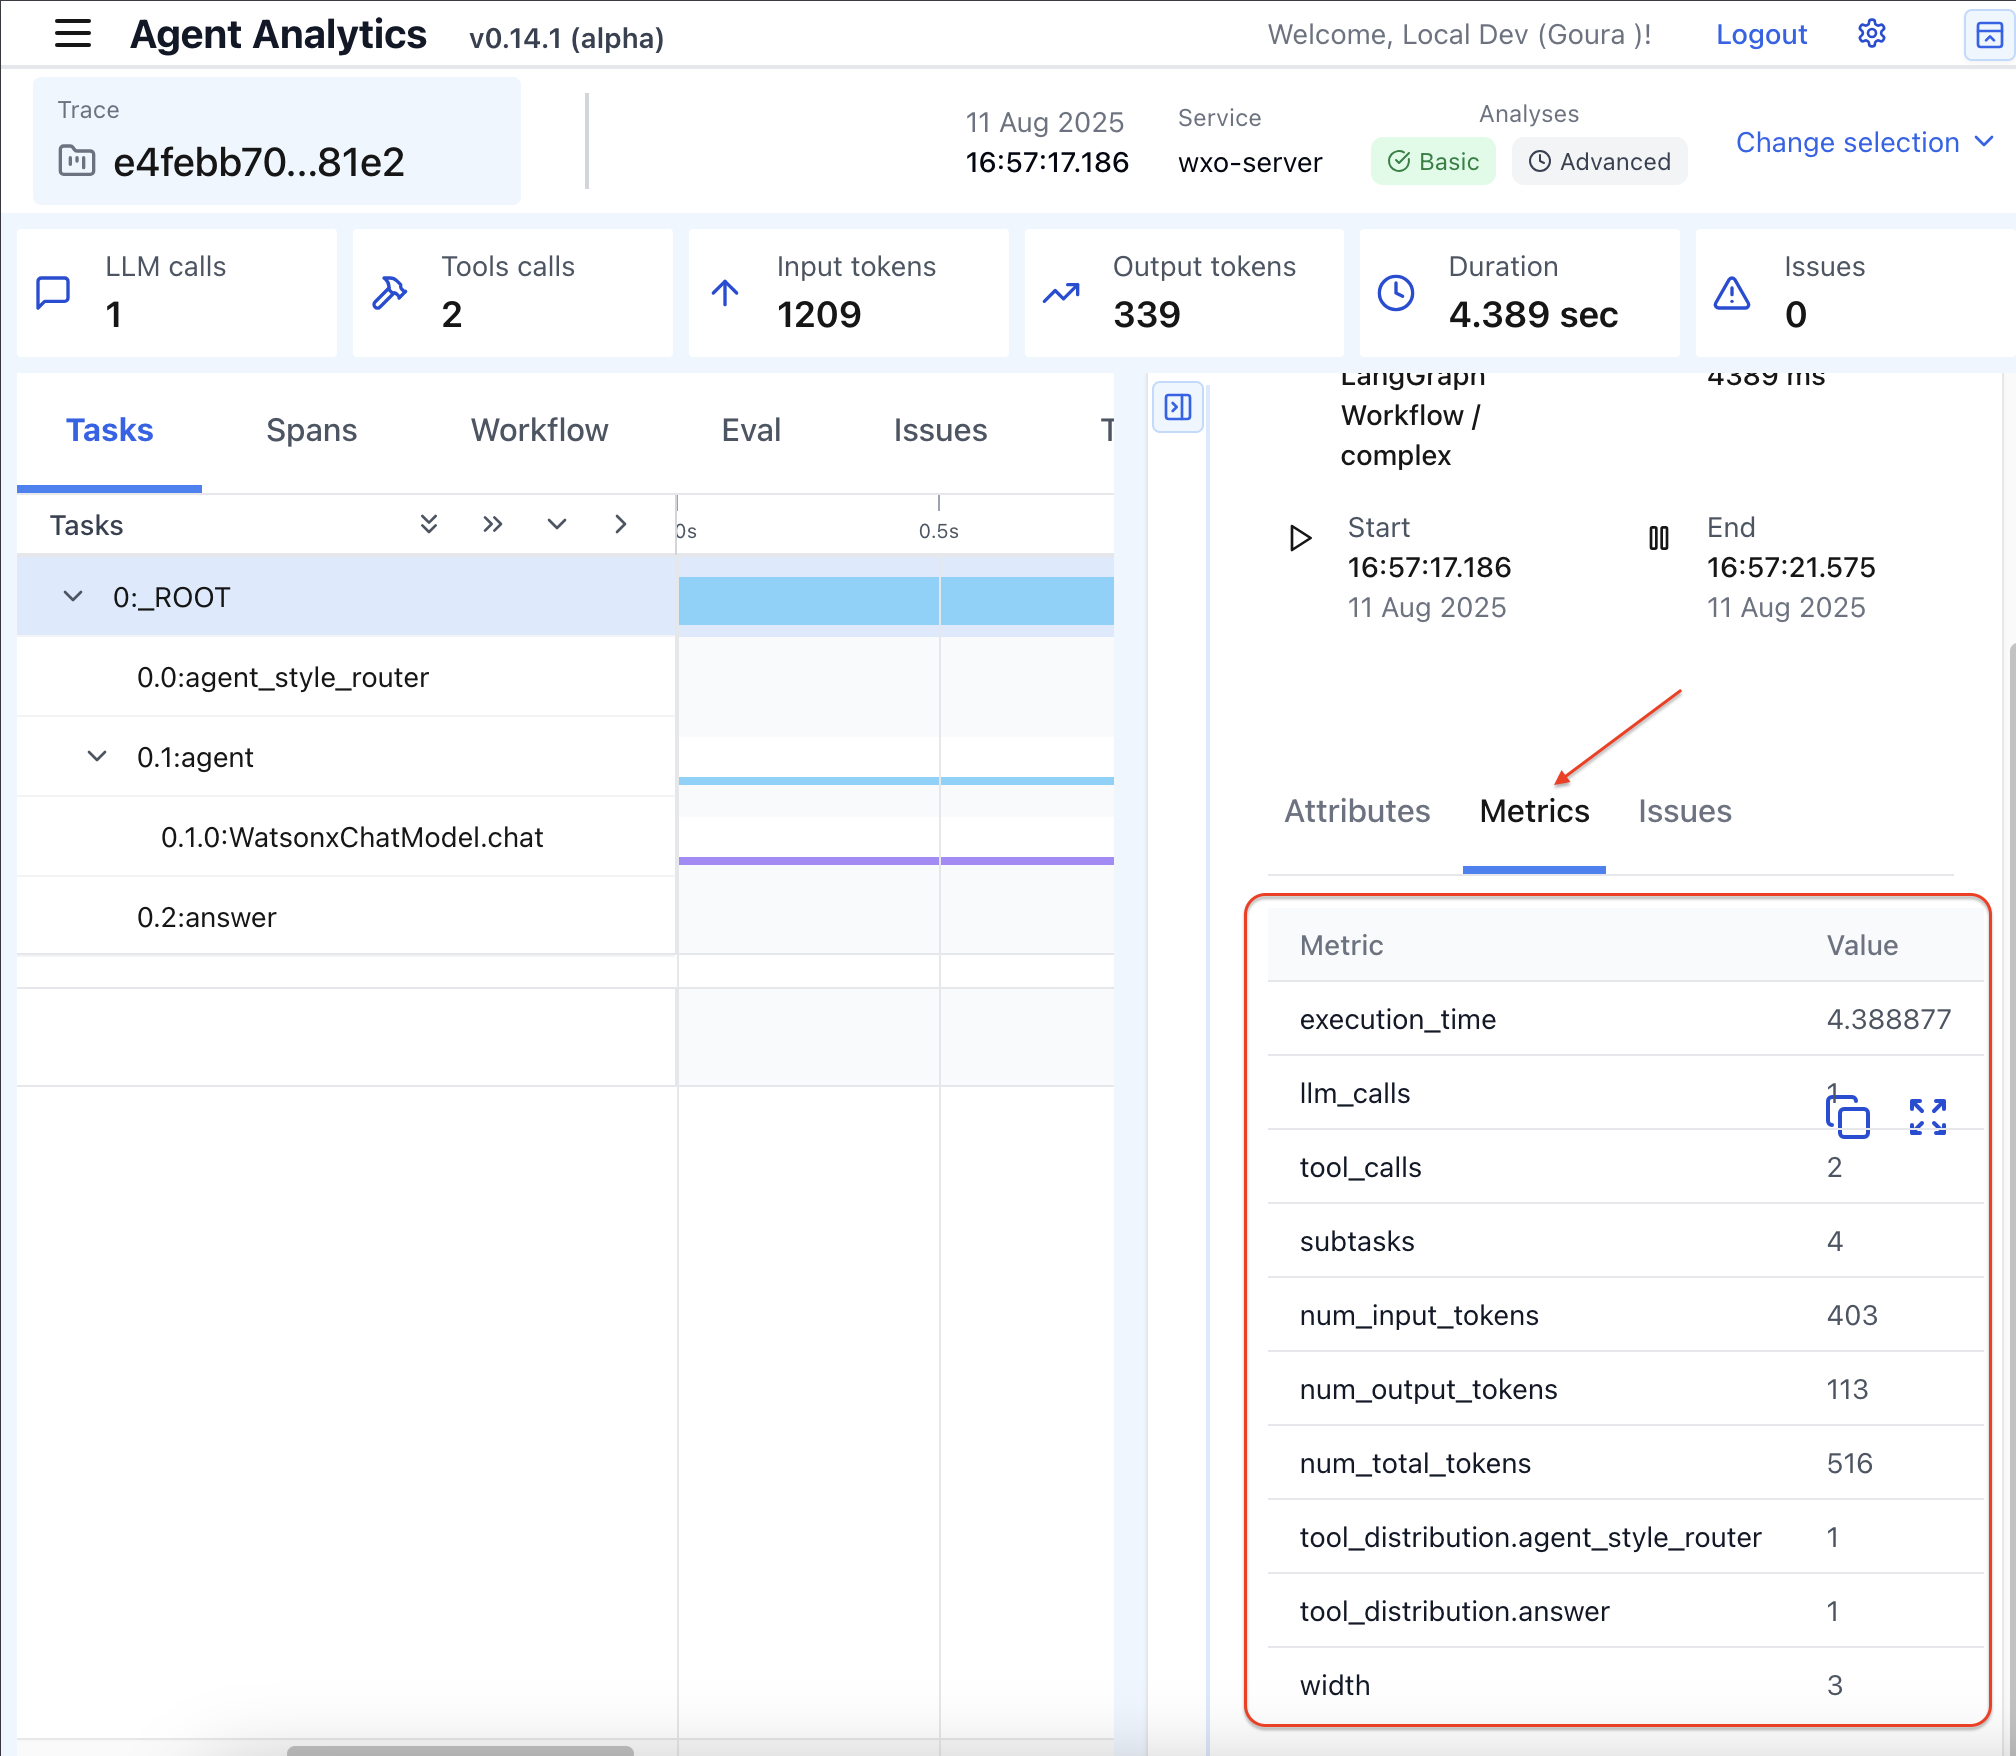
e. Click Metrics to explore different metrics.
f. Click WatsonxChatModel.chat to view the full conversation history, prompts, tokens, input, and outputs.
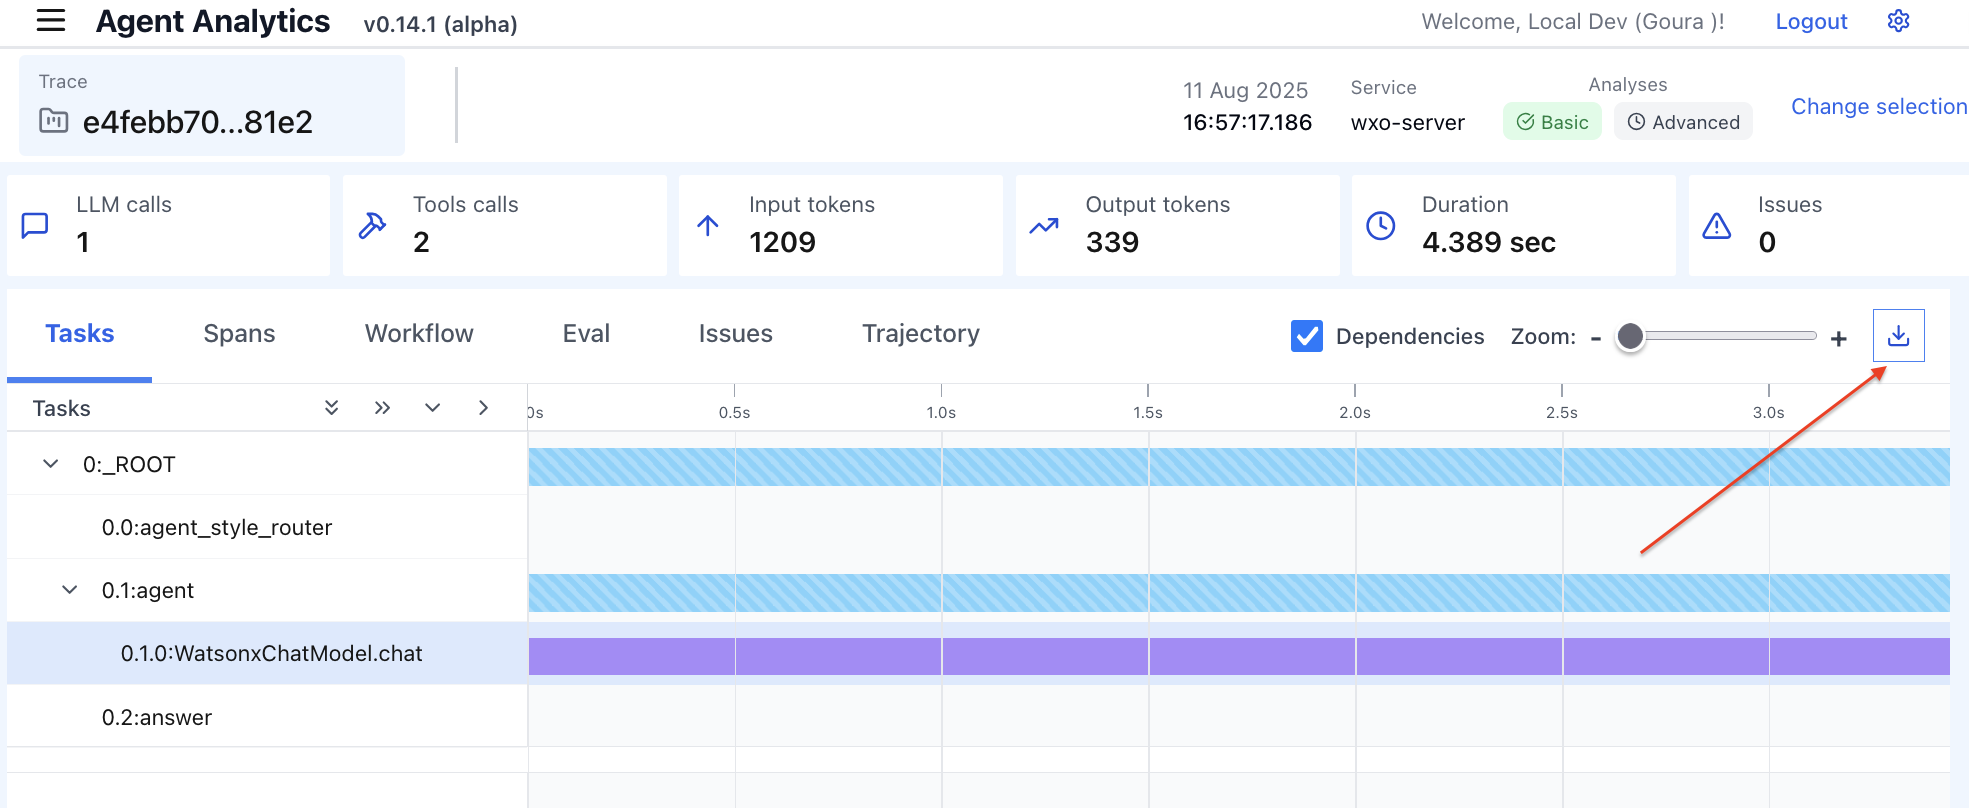
g. You can download the full traceability report as a JSON file report.
h. To analyze a full conversation, click Change selection.
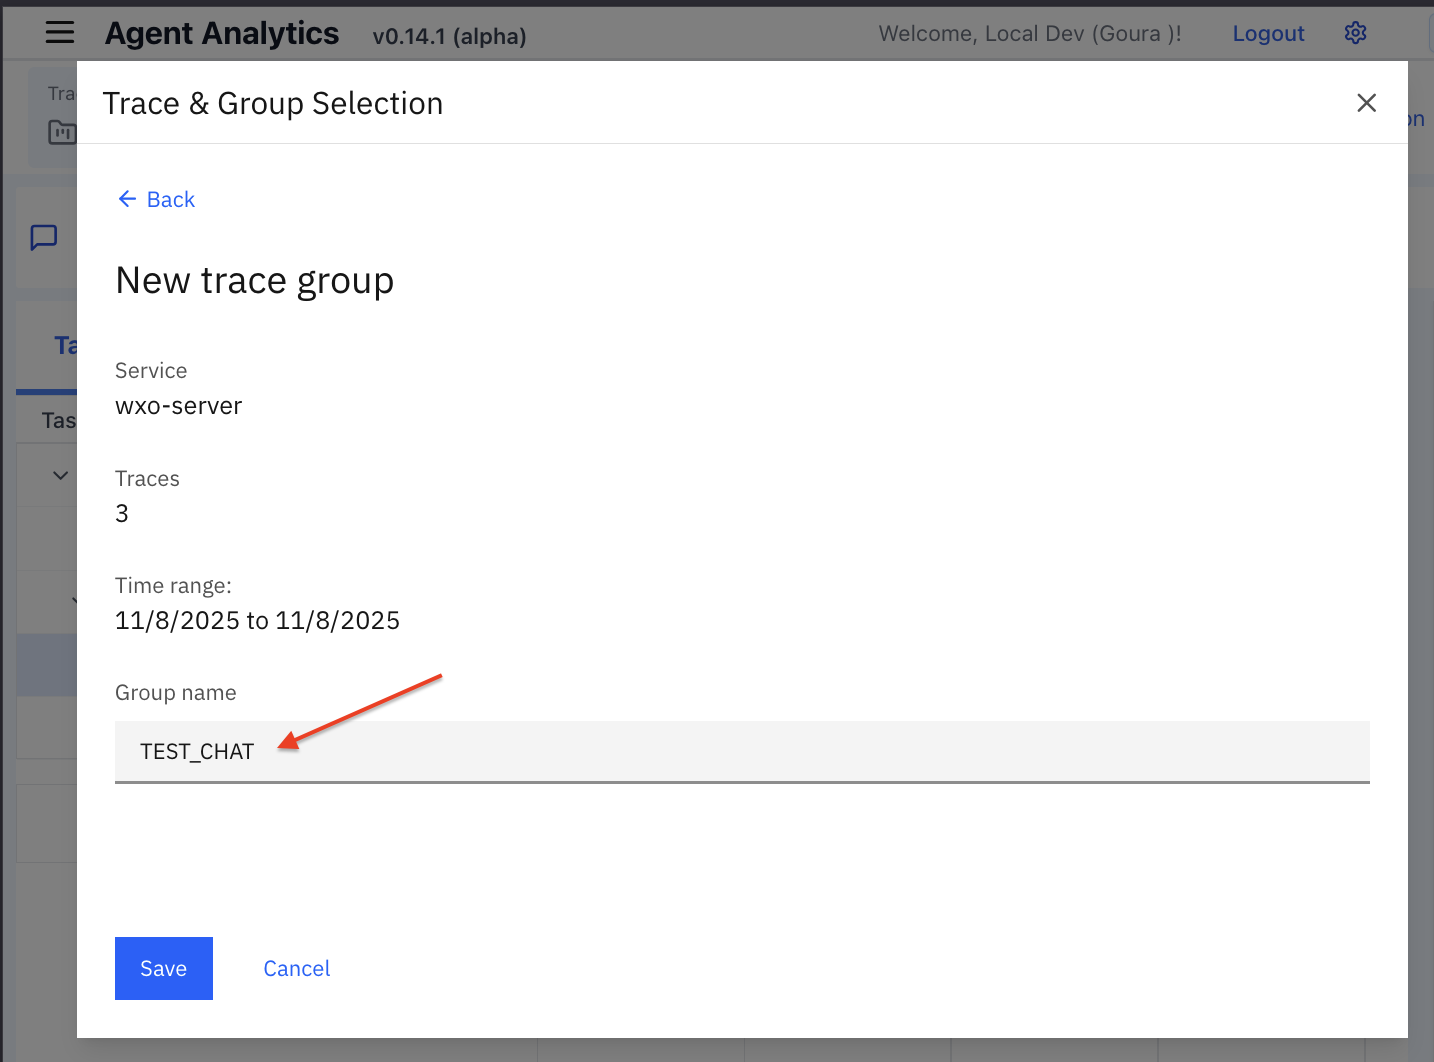
i. Click Select All and then Group.
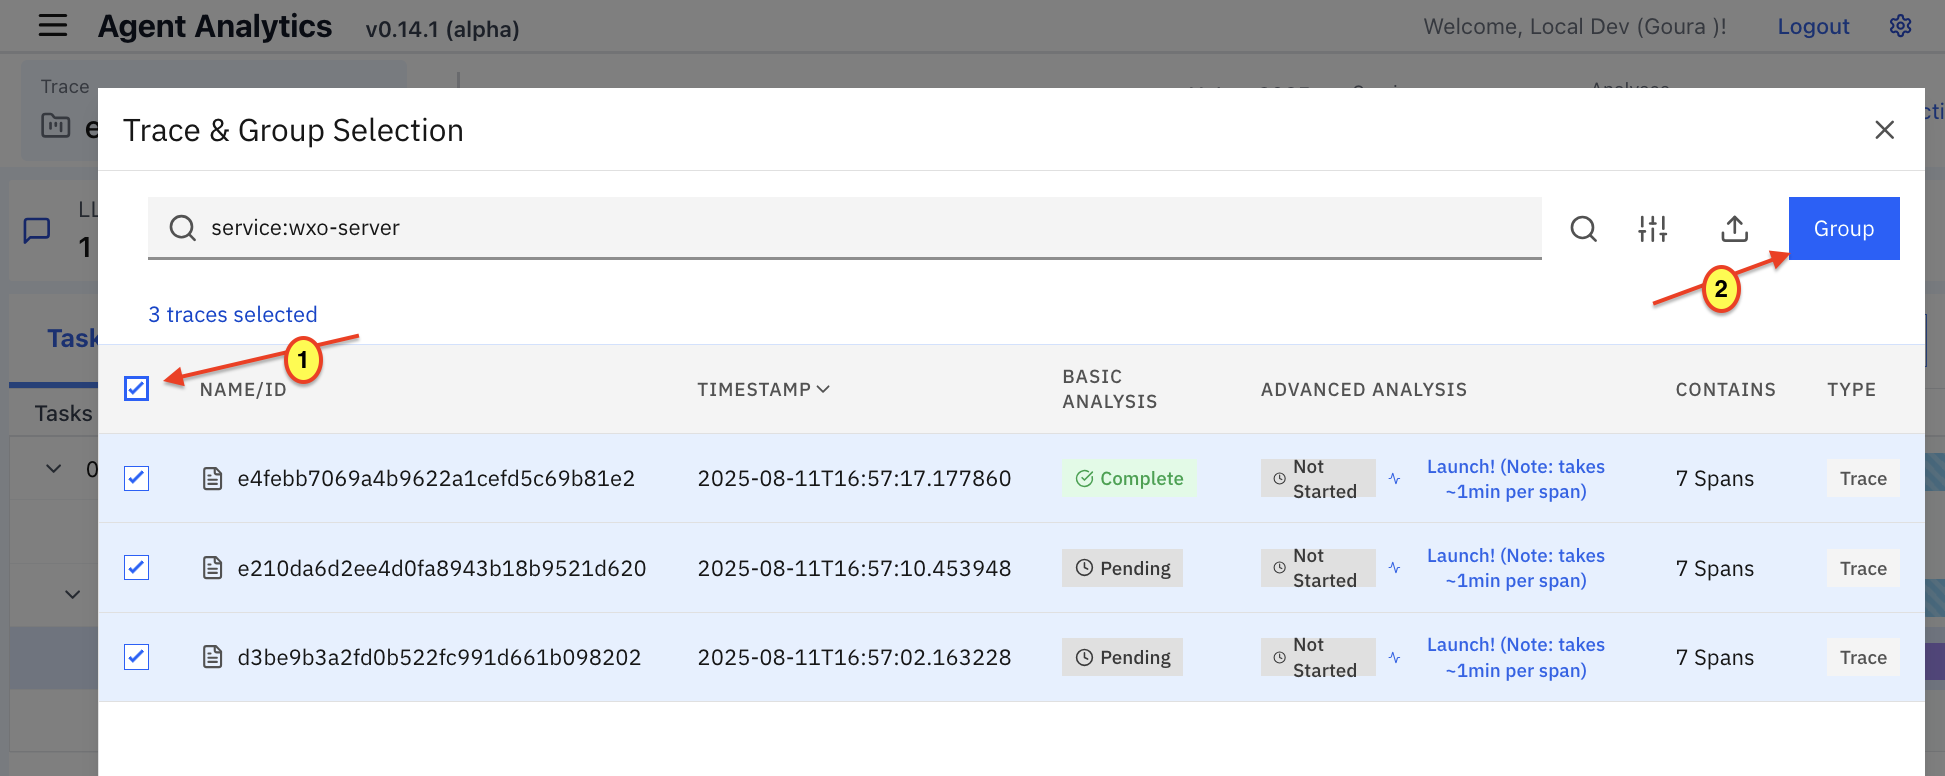
j. Enter test_CHAT as the Group name and click Save.
k. After saving, test_CHAT appears in the Trace & Group Selection. Click test_CHAT.
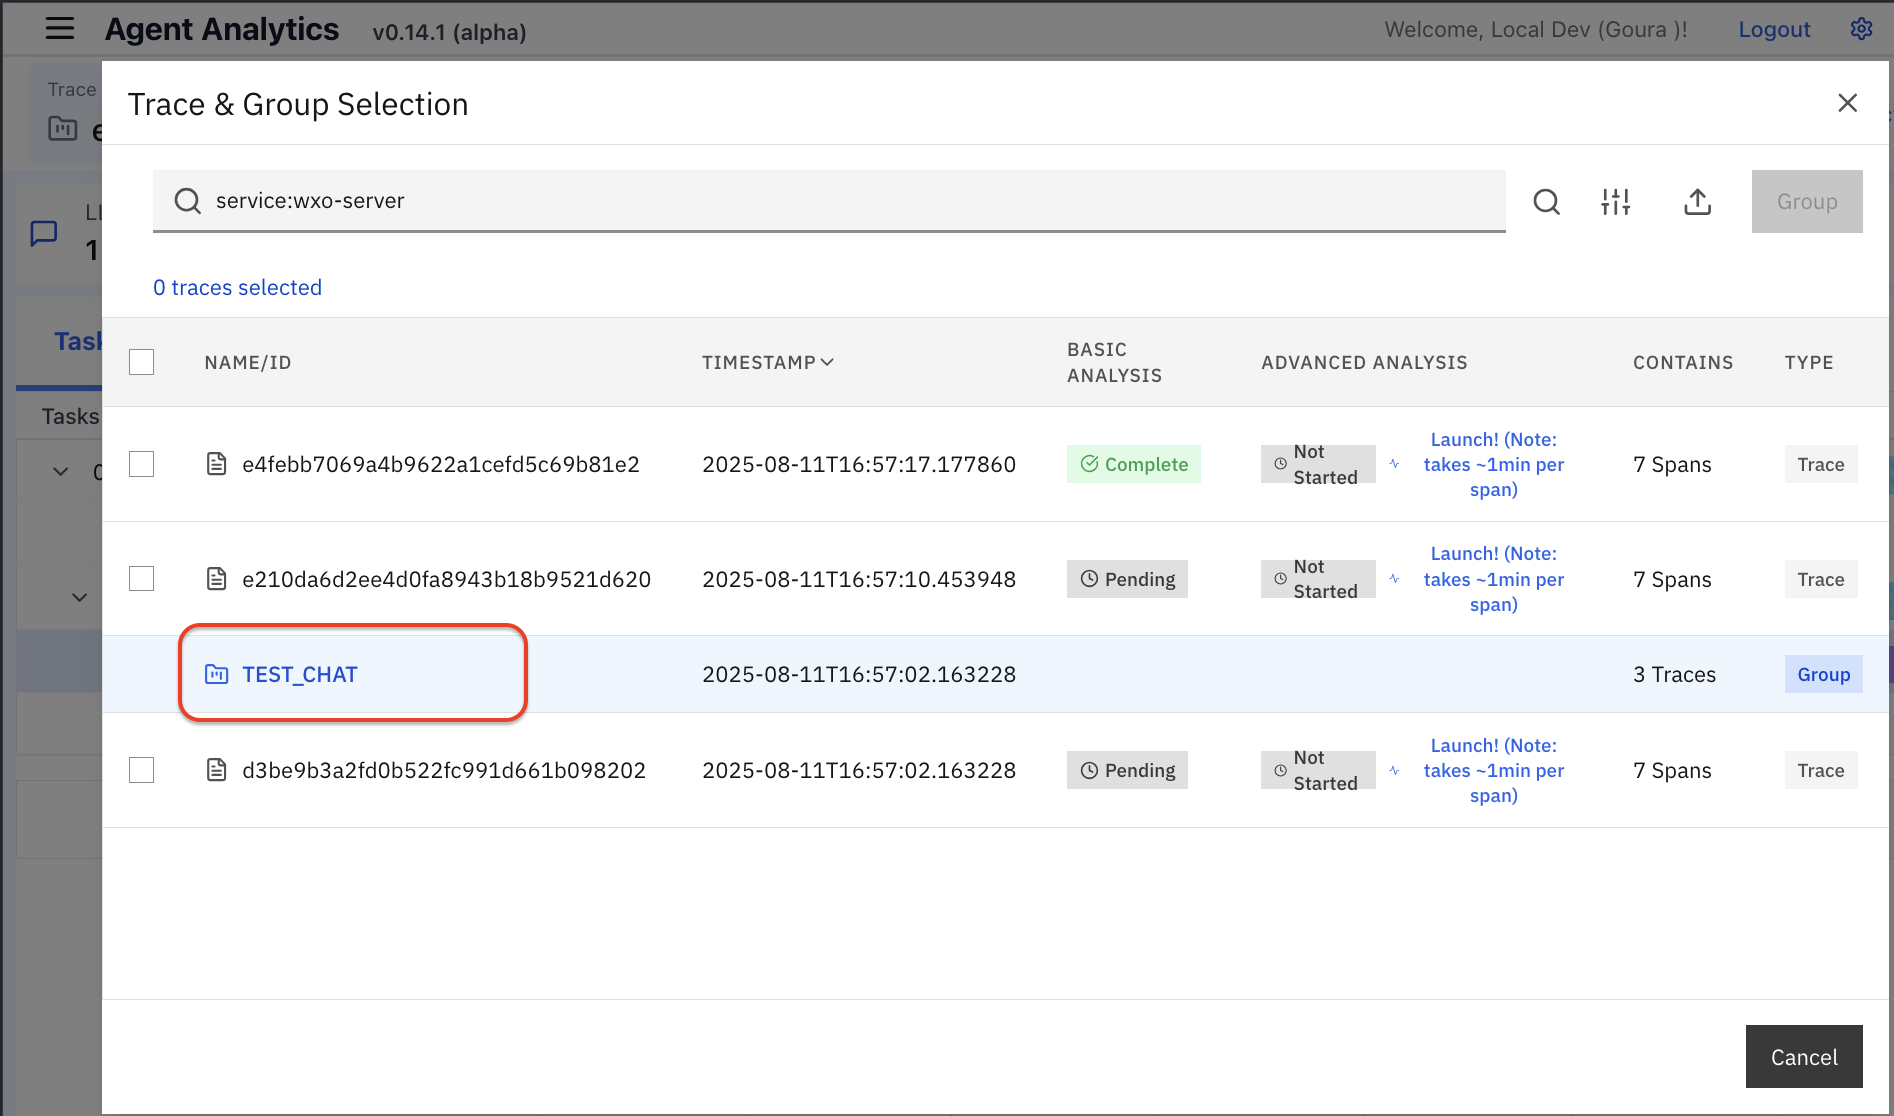
l. In the Agent Analytics screen, you can view the statistics of the entire chat conversation. In this example, you can see that the 3 LLMs that match the 3 back-and-forth exchanges in the agent chat.

You can now explore all the metrics as you did for individual chats (steps 8.c – 8.g).
Langfuse setup on watsonx Orchestrate ADK
Add observability to your local watsonx Orchestrate environment using the Langfuse open source platform. With Langfuse, you can trace agent conversations, measure latency, and review token usage in detail. This section guides you through enabling Langfuse on the server, creating a test agent, and exploring its observability features.
By default, Langfuse is not explicitly enabled on the watsonx Orchestrate server. Start watsonx Orchestrate server and enable Langfuse:
orchestrate server start -e .env -lOr
orchestrate server start -e .env --with-lanfuse
After the watsonx Orchestrate server starts, the local URL to connect to Langfuse is shown.

- URL:
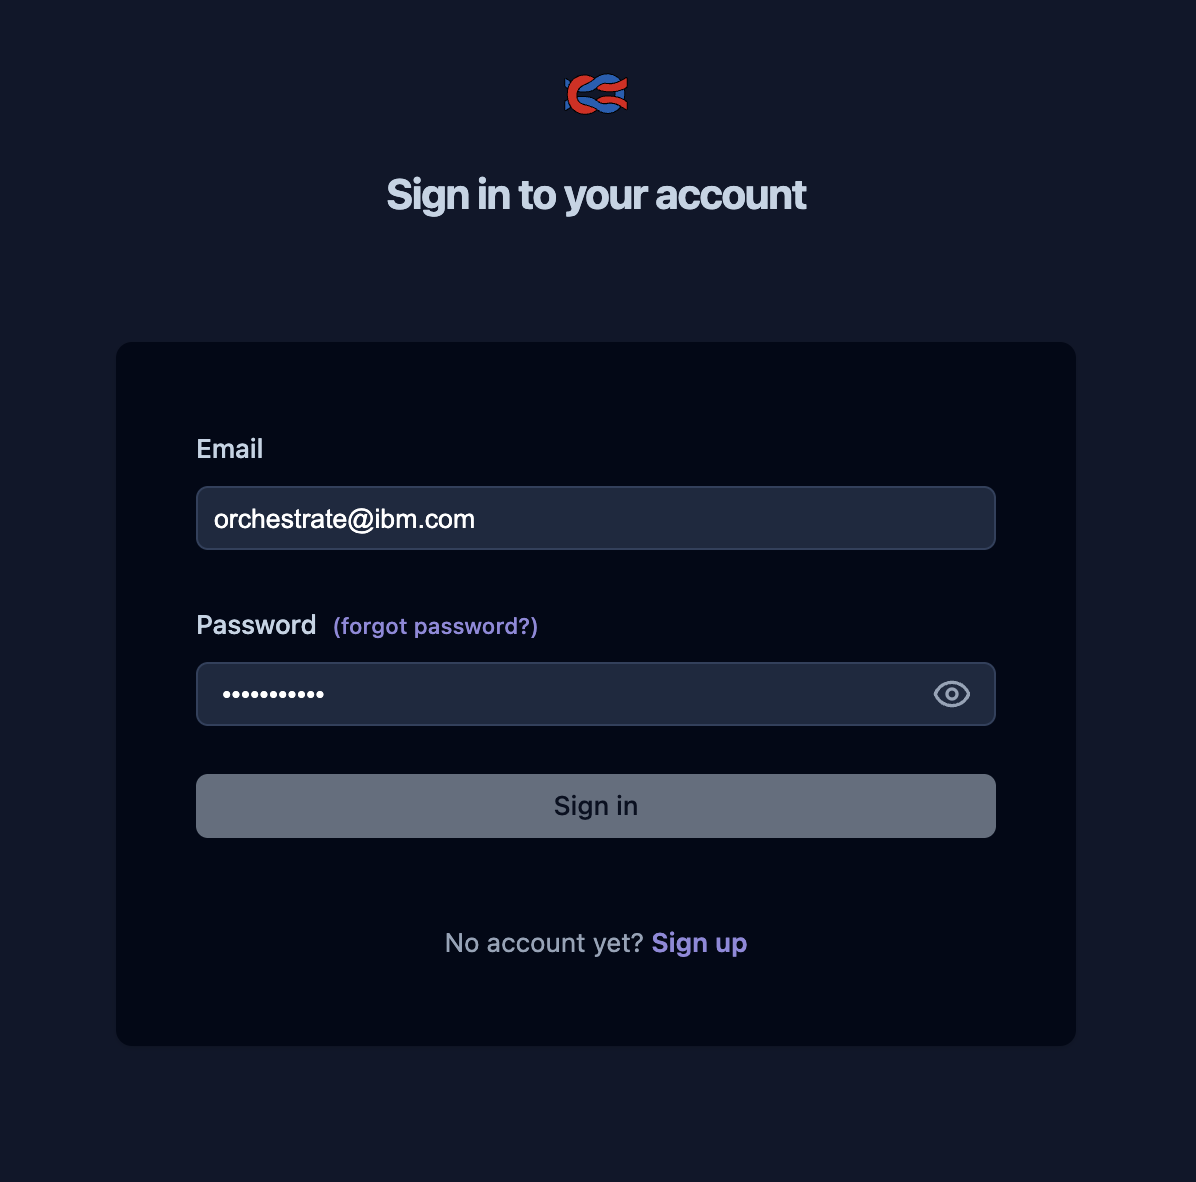
http://localhost:3010 - Username:
orchestrate@ibm.com - Password:
***
- URL:
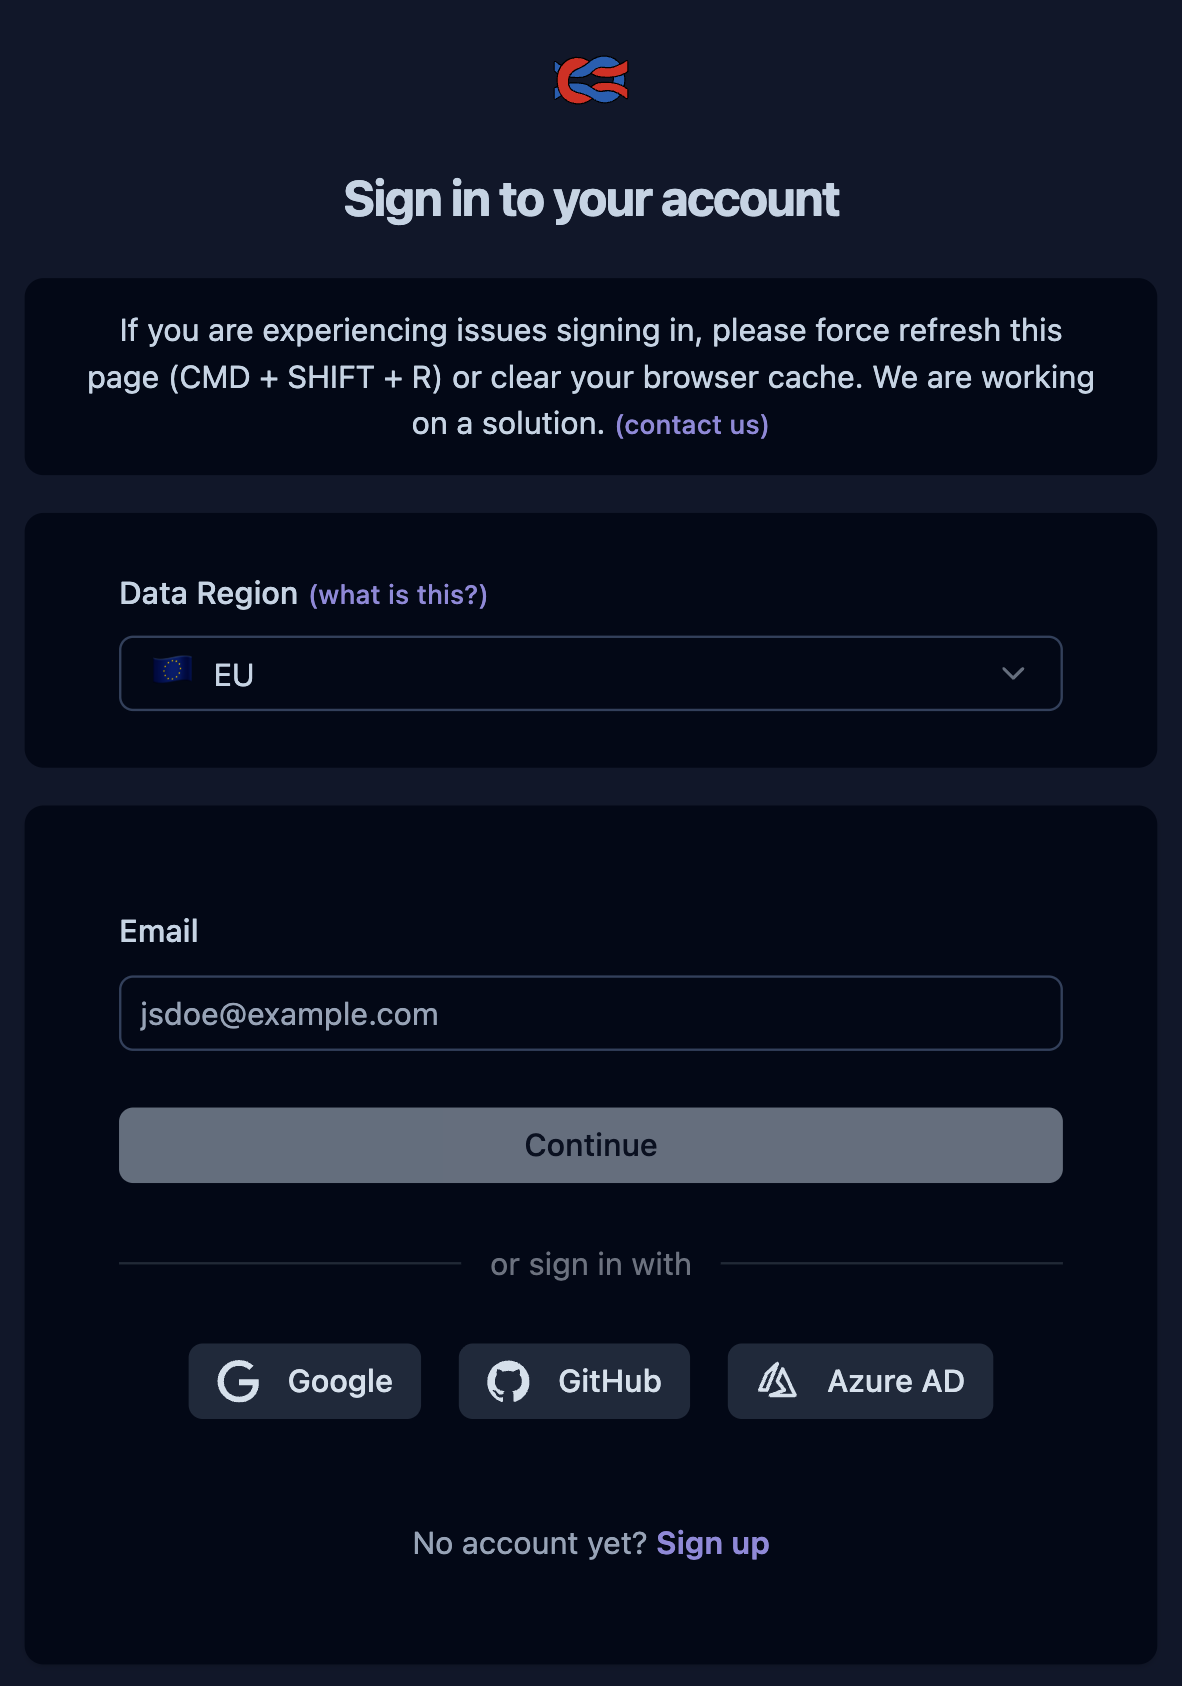
Use the credentials from the preceding step to log in to Langfuse.
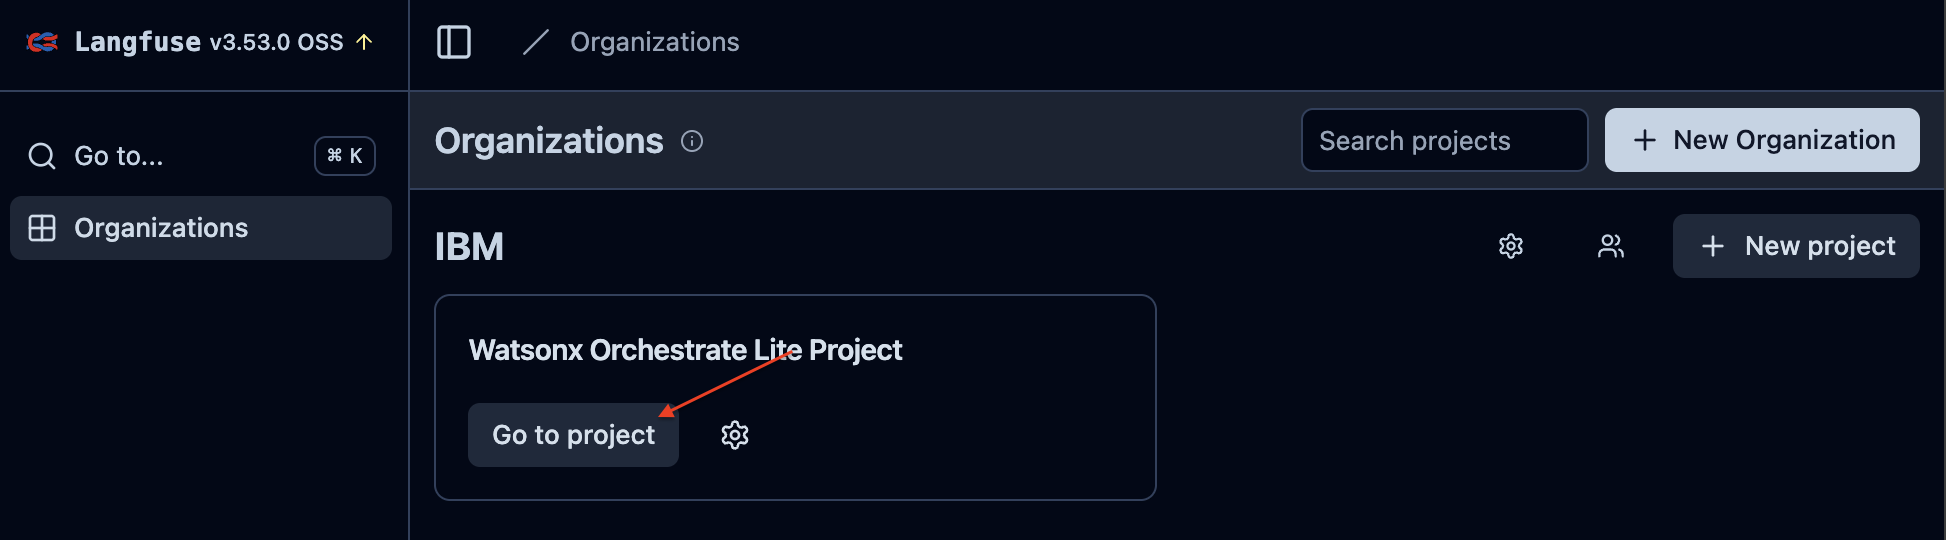
After logging in, click Go to project.
Start chat in the watsonx Orchestrate environment.
orchestrate chat startCreate an agent in the watsonx Orchestrate environment or use the same agent that you created in the IBM Telemetry setup on watsonx Orchestrate ADK section by selecting the Weather alert agent from the Agents list in the chat mode.
test the agent with a few sample questions:
What is the temperature in Bengaluru?
Use Langfuse to analyze the agent’s behavior. You can track, observe, and monitor how the agent communicates using Langfuse.
a. Refresh the Langfuse page (step 2) in this section.
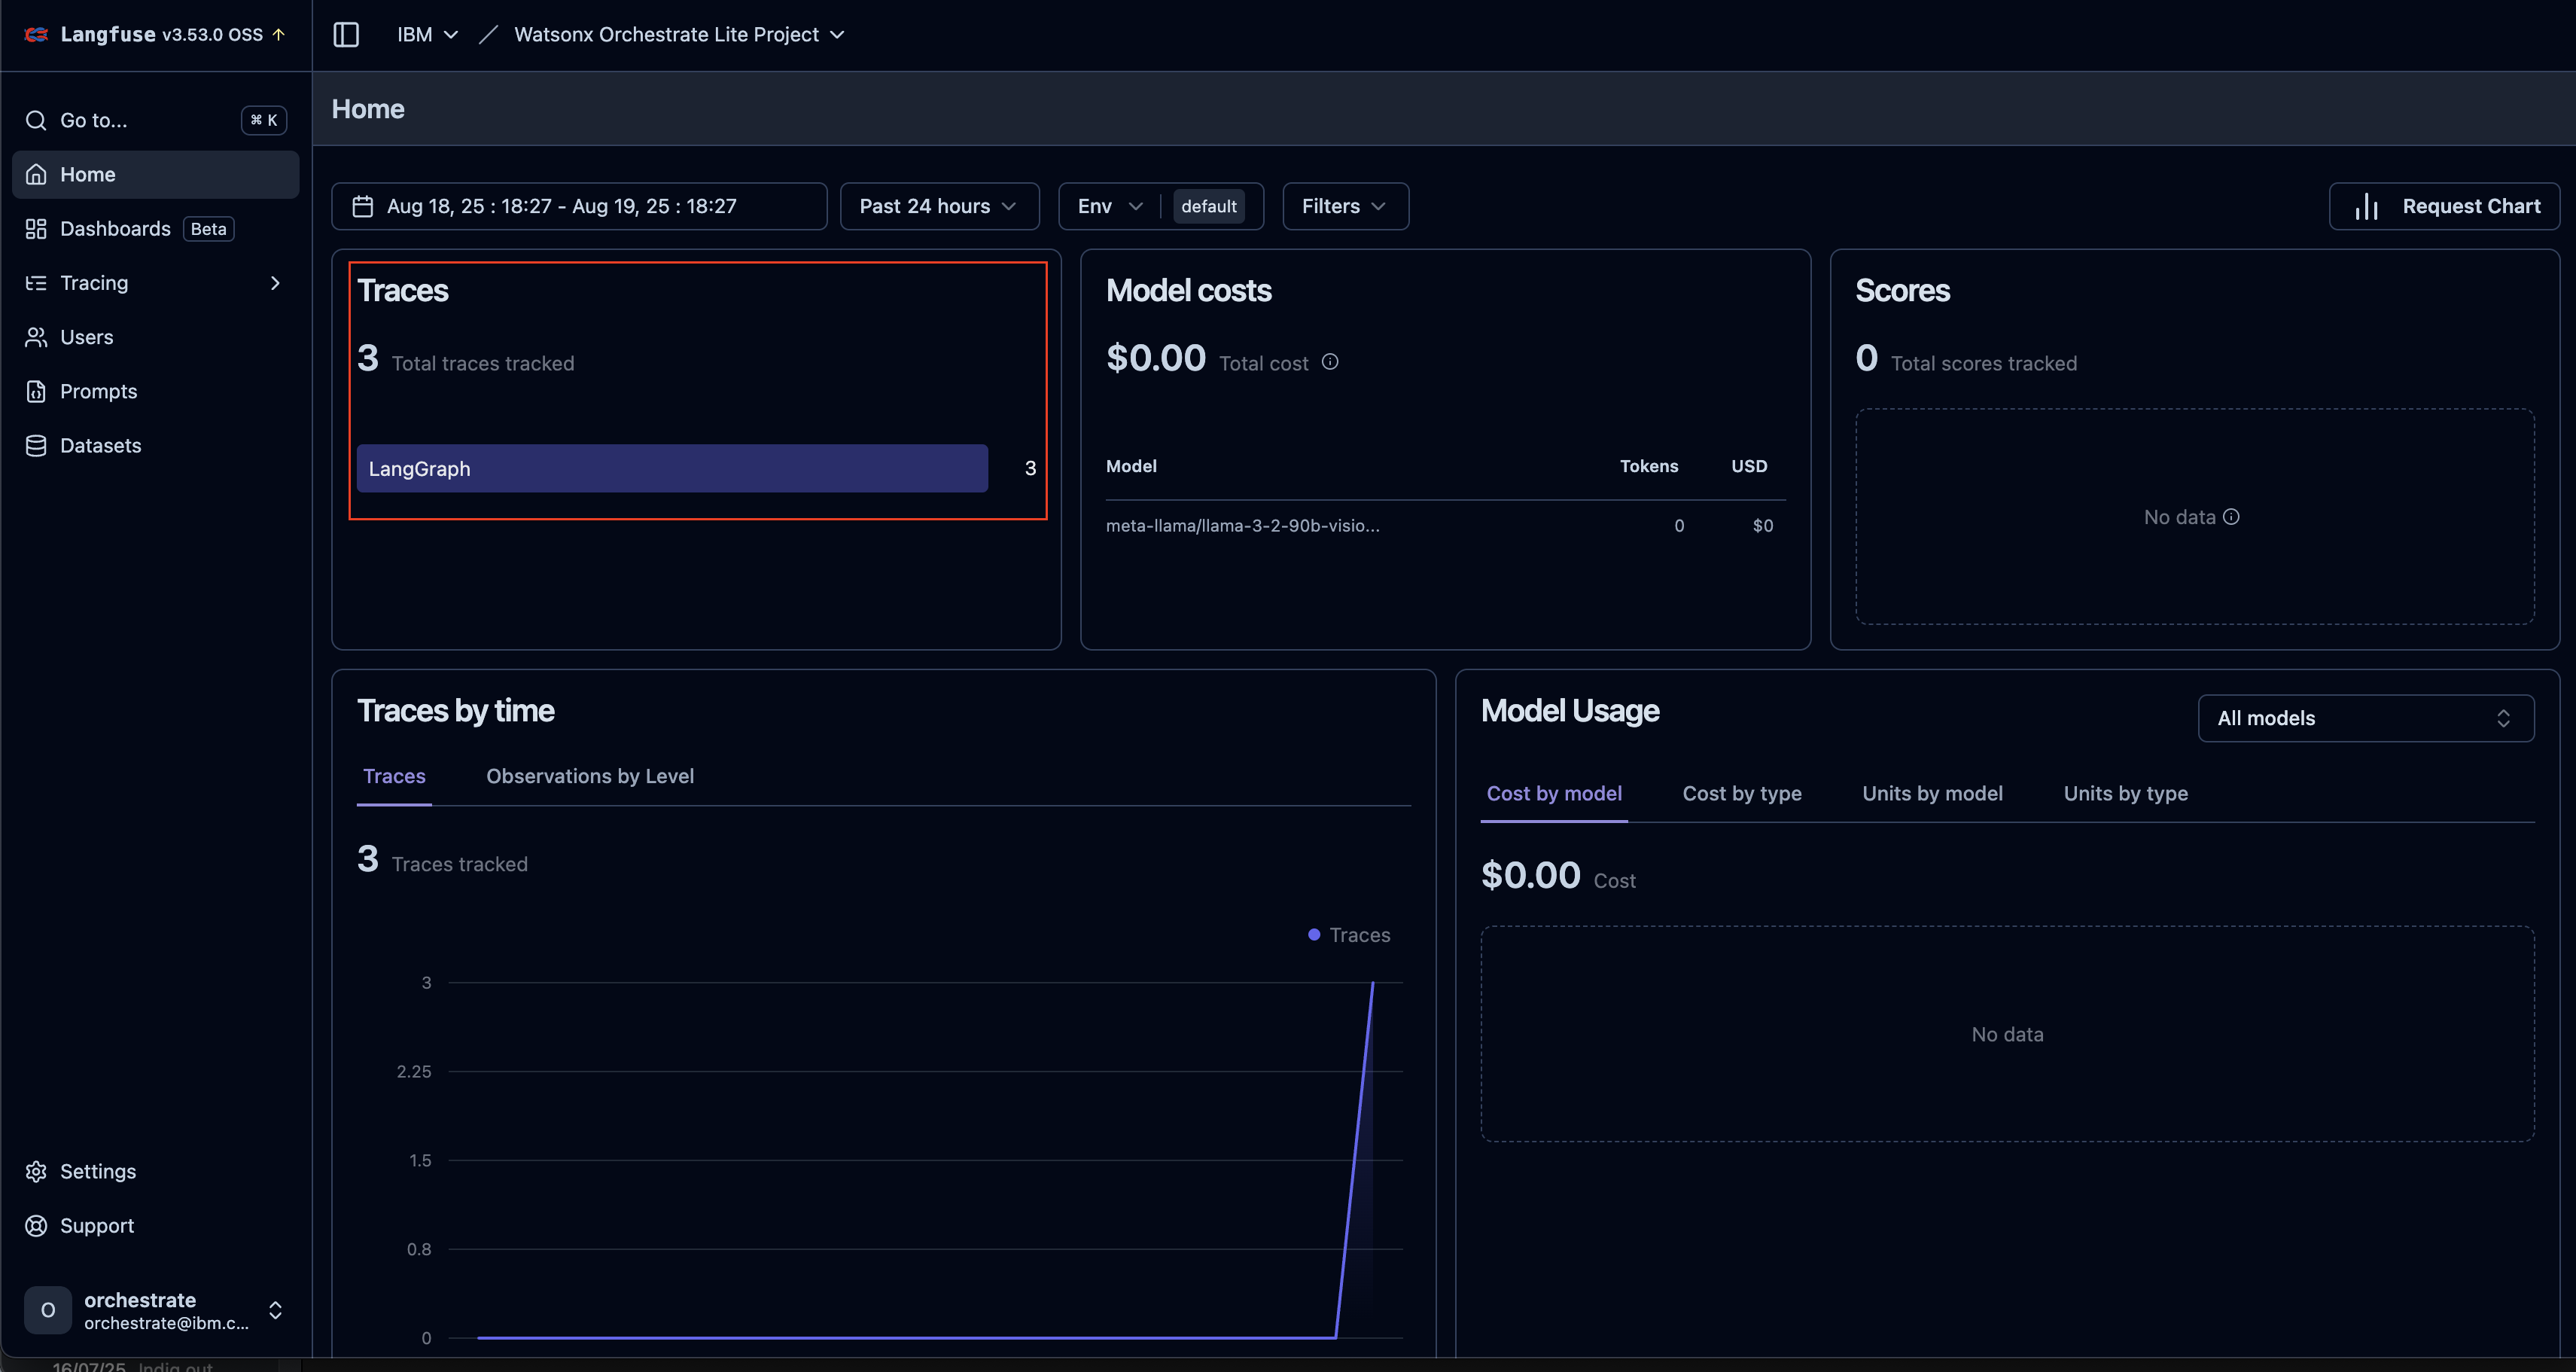
The 3 back-and-forth communications in the Weather alert agent match the 3 traces recorded in the Langfuse dashboard.
b. To check traces of each communication, click Tracing > Traces.
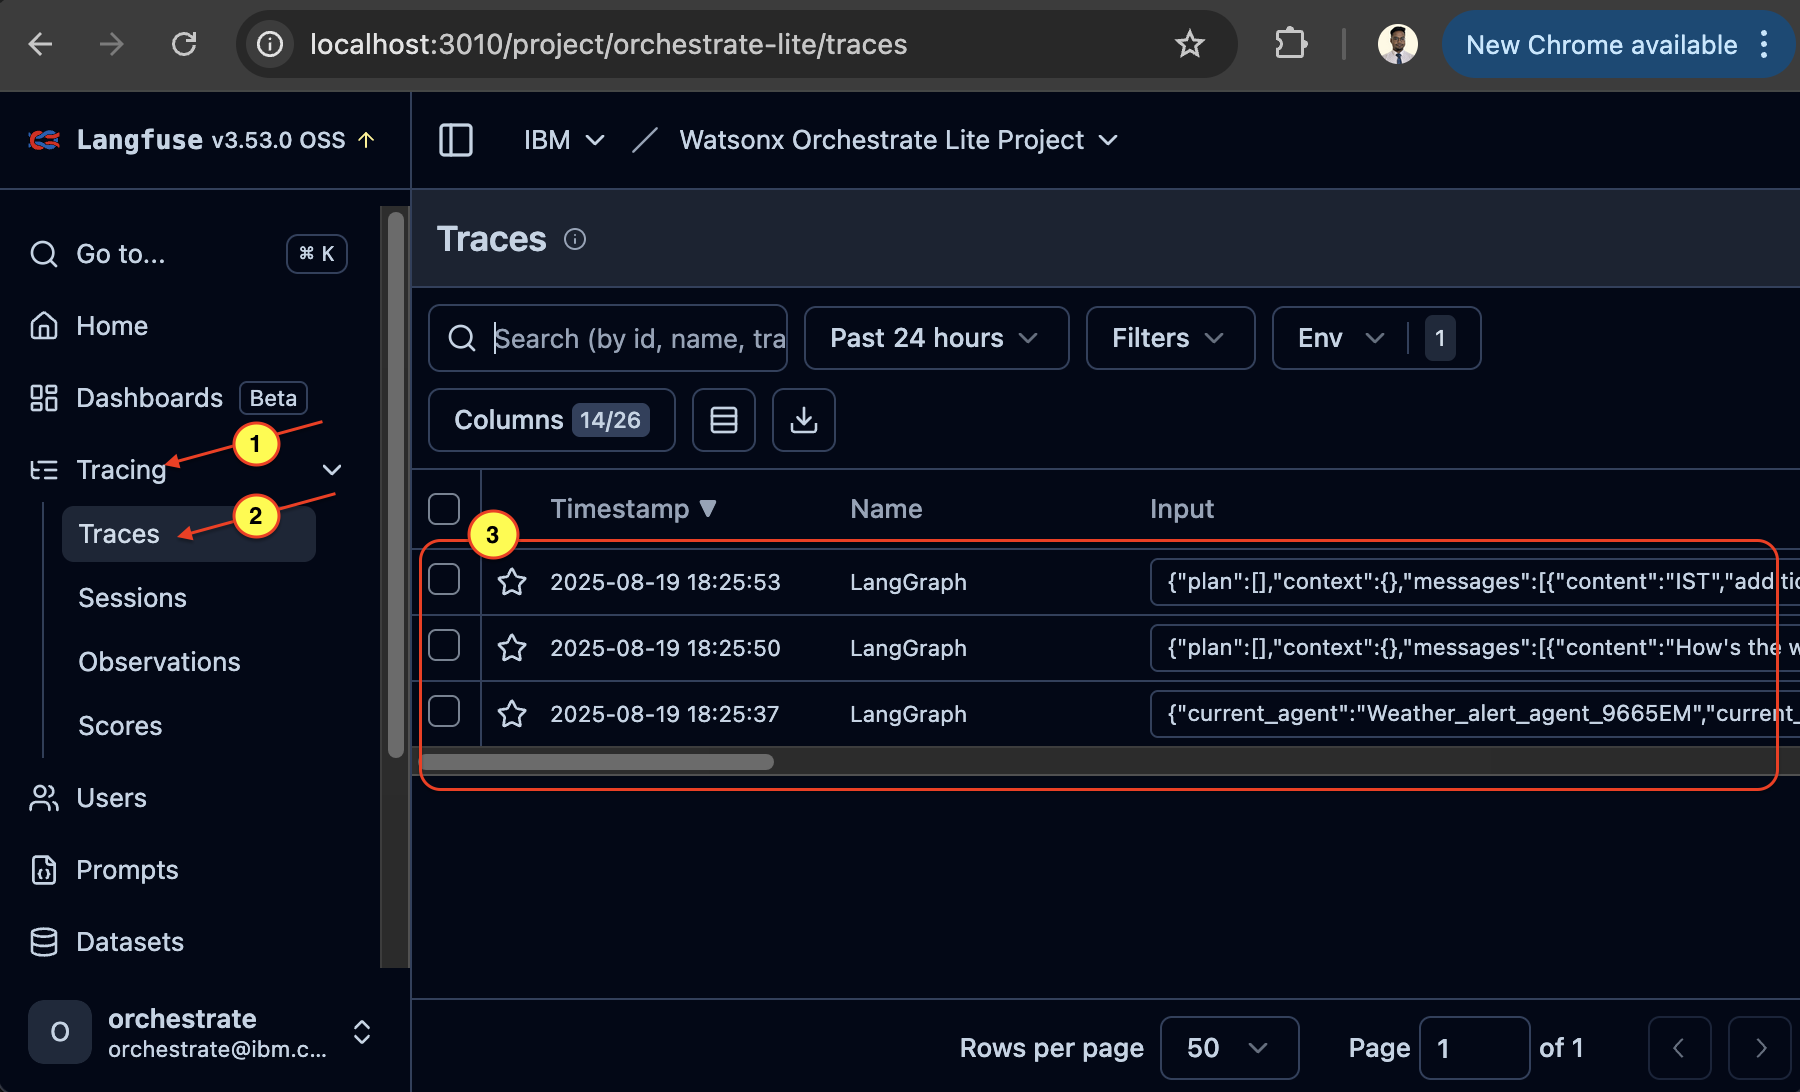
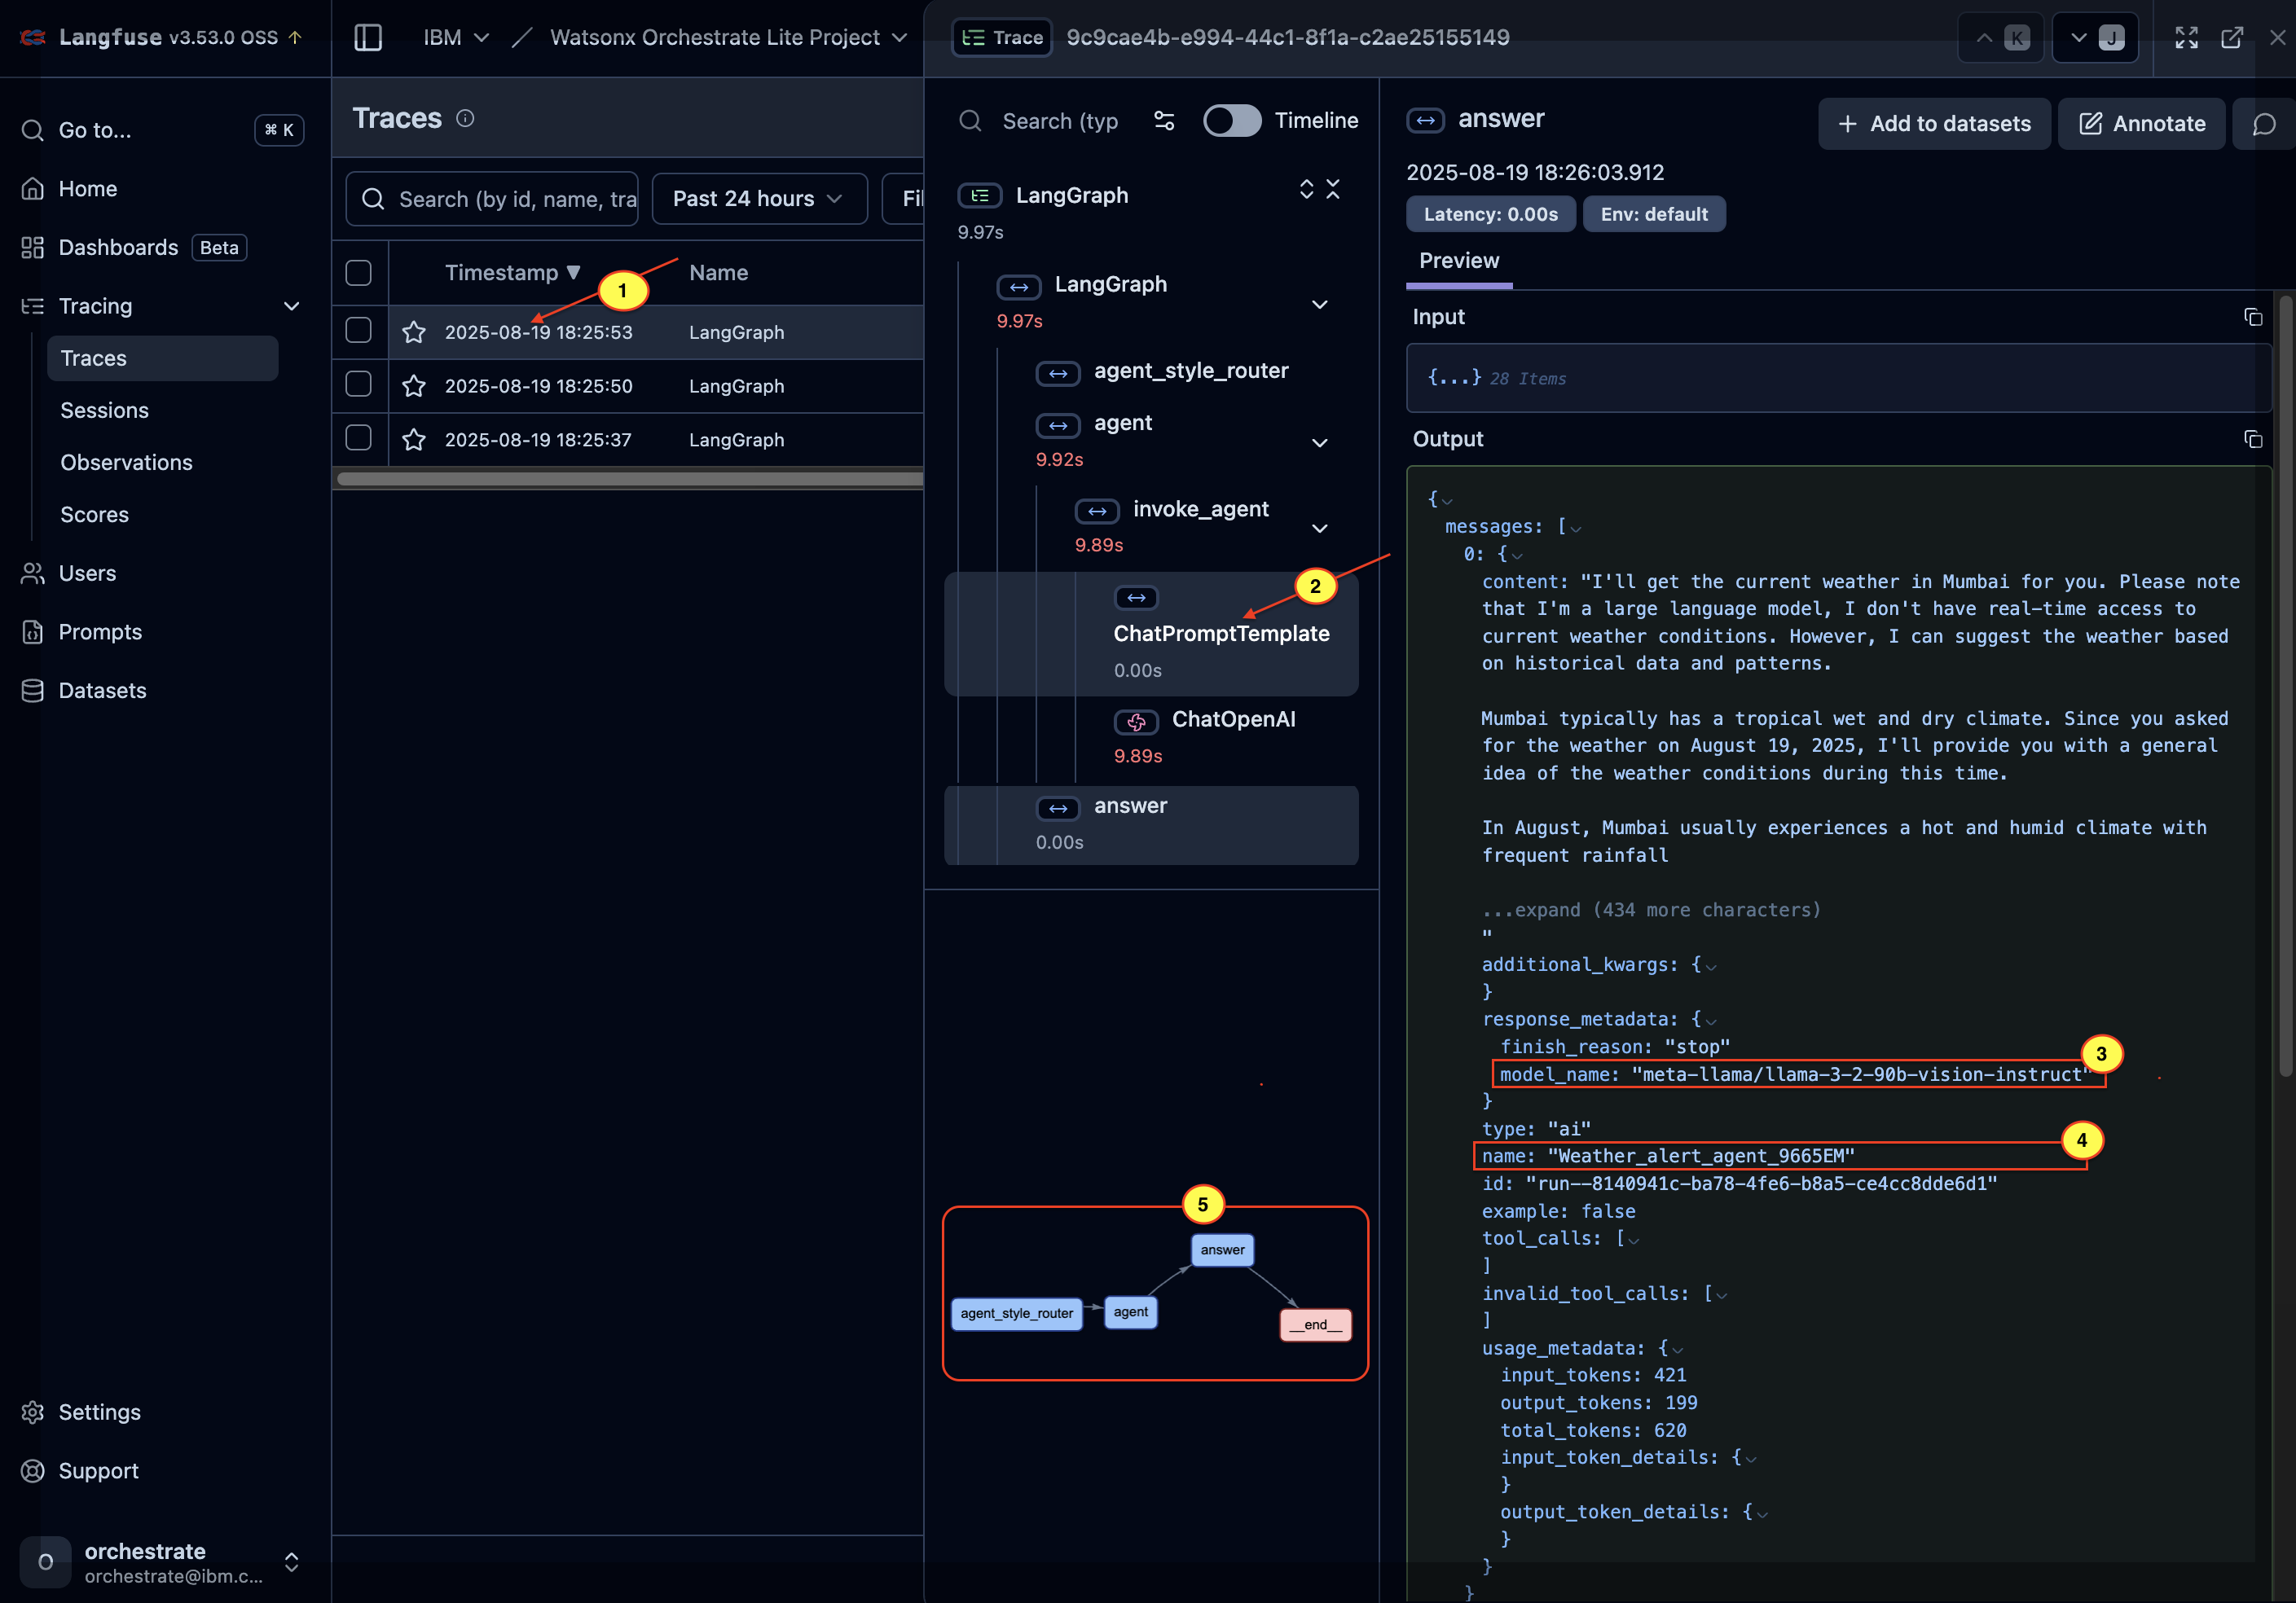
c. Click any trace to explore:
- Time taken for each step
- LLM used (see 3)
- Agent used (see 4)
Agent workflow (see 5)
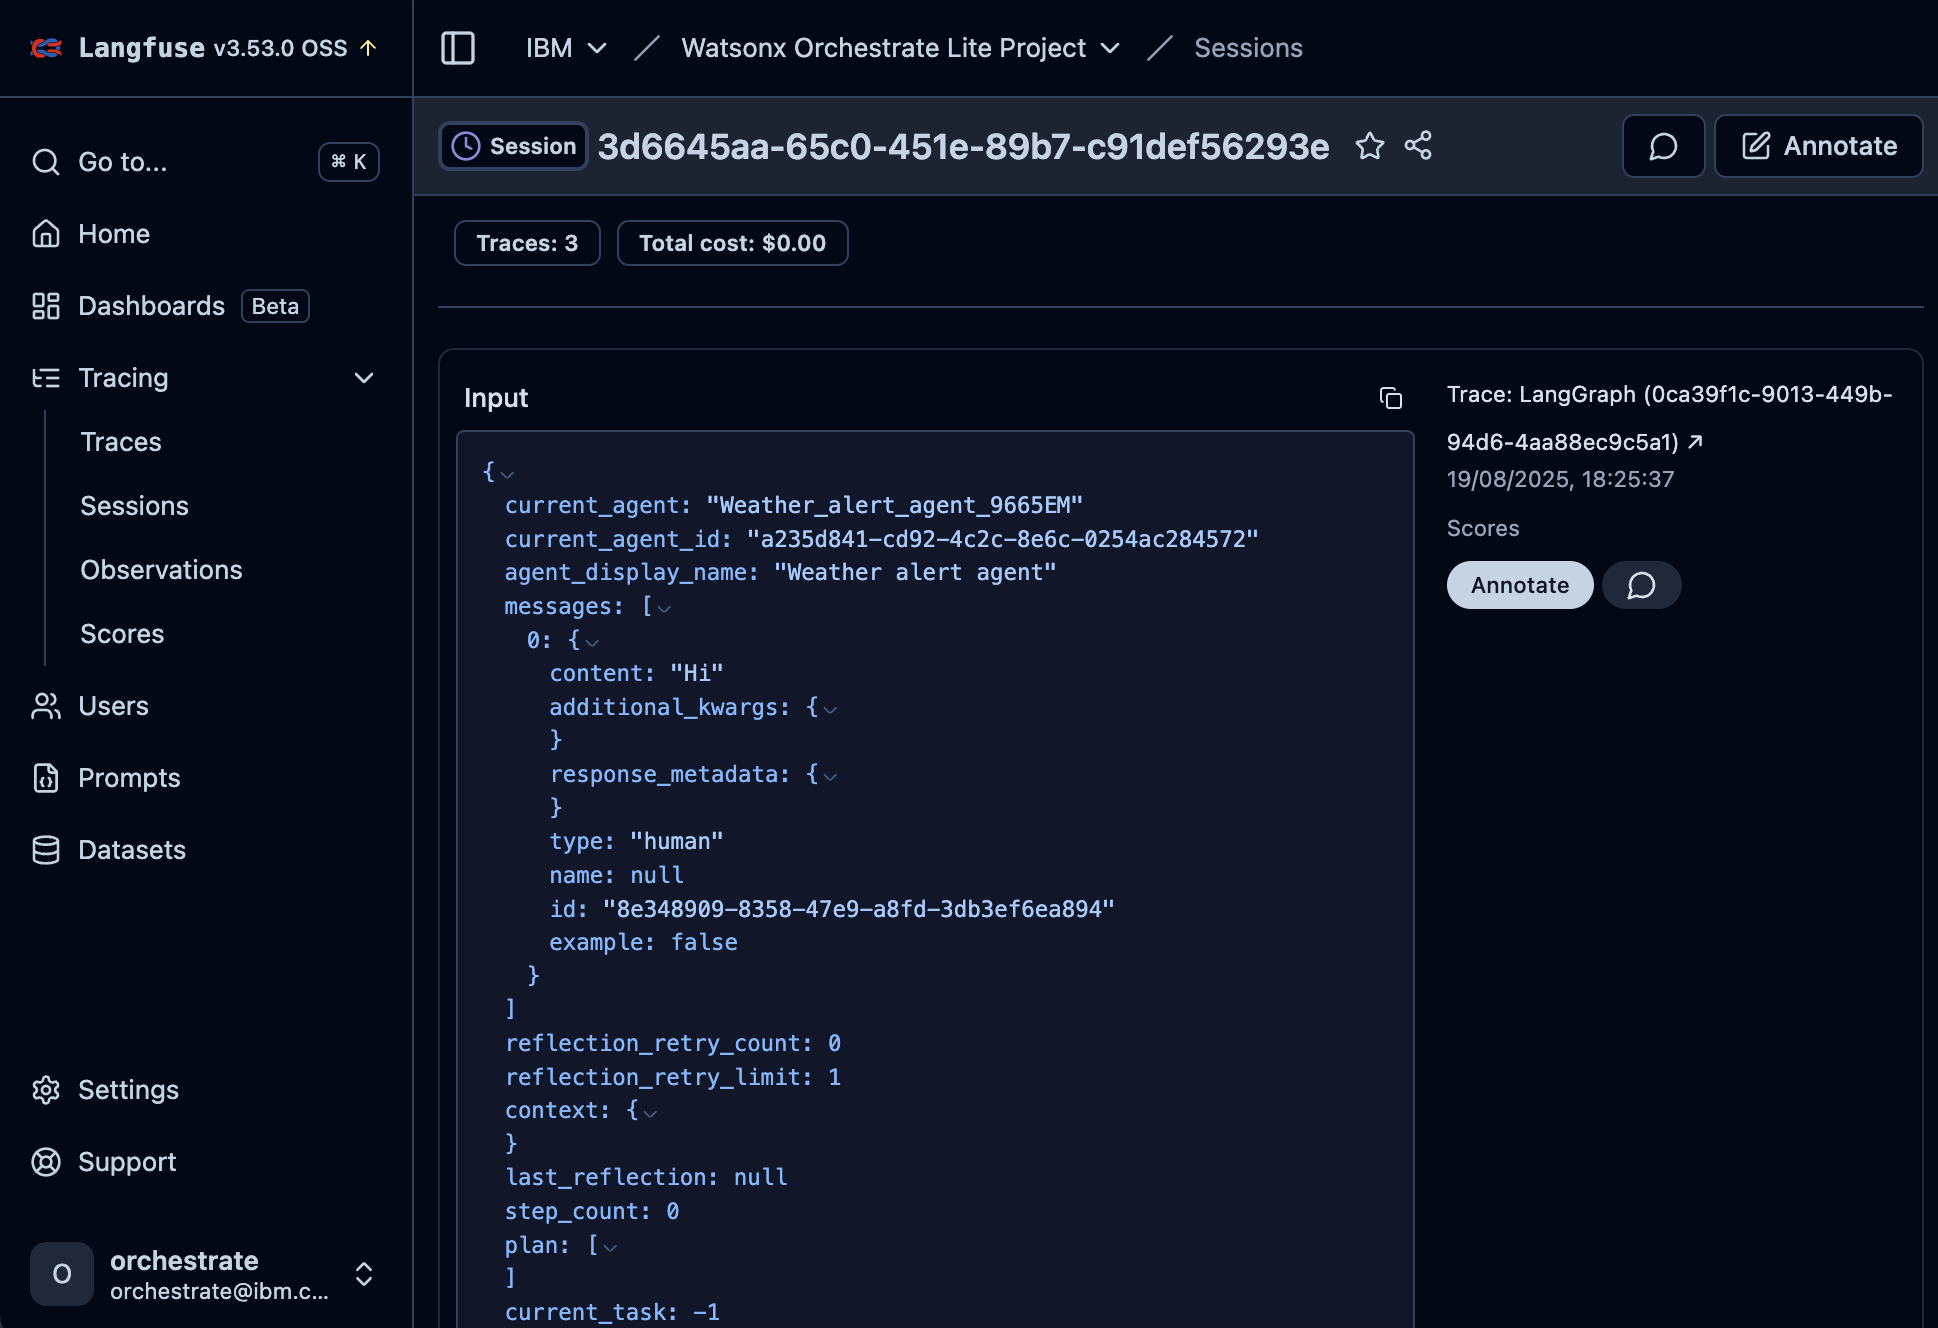
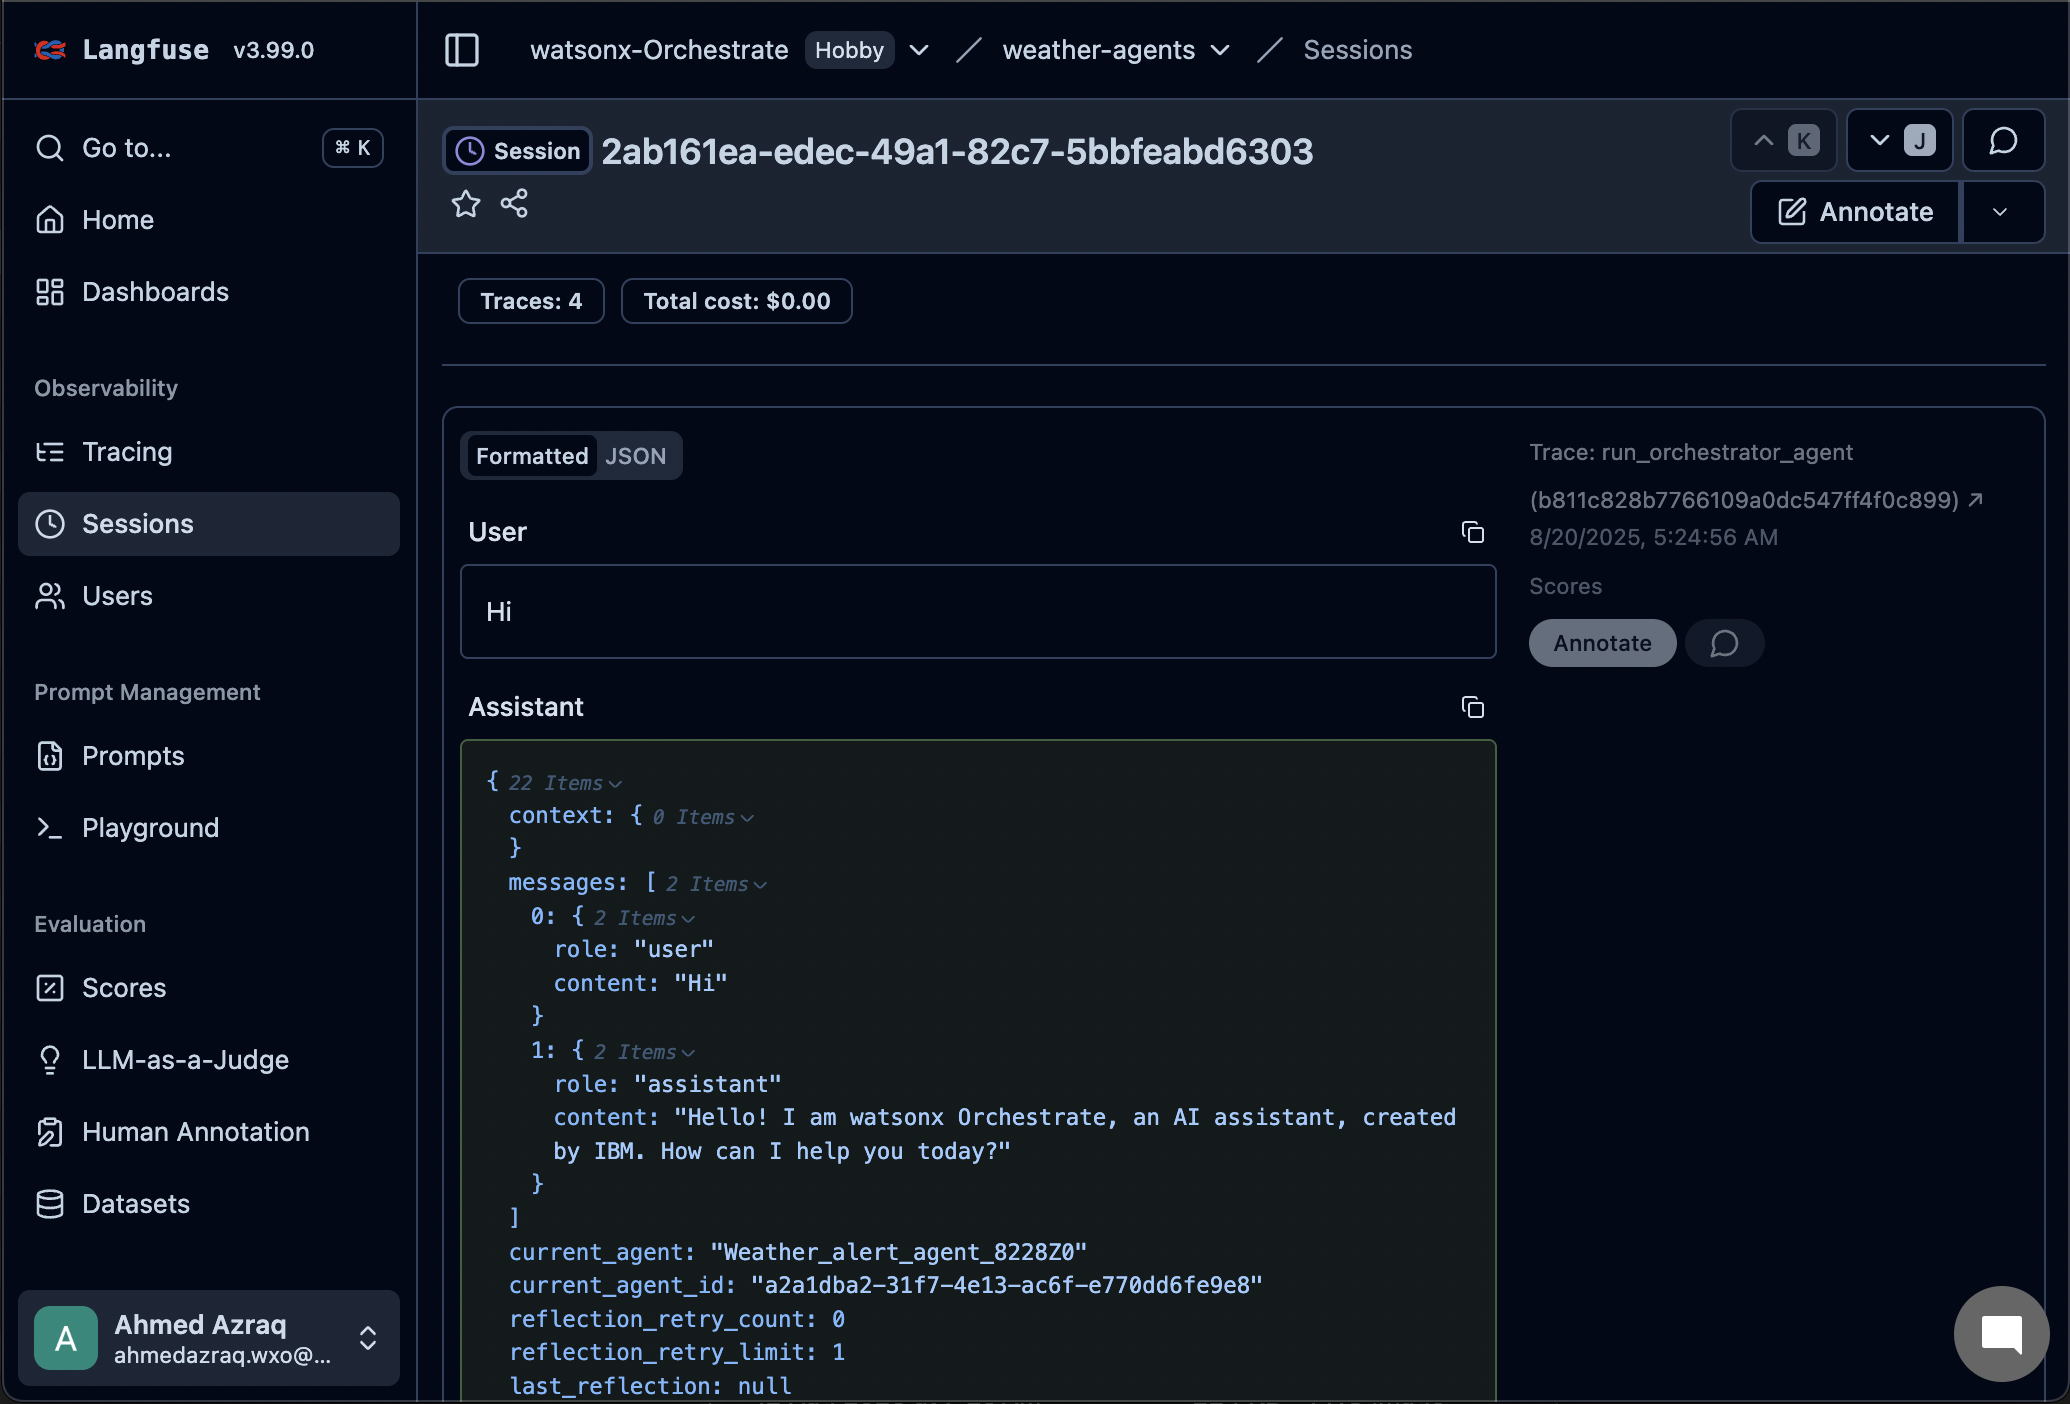
d. You can also explore traceability for each session by clicking Tracing > Sessions in the navigation menu.
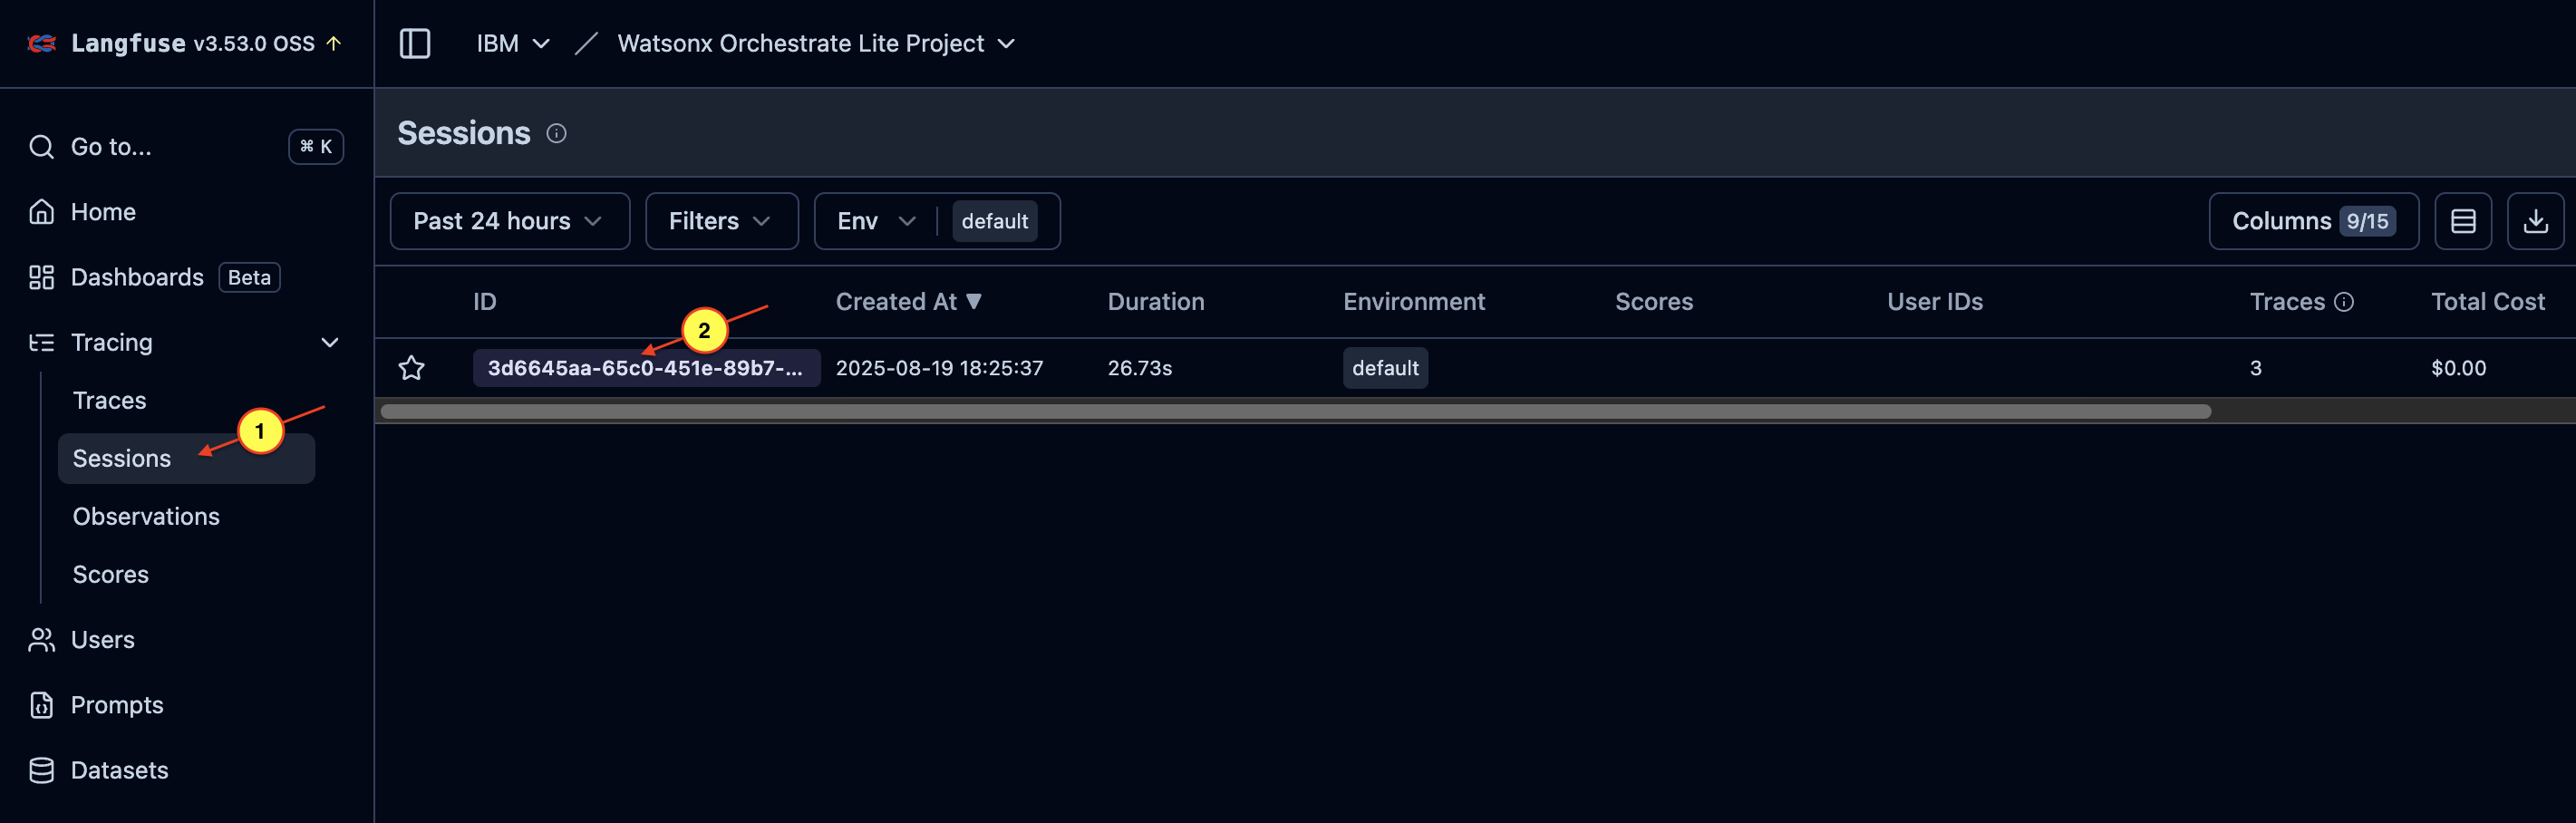
e. Click a session to view the entire chat interaction, including:
- Content
- Context
- Metadata such as token usage
- Model details
- Agent interaction including multi-agent workflows
Langfuse setup (SaaS) on watsonx Orchestrate
Connect your watsonx Orchestrate environment to a hosted Langfuse instance. This approach gives you observability without managing local infrastructure, while still offering detailed traces and analytics. This section shows how to create a Langfuse account, generate API keys, configure watsonx Orchestrate, and monitor agent behavior through the Langfuse dashboard.
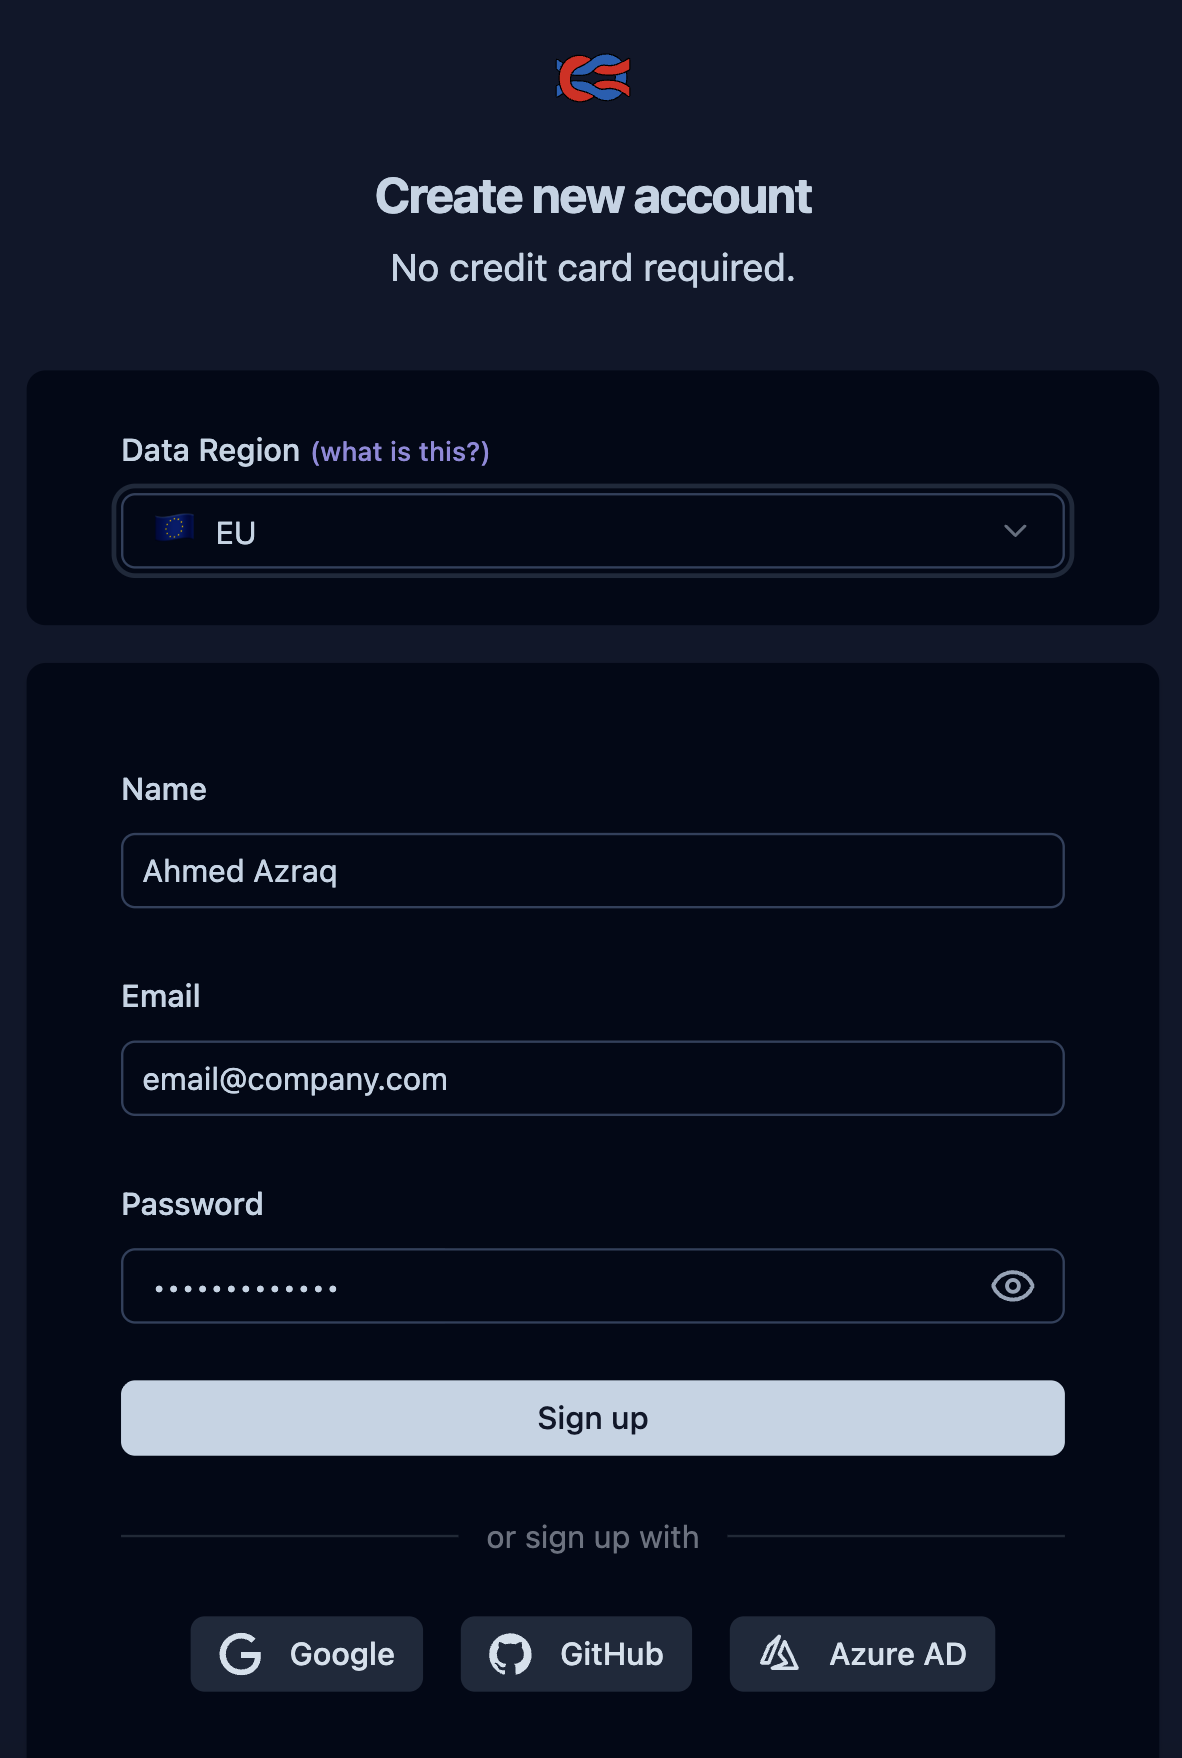
To create a trial Langfuse account, go to https://cloud.langfuse.com/ and click Sign up.
Enter your details and click Sign up or use your social login.
Create an organization in Langfuse and generate an API Key to integrate with watsonx Orchestrate.
a. On the Langfuse home page, click New Organization.

b. Name the organization
watsonx-Orchestrateand click Create.c. Click Next to skip inviting members. You can add them later.
d. Name the project
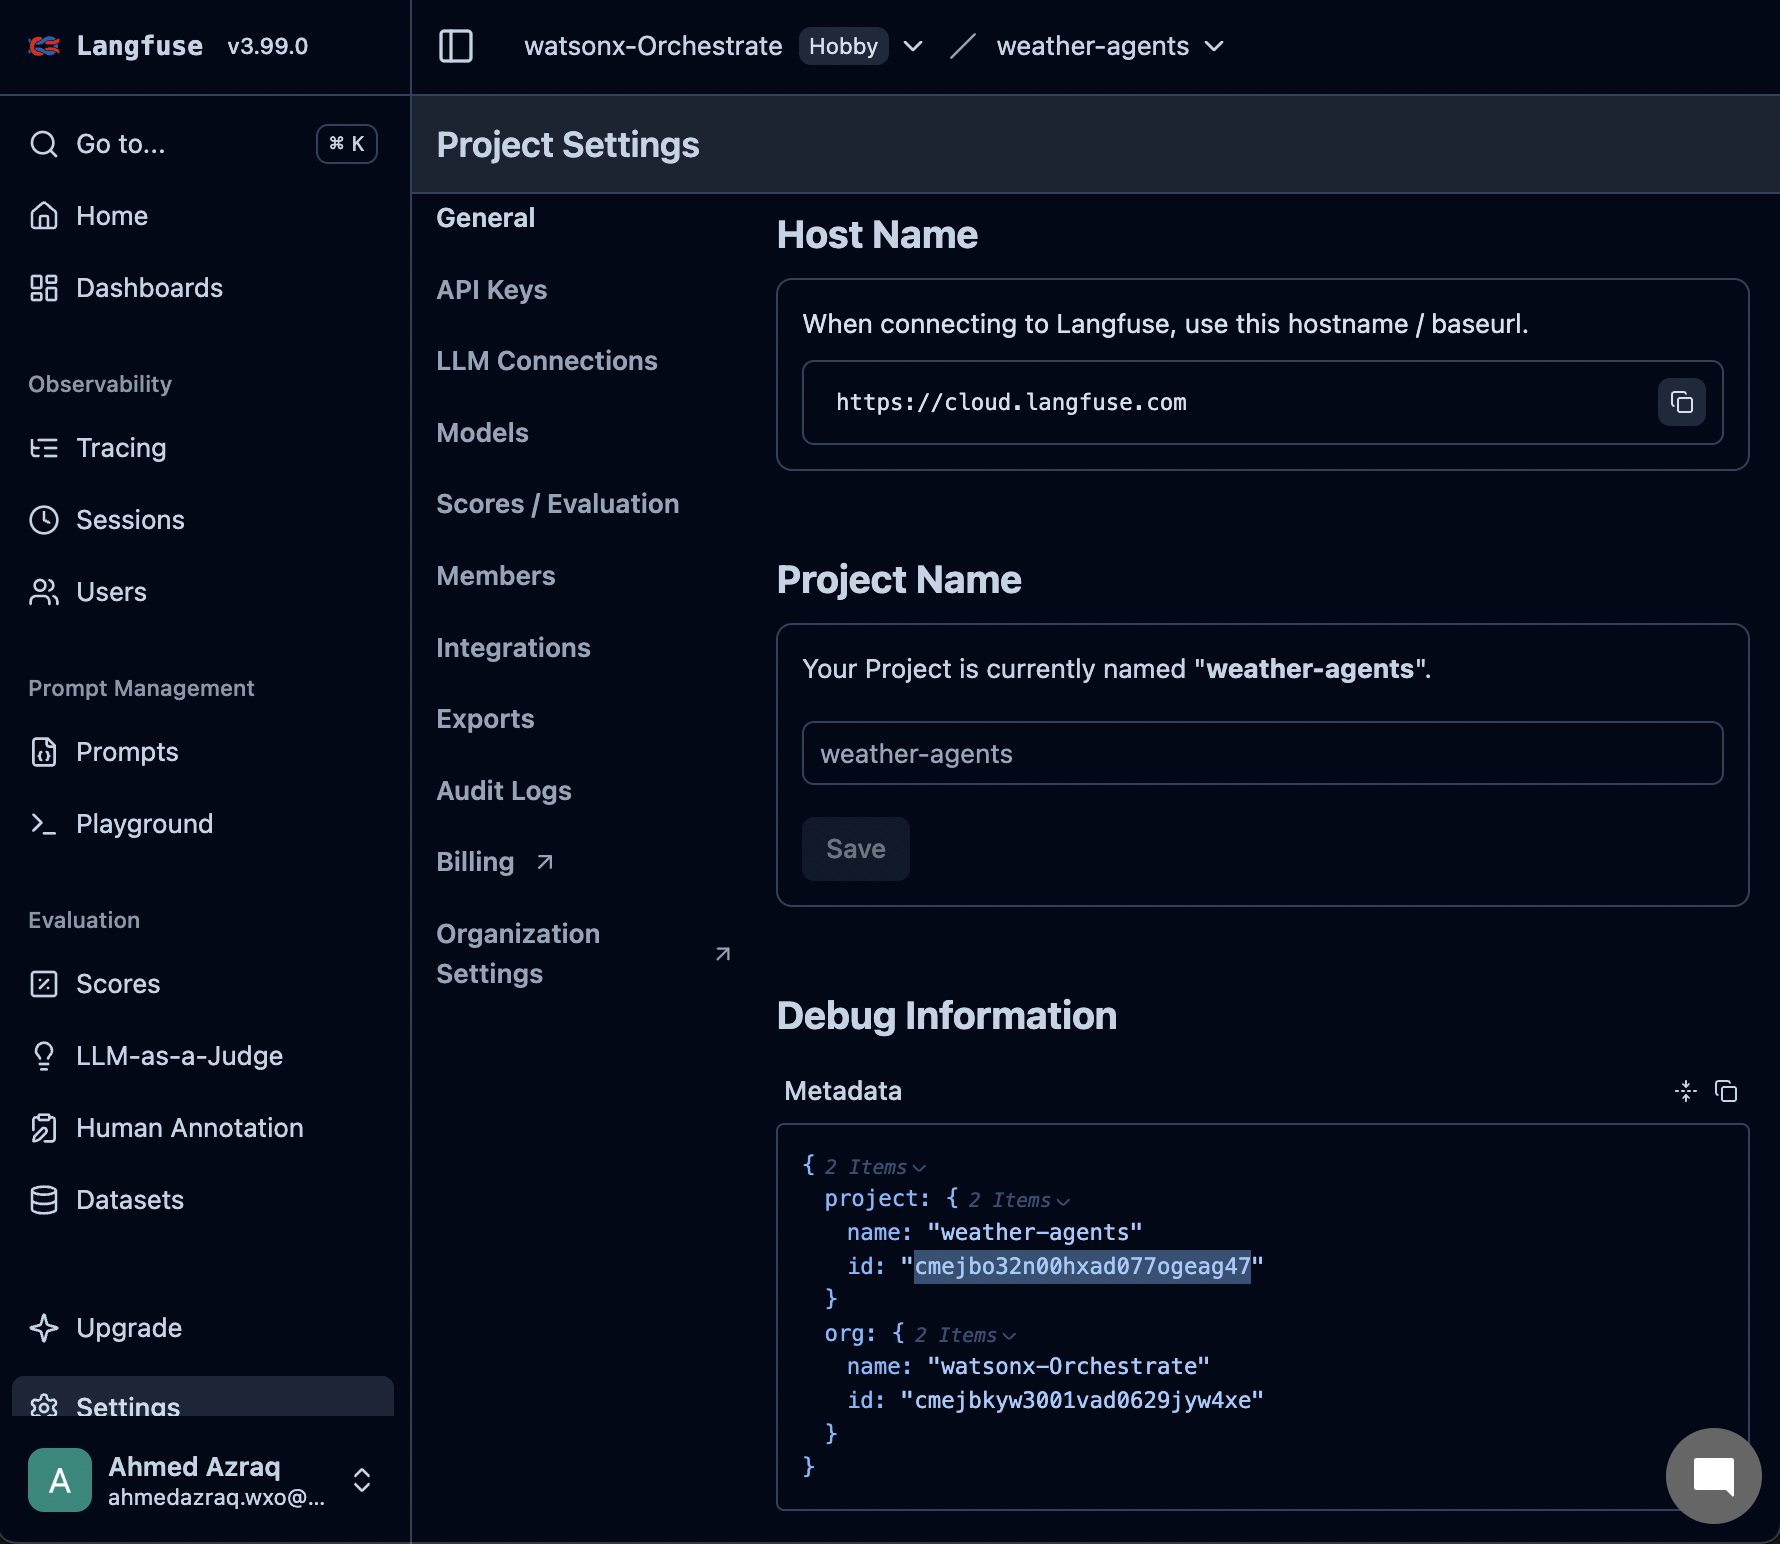
weather-agentsand click Create.e. In the Project Settings page, copy the Host Name.
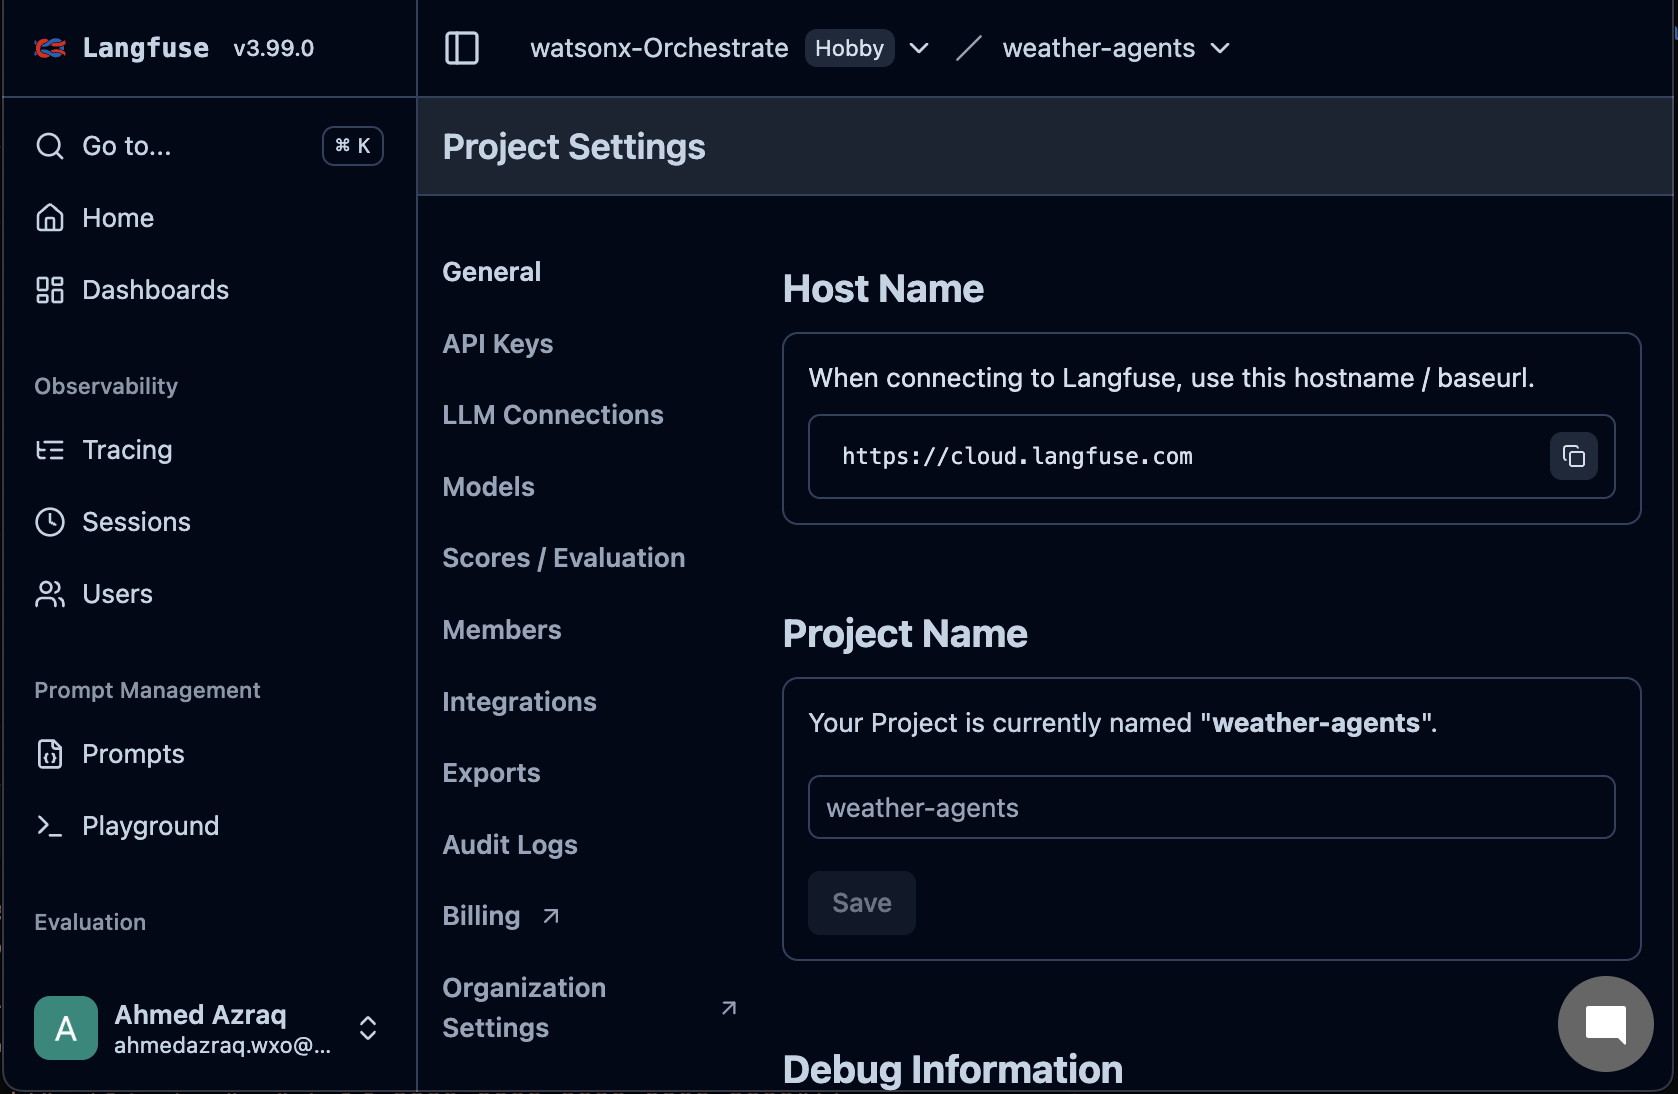
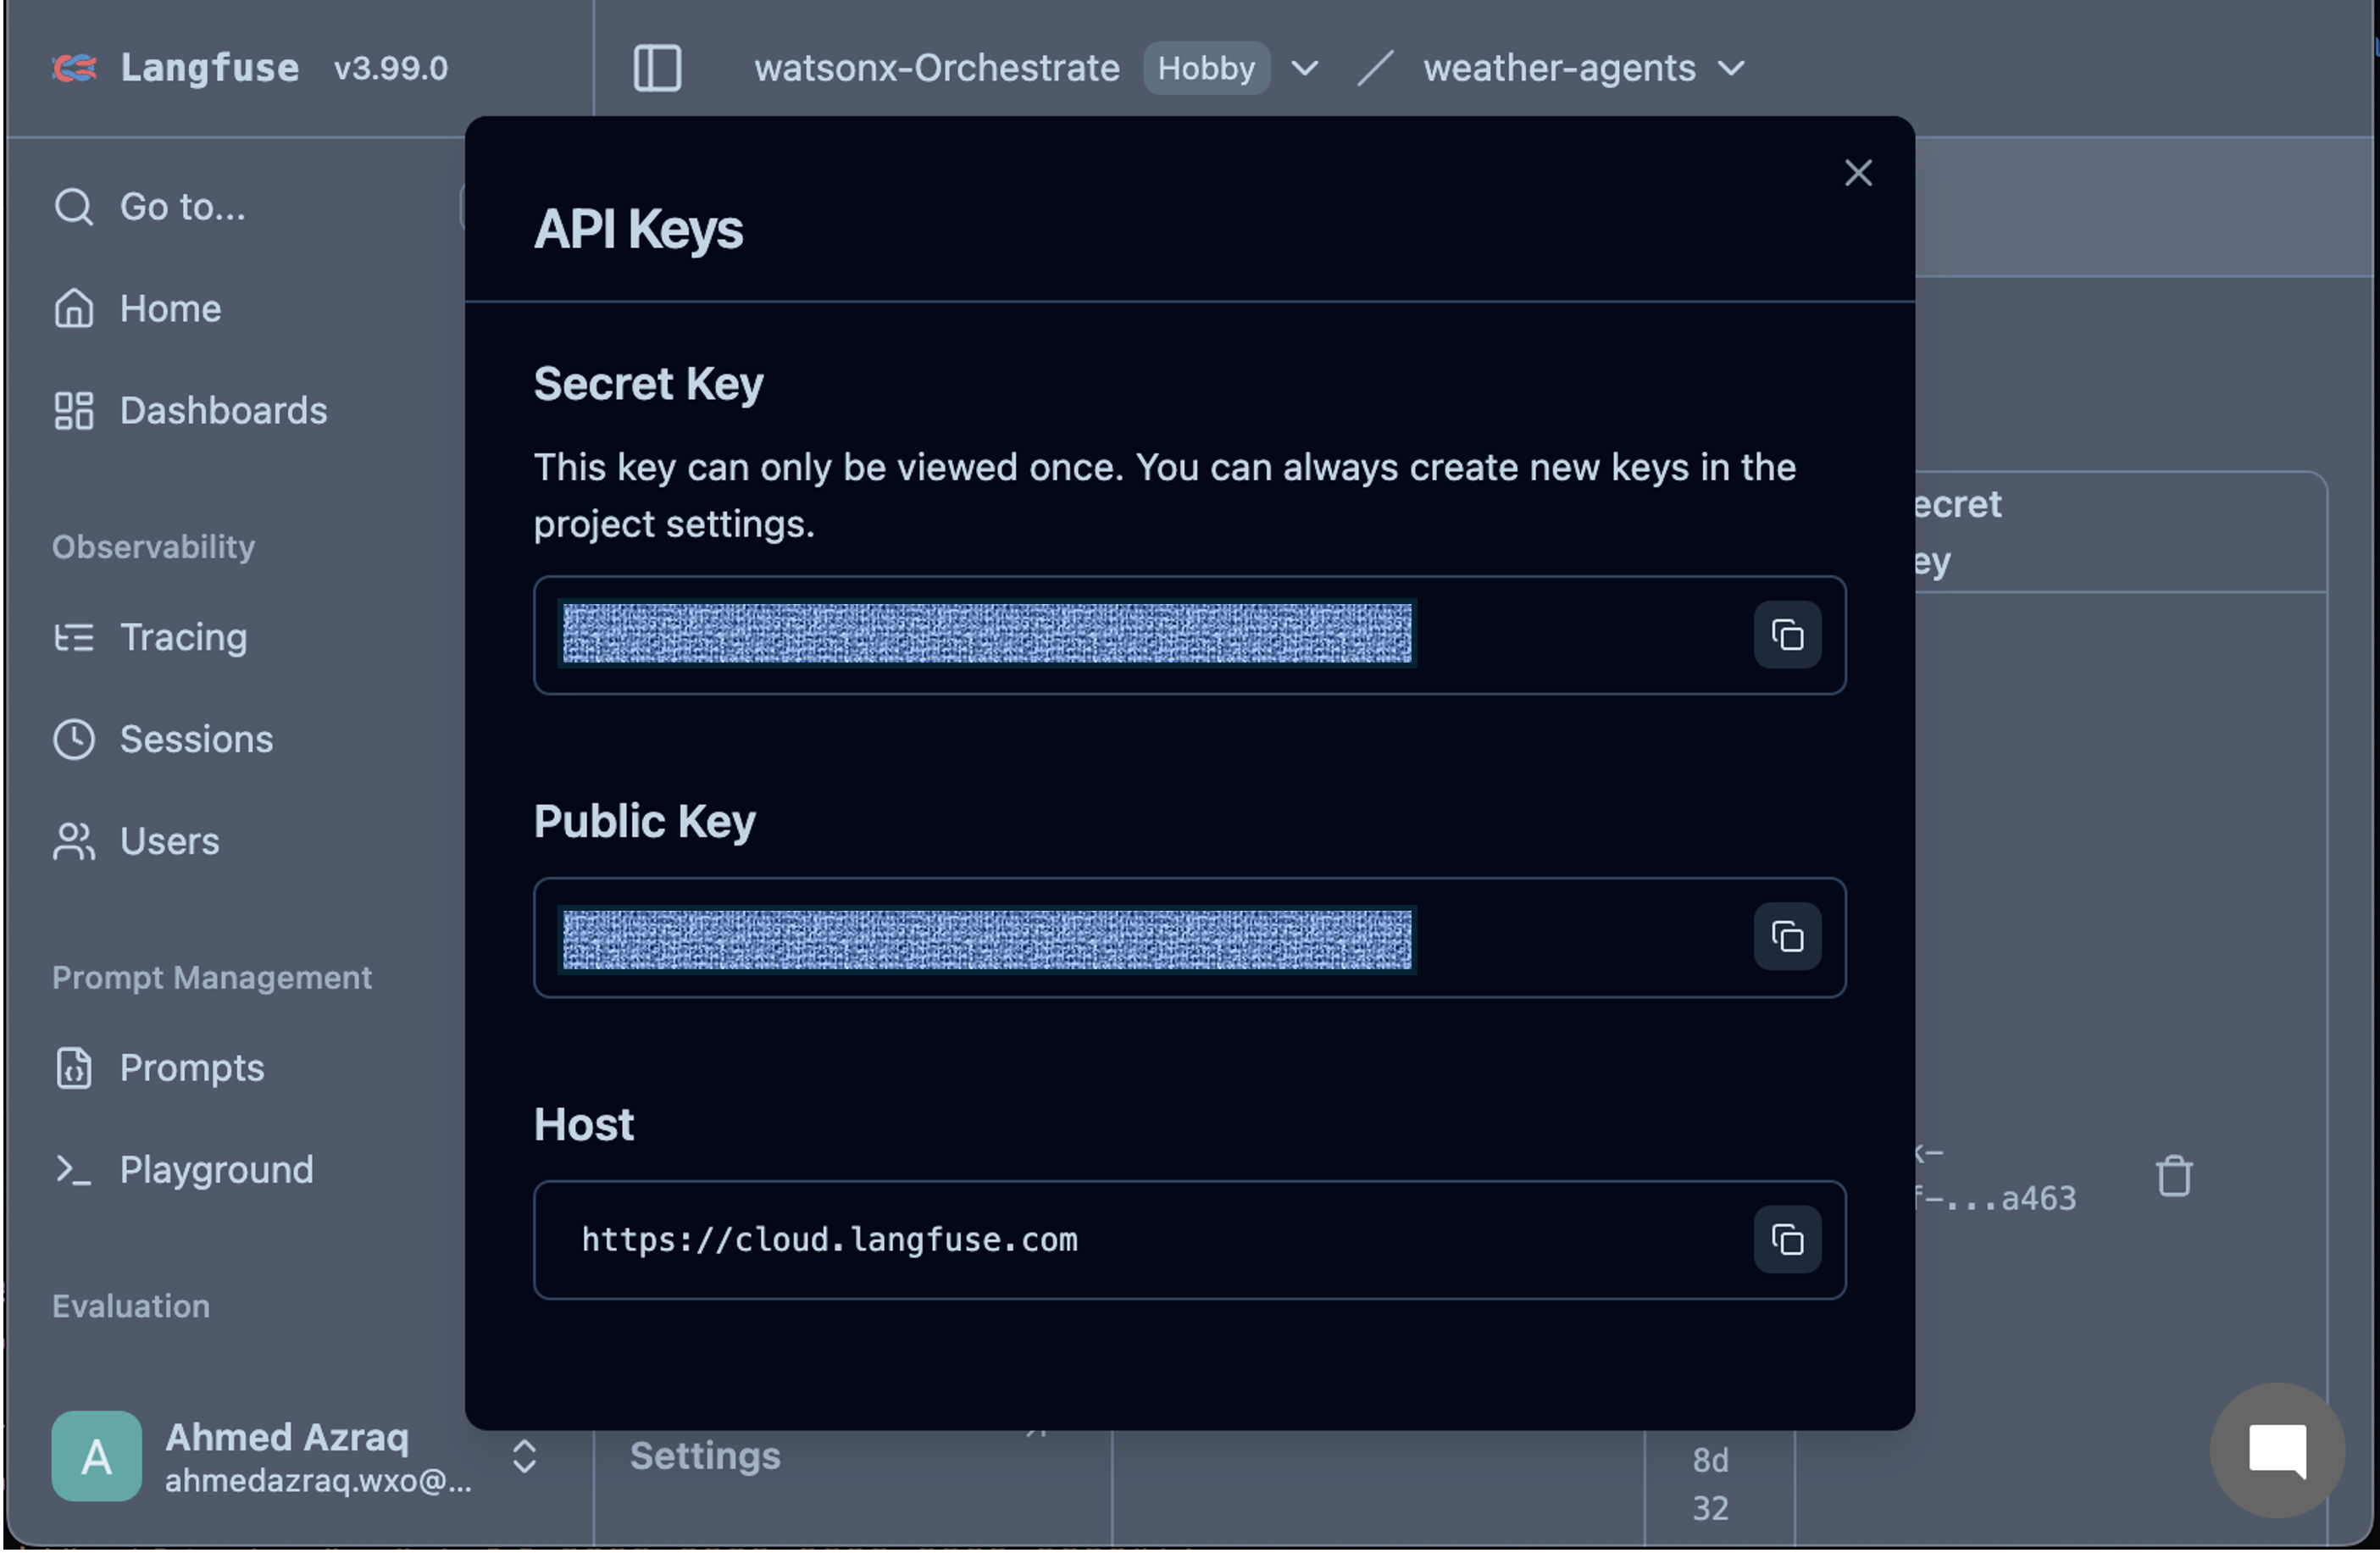
f. Click API Keys and then click Create new API keys, and copy the Secret Key and Public Key.
Go back to the General page and copy the project ID from the metadata section.
Configure watsonx Orchestrate to connect to the external or SaaS Langfuse instance by running the following command in your terminal.
orchestrate settings observability langfuse configure \
 --url "<Replace with your hostname>/api/public/otel" \
 --api-key "<Replace with your Secret Key>" \
 --health-uri "https://cloud.langfuse.com" \
 --config-json '{"public_key": "<Replace with your Public Key>"}' \
 --project-id "<Replace with your project ID>"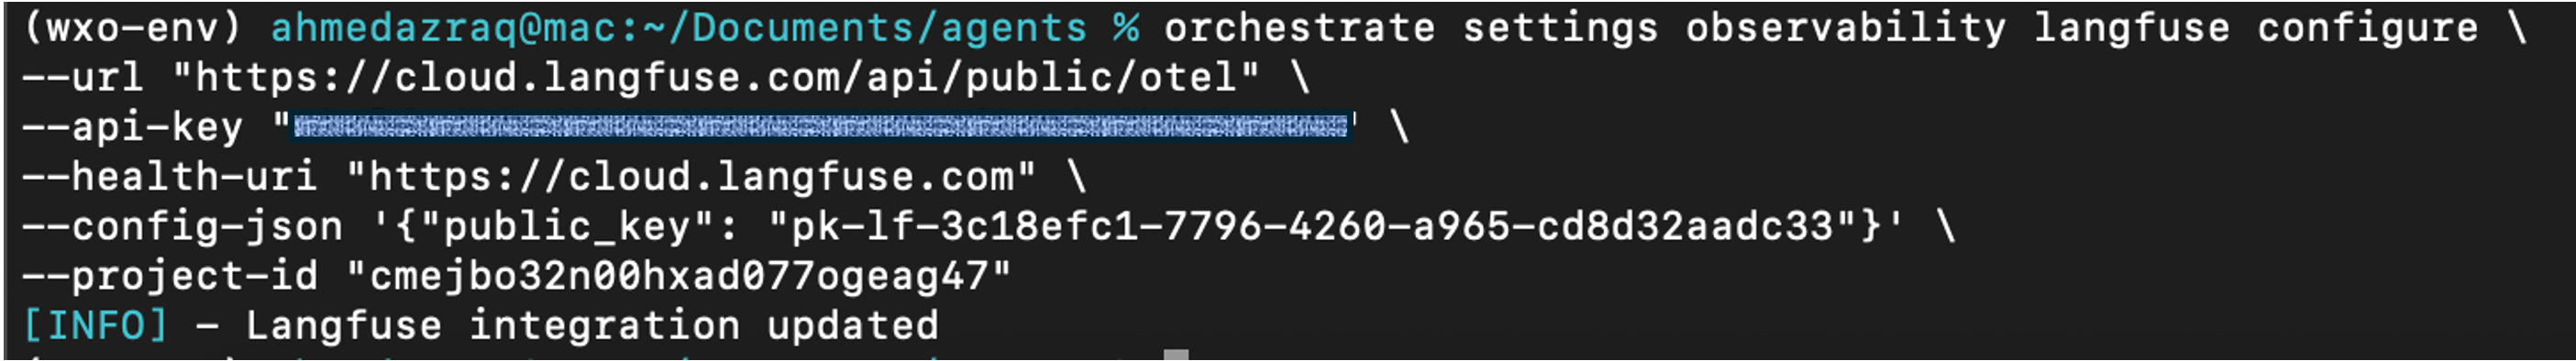
Note: The steps in this section apply to a local watsonx Orchestrate instance. To configure Langfuse with a SaaS watsonx Orchestrate environment, first add and activate the watsonx Orchestrate environment. For instructions, see Configuring your environments in watsonx Orchestrate ADK. After activation, link the SaaS watsonx Orchestrate environment to Langfuse.
Chat with the same Weather alert agent that you created.
Observe the agent behavior on Langfuse. This step works the same way as described in Step 5 onwards in the Langfuse setup on watsonx Orchestrate ADK section.
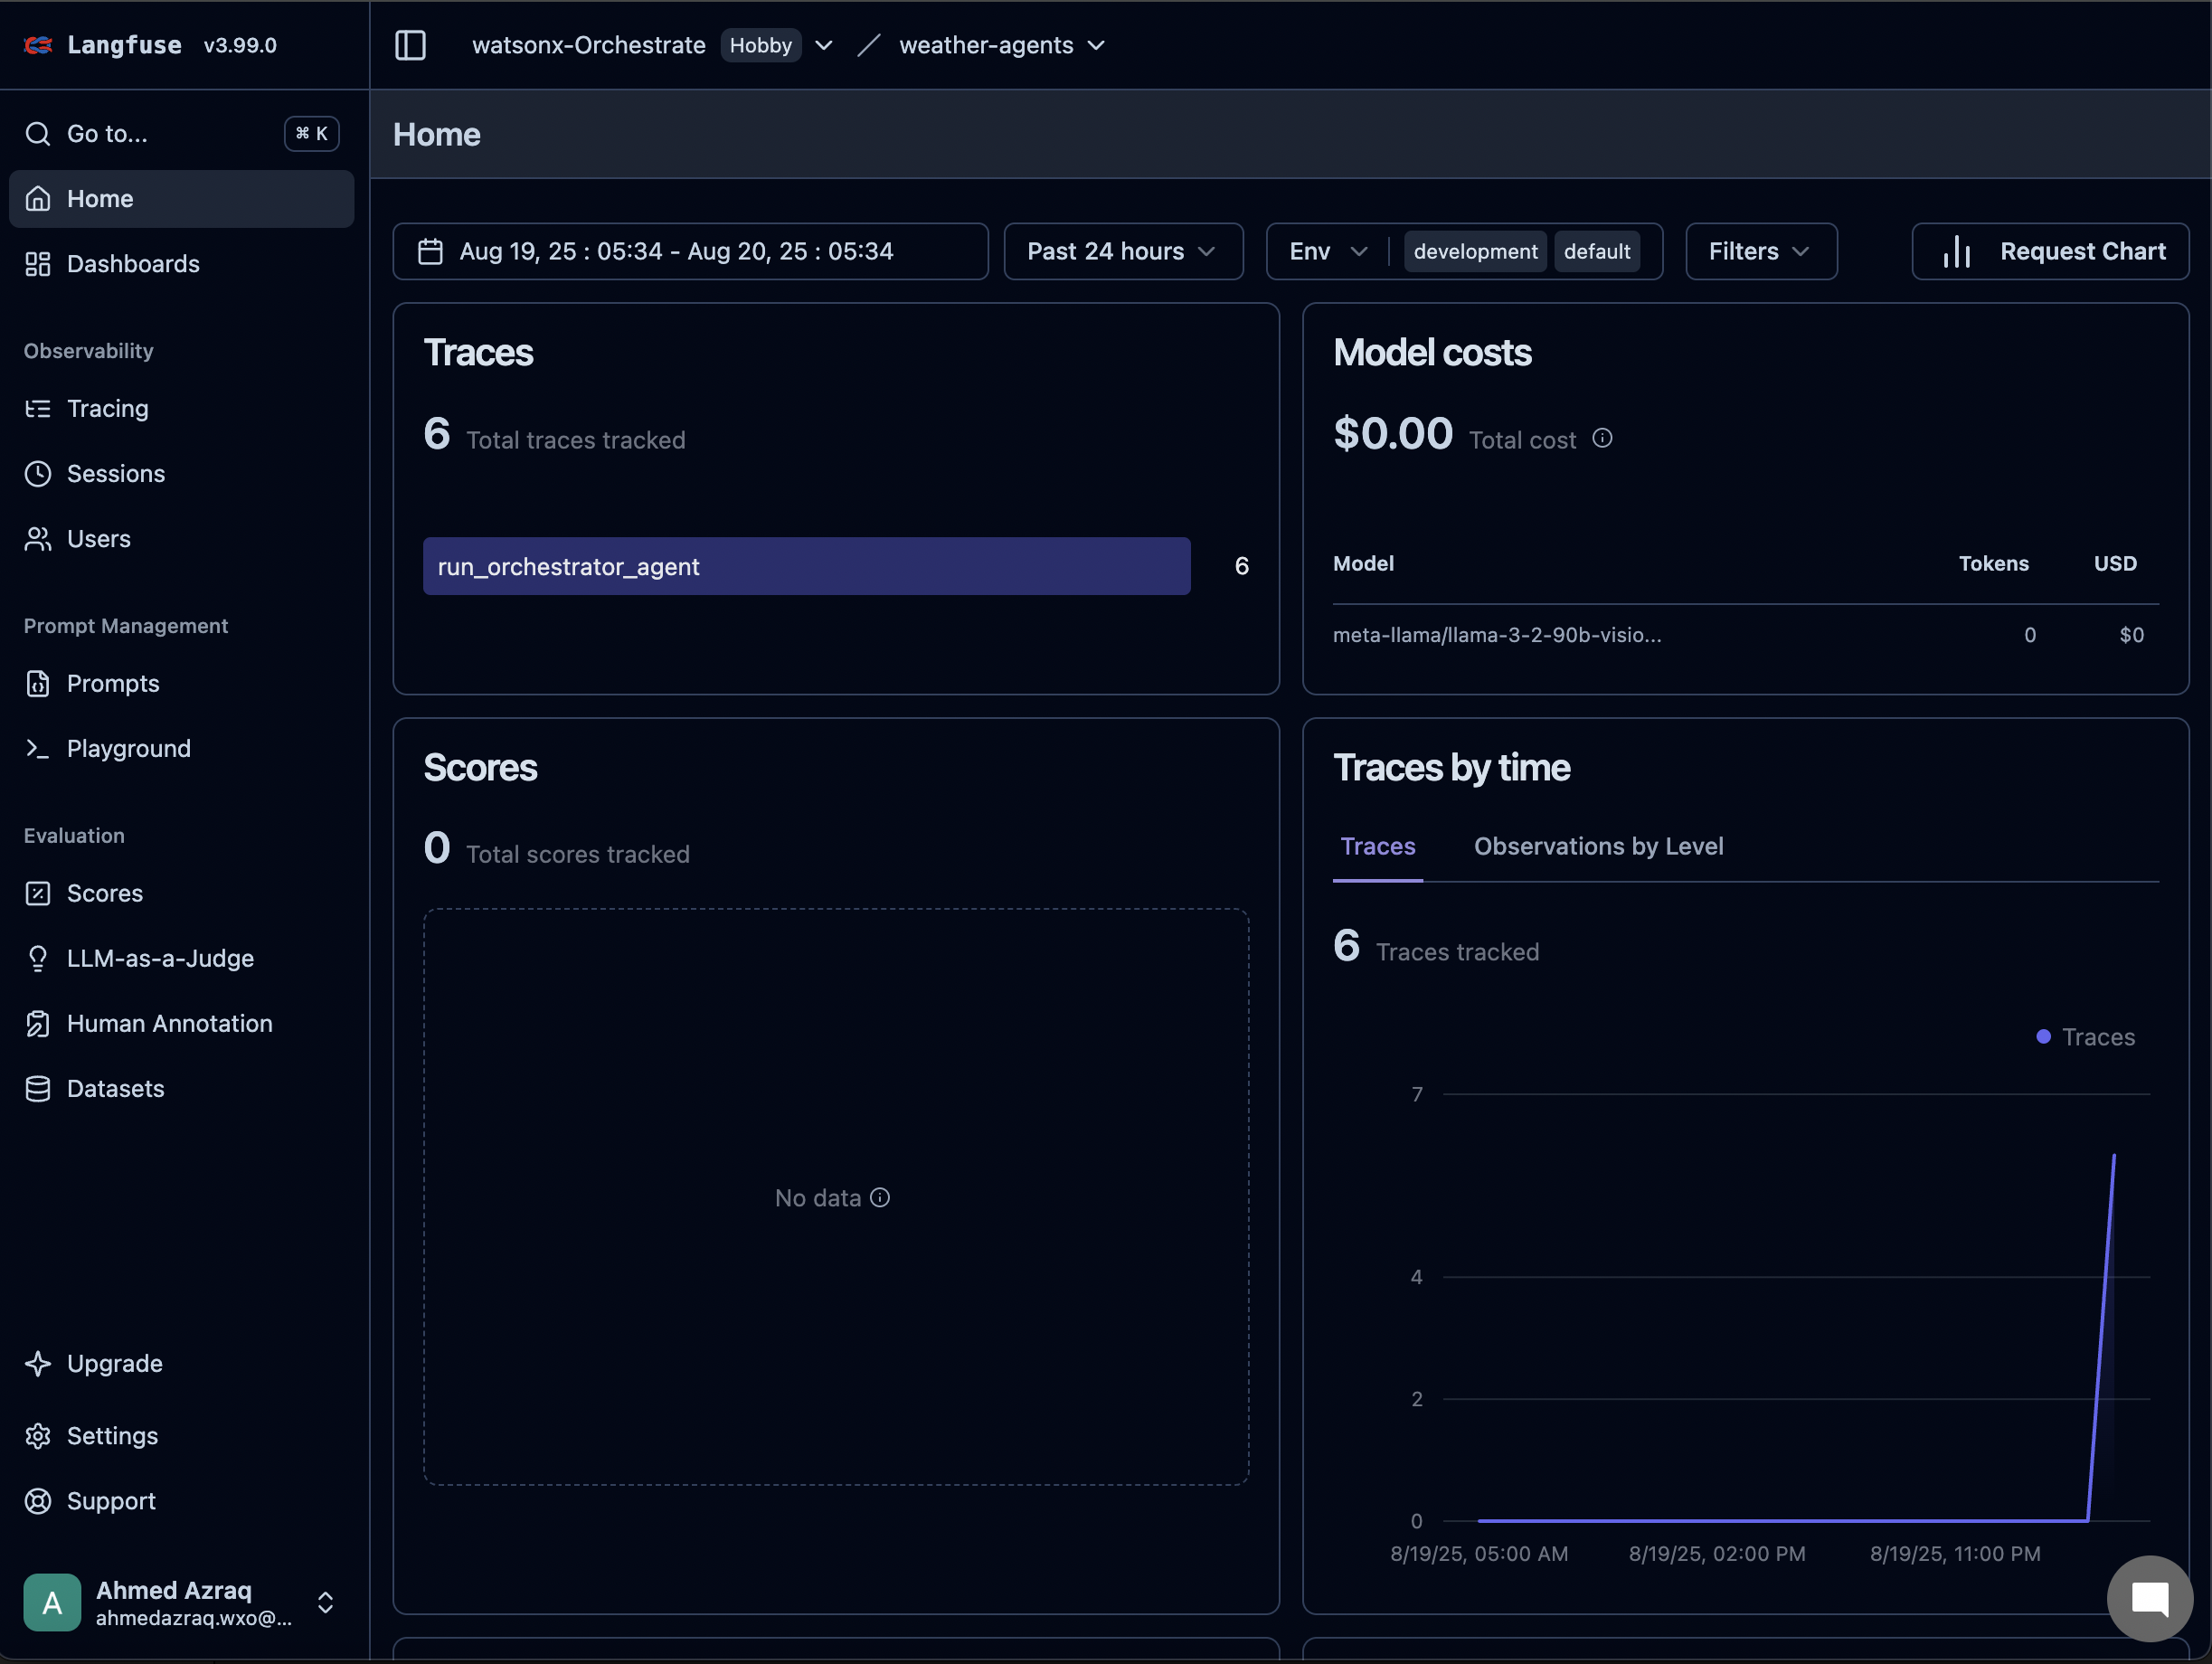
a. On the Langfuse home page, you can see the number of calls, indicating successful integration.
b. Click Sessions and then open the latest session to view details.
Agent Analytics on watsonx Orchestrate
The Agent Analytics uses built-in tools in watsonx Orchestrate, powered by IBM Telemetry. It provides a dashboard to track agent performance, including message volume, failures, and response times, helping you spot issues and compare agents. This section provides instructions for using the SaaS watsonx Orchestrate instance to access analytics, explore traces, and troubleshoot with detailed insights.
If you do not have a watsonx Orchestrate SaaS instance, create a trial account at watsonx Orchestrate trial.
On the watsonx Orchestrate home page, click Manage agents.
Create an agent with the following details and then click Deploy.
- Name: Weather Alert Agent
Description: Monitors temperature and sends alerts about any weather-related issues.
Click Agent chat and select the agent from the Agents list to start chatting. You can try any messages.
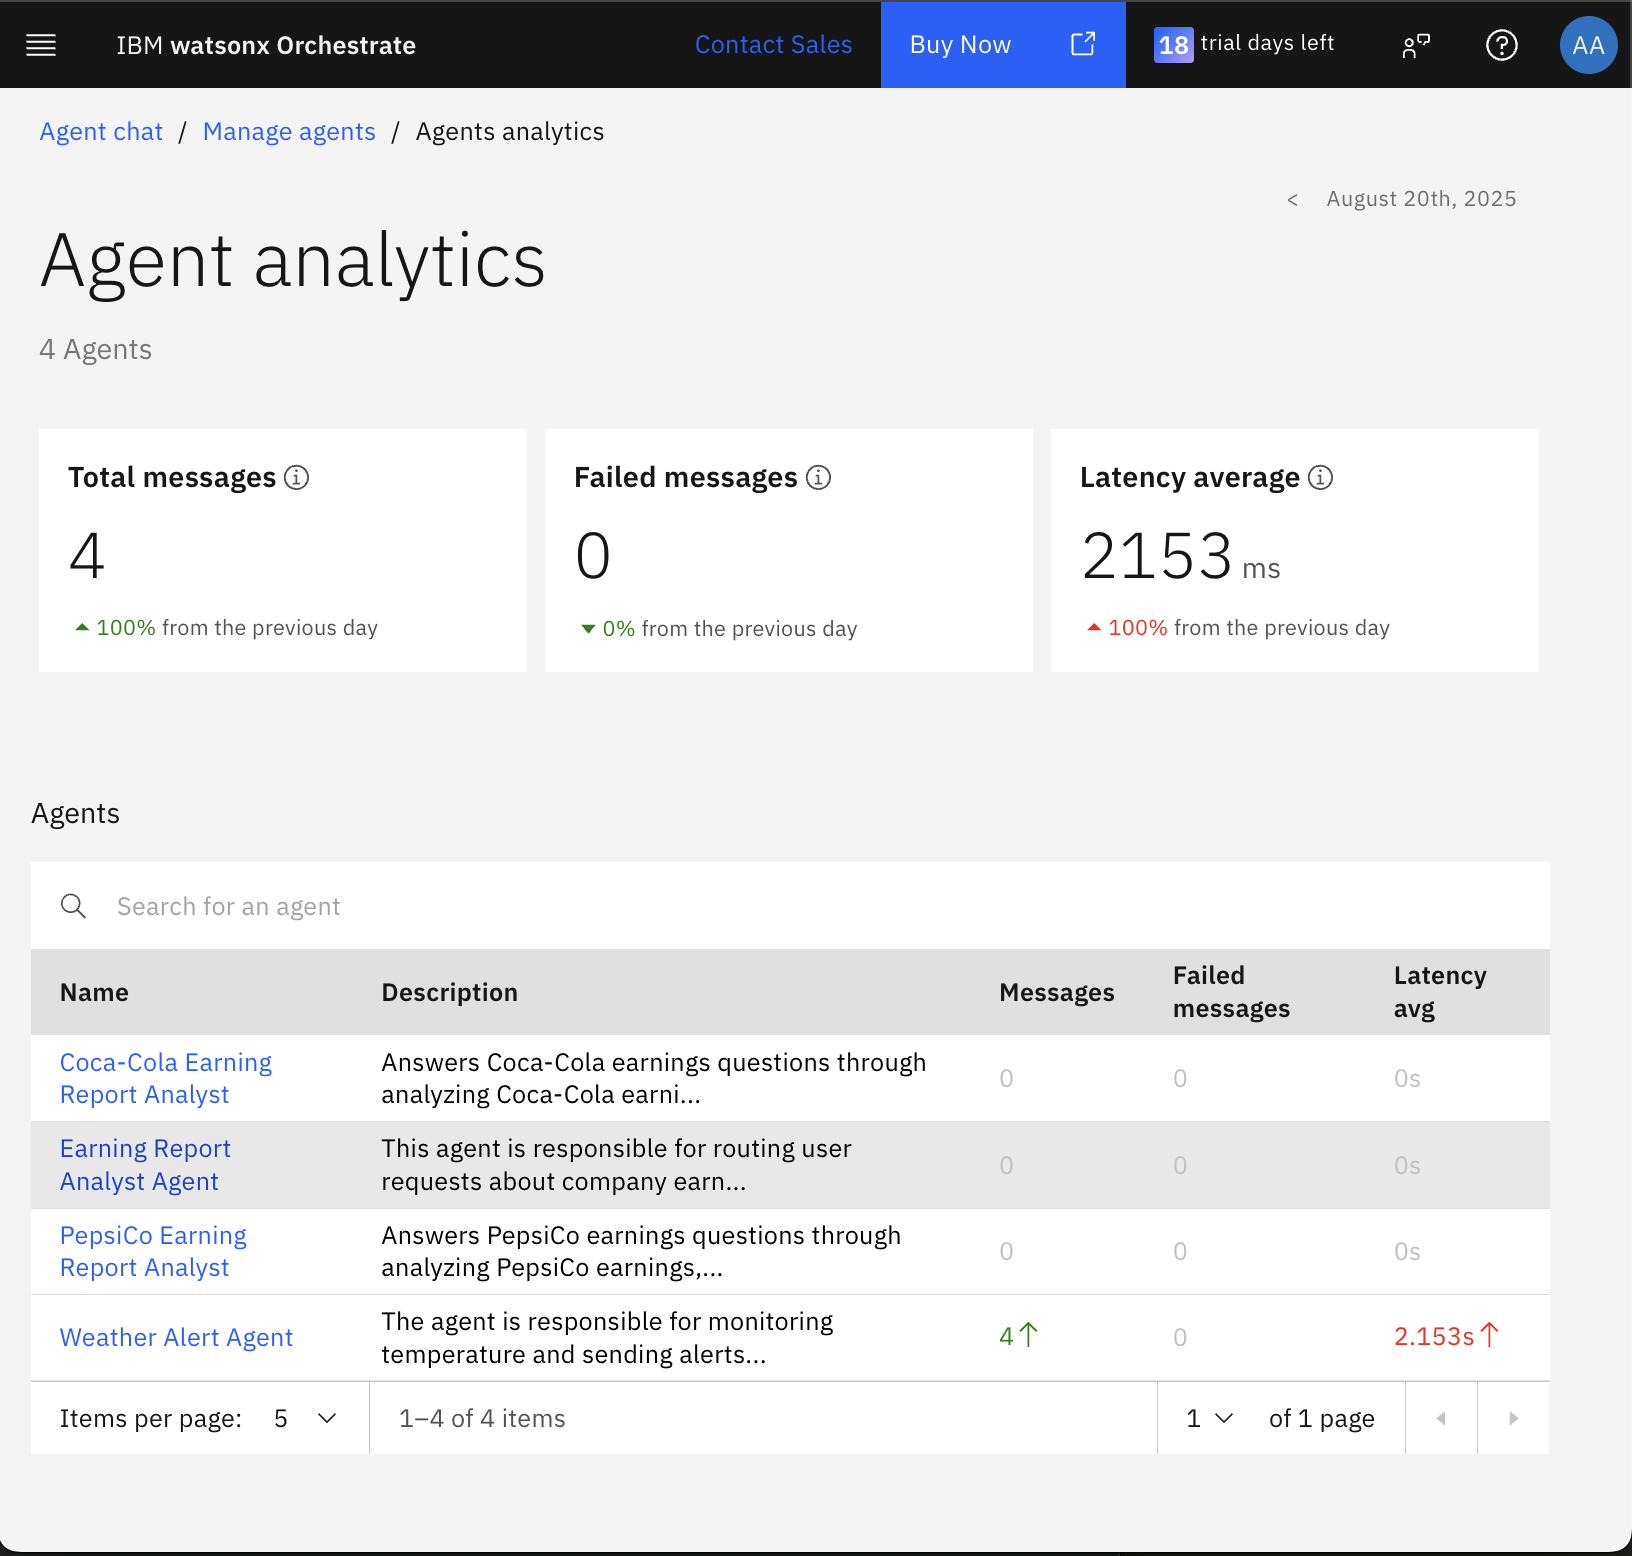
Click Manage agents to open Agent Analytics. You can view:
- Total messages: Number of interactions or queries handled.
- Failed messages: Requests that failed due to errors or timeouts.
Latency average: Average response time in milliseconds (a lesser value is better).
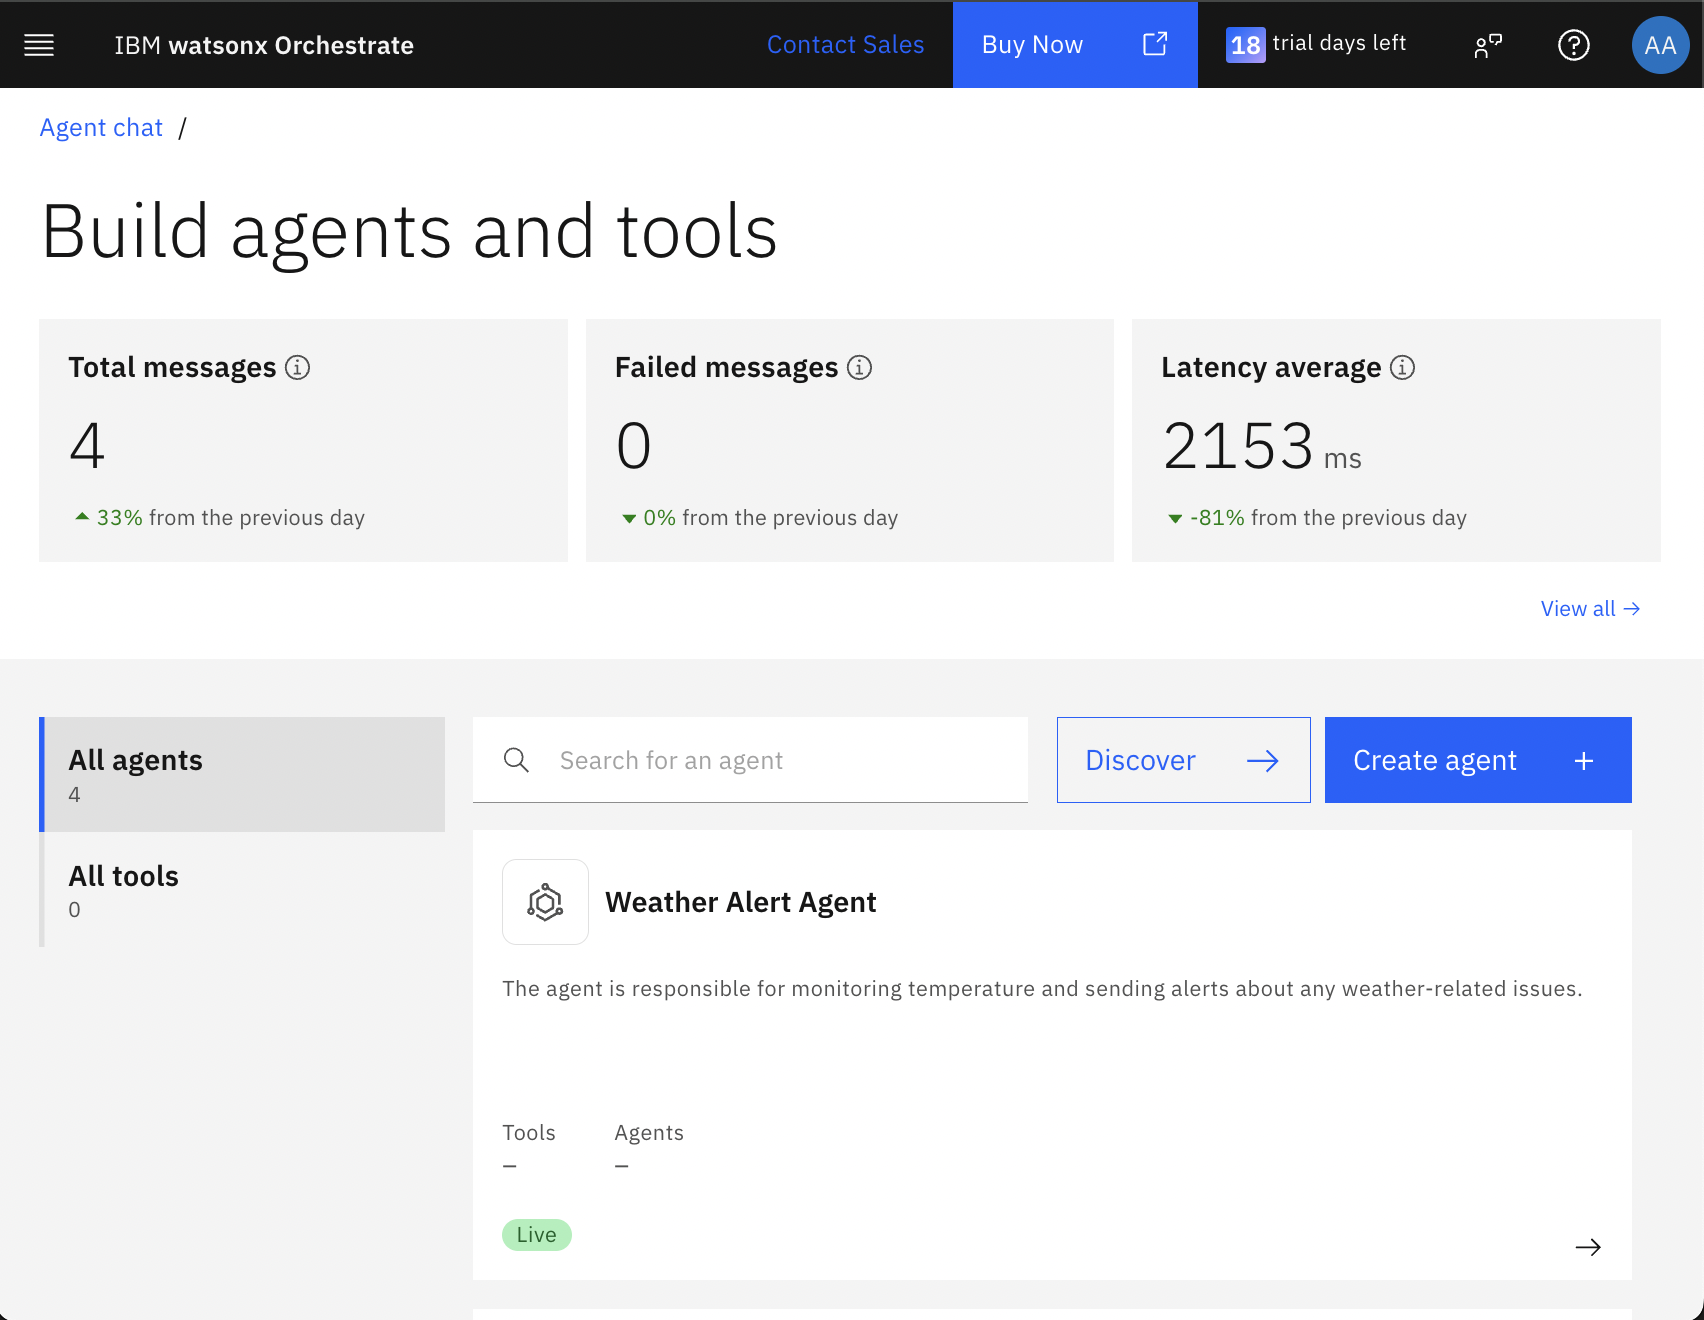
Click View all to view detailed analytics for each agent.
Click Weather Alert Agent to view its analytics. You can see individual traces and filter by date.
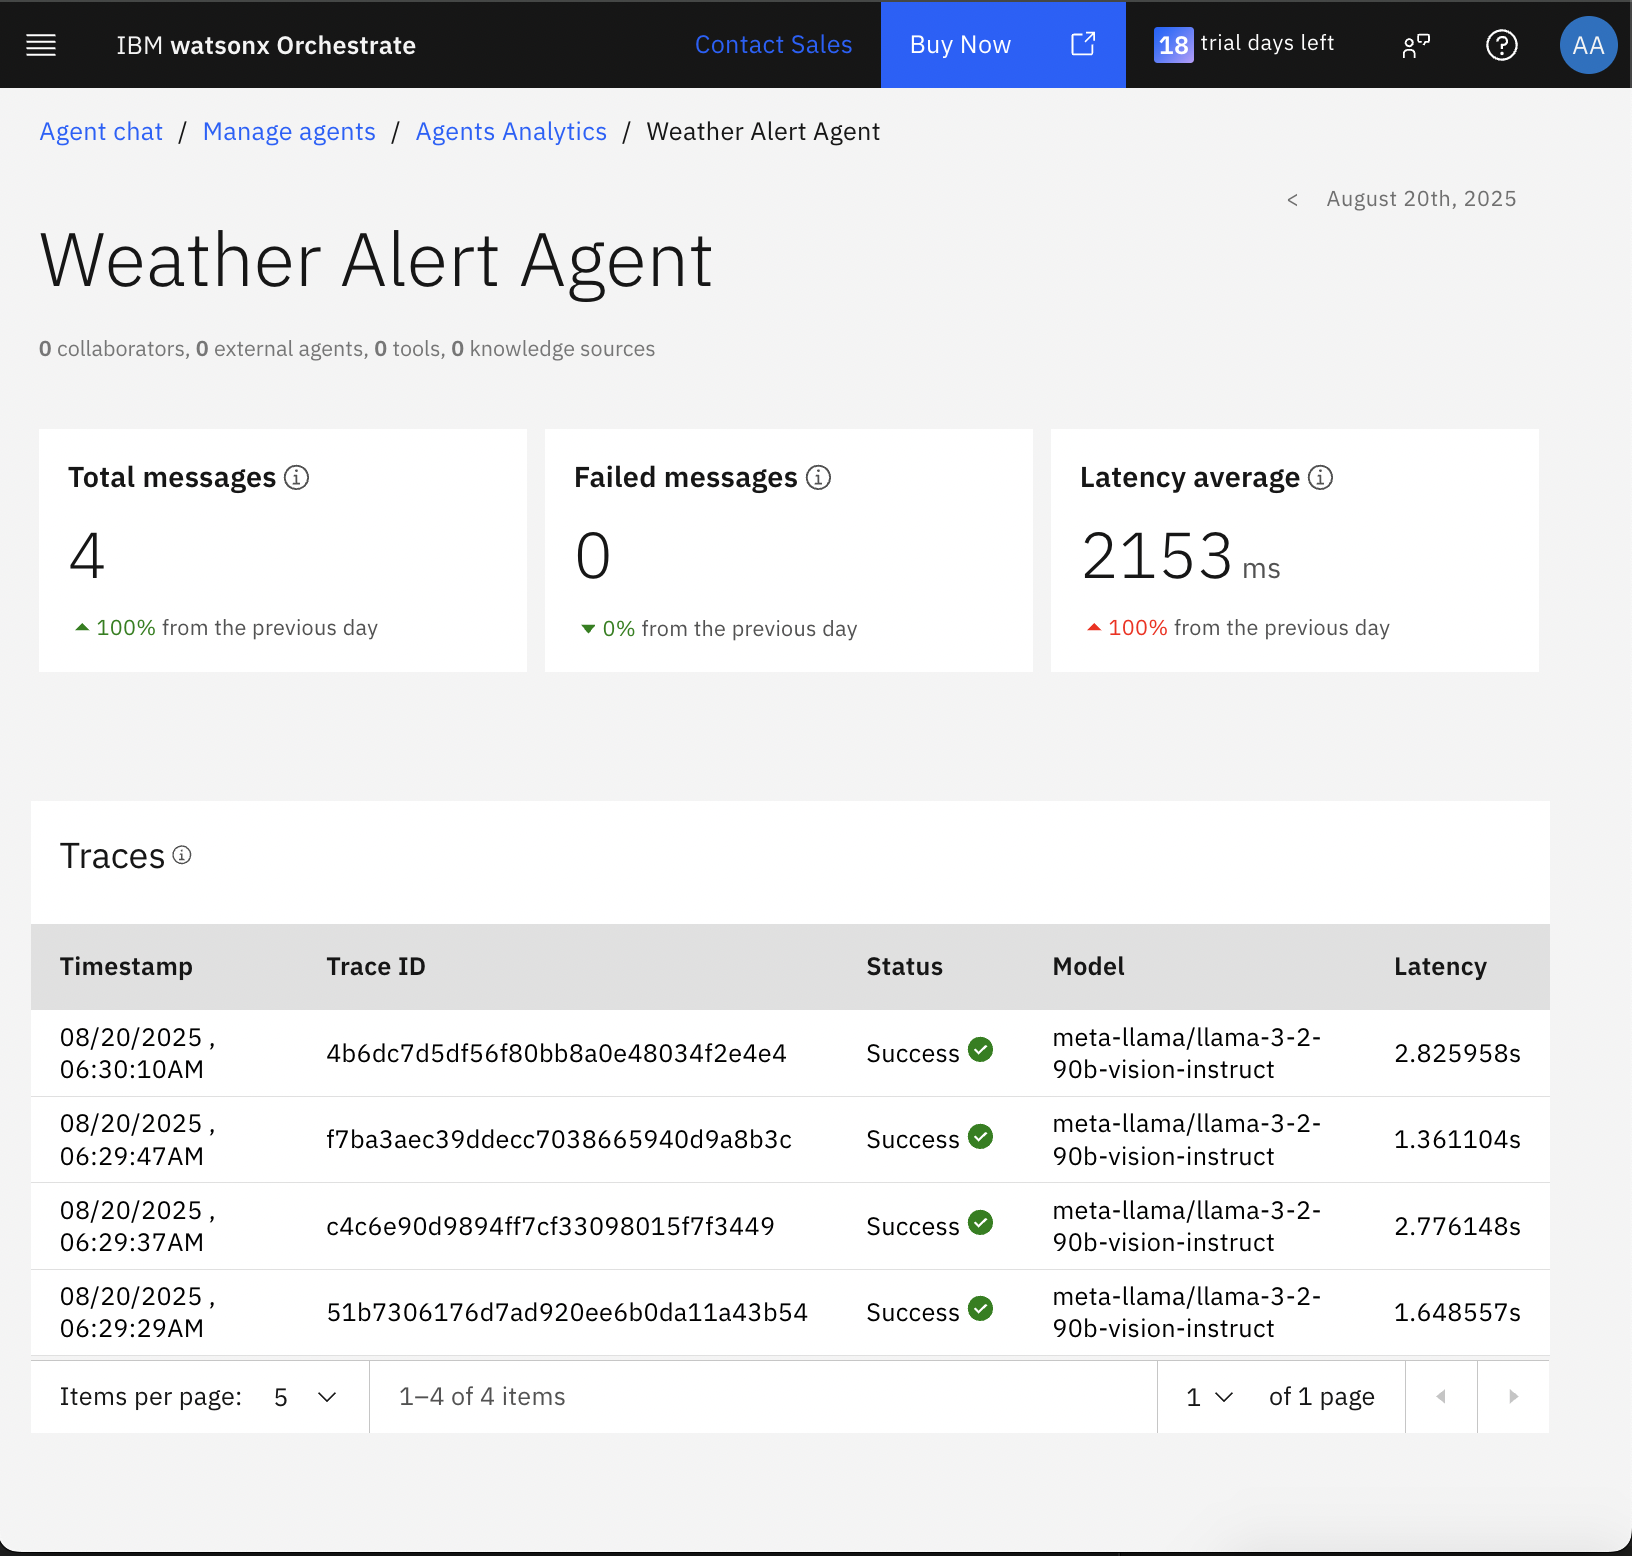
Click a trace to view detailed information.

Summary and next steps
In this tutorial, you have learned how to add observability to agents on watsonx Orchestrate using IBM Telemetry and Langfuse. In short, AgentOps and LLM Observability treat AI agents as production systems with the same rigor as any critical service. Without this, scaling AI in the enterprise is risky and hard to sustain.
You learned how to set up and configure both tools with the watsonx Orchestrate Agent Development Kit (ADK) to track, monitor, and analyze agent interactions. You also explored how to connect watsonx Orchestrate to a SaaS instance for deeper insights.
You were introduced to Agent Analytics, a built-in feature of watsonx Orchestrate that shows metrics such as message volume, failures, and response times. You have learned how to drill down into individual traces to troubleshoot and optimize agent performance.
As a next step, you can explore IBM Instana, which provides observability for complex enterprise applications, including applications built by using watsonx Orchestrate and your other enterprise applications, providing a holistic end-to-end view. Instana’s AI-powered monitoring capabilities help you gain deeper insights into your application stack performance and behavior to provide a complete view of your application ecosystem.
Acknowledgments
This tutorial was produced as part of the IBM Open Innovation Community initiative: Agentic AI (AI for Developers and Ecosystem).
The authors deeply appreciate the support of Ela Dixit, Mithun Katti, and Bindu Umesh for the guidance and expertise on reviewing this tutorial.