This is a cache of https://digg.com/data-viz/link/water-violations-by-state-us-safe-drinking. It is a snapshot of the page at 2025-01-12T01:20:45.279+0000.
Thi<strong>s</strong> <strong>s</strong>tate Ha<strong>s</strong> More Water Violation<strong>s</strong> Than Anywhere El<strong>s</strong>e In The U<strong>s</strong> | Digg

gulp

This state Has More Water Violations Than Anywhere Else In The Us

This State Has More Water Violations Than Anywhere Else In The US
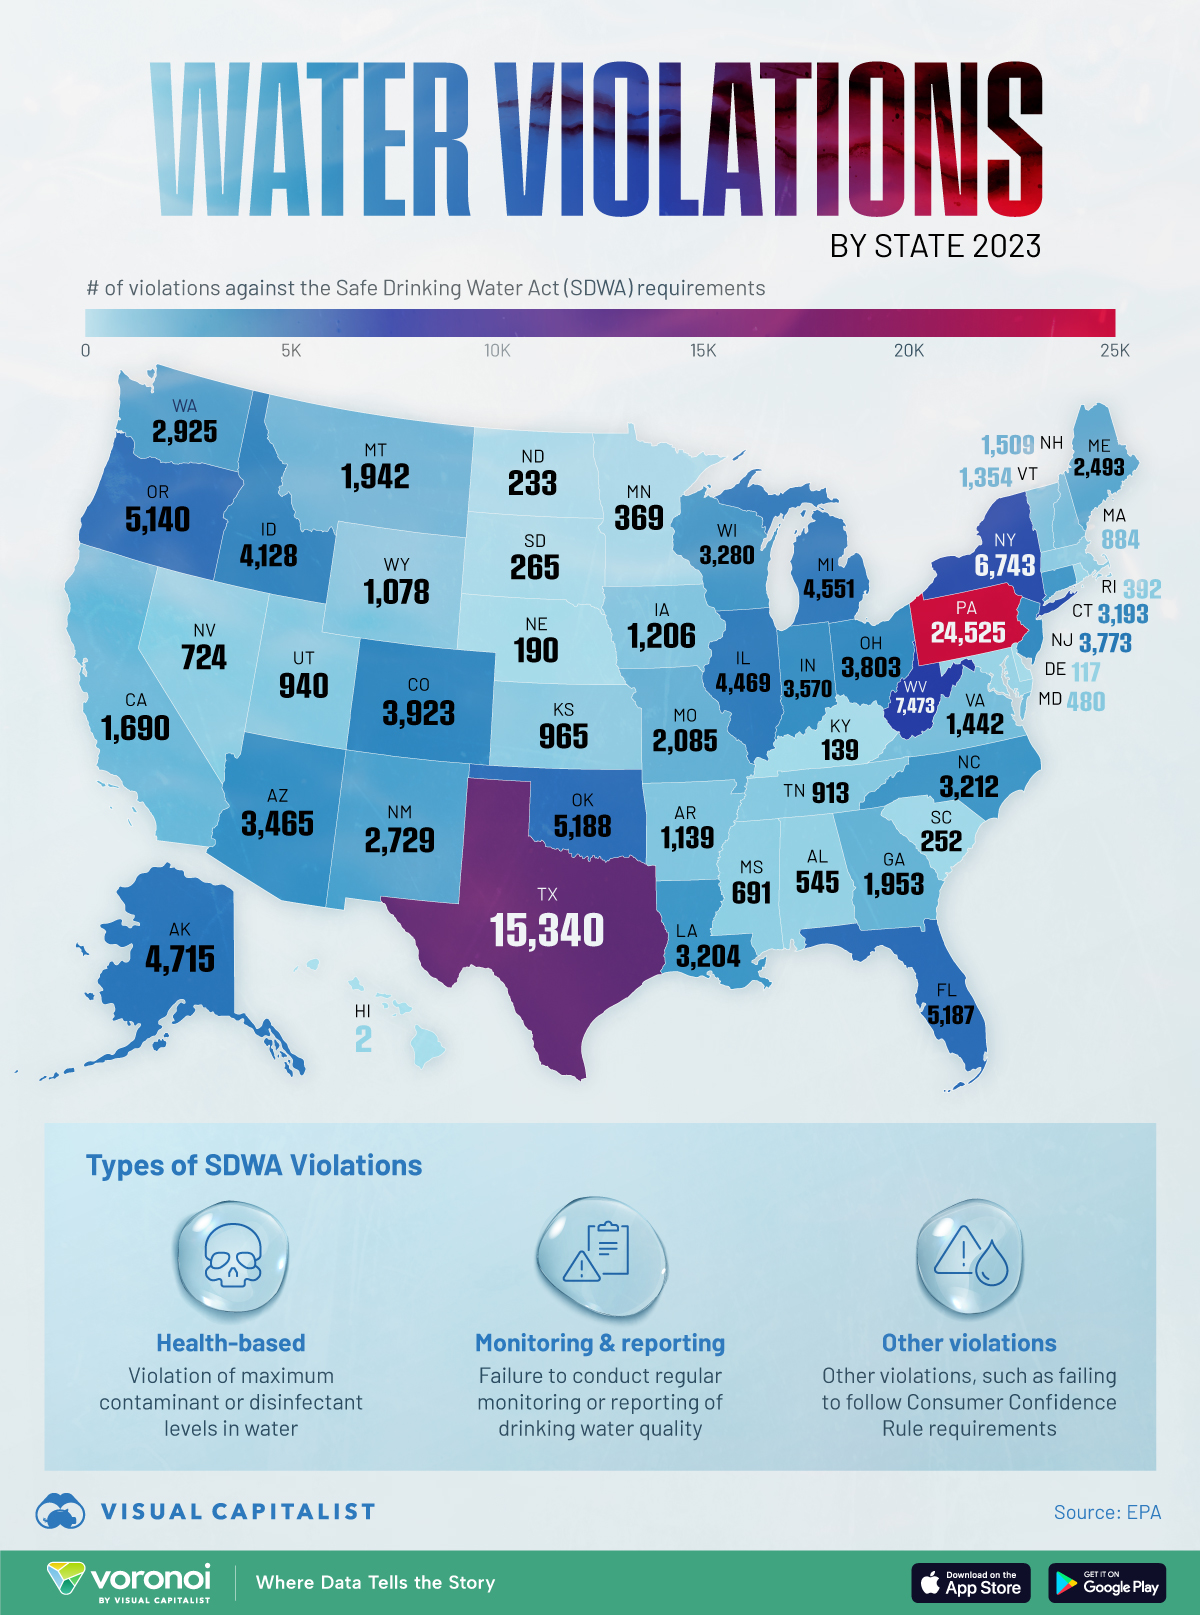
In 2023, the highest-ranking state had 24,525 safe Drinking Water Act violations.
· 8.2k reads ·
· ·

According to the Environmental Protection Agency, there are three types of safe Drinking Water Act violations: health-based, monitoring and reporting, and other violations, which include failure to to issue consumer confidence reports or conduct periodic sanitary surveys.

Using EPA data, Visual Capitalist mapped the number of water violations recorded in each Us state as of 2023.

Pennsylvania had by far the most water violations in the country, with 24,525, followed by Texas (15,340). Third-placed West Virginia had far fewer total, at 7,473.

The lowest number of water violations were found in Hawaii, where just two were reported in 2023. Delaware (117) had the second-fewest.

Note: violations are assigned to the public water systems within each state, of which there are often thousands. You can explore the data and methodology in more detail here.

Click image to enlarge

water violations by US state

Via Visual Capitalist.

Comments

  1. Mikey Mike 3 days ago

    Completely useless without scale, per capita, or gallons of water used. If Texas used 1.5 million gallons of water and North Dakota used 500 gallons, then 1% of Texas water is bad and 50% of ND is bad (maybe). Lazy, simpleton clickbait.

    1. Unknown 1 day ago

      Yes and no. You can use other states as a scale. California has almost 8 million more people than Texas and yet they have just 10% of the number of violations as Texas.You can also gauge Texas against Florida and New York versus their number of violations. Texas has more agriculture than NY, but NY has more urban areas thus more water usage. Which brings up another point. What is the water used for? Almost 40% of water is for agriculture in CA versus 53% in TX, but Texas has almost 9 times the violations? That in itself tells a story.


Cut Through The Chaos With Digg Edition

sign up for Digg's daily morning newsletter to get the most interesting stories. sent every morning.