About cookies on this site Our websites require some cookies to function properly (required). In addition, other cookies may be used with your consent to analyze site usage, improve the user experience and for advertising. For more information, please review your options. By visiting our website, you agree to our processing of information as described in IBM’sprivacy statement. To provide a smooth navigation, your cookie preferences will be shared across the IBM web domains listed here.
Tutorial
Cloud-native LLM observability with IBM Instana
Monitor LLM applications with cloud-hosted observation with IBM Instana
On this page
Large language models (LLMs) are driving a new era of AI applications, from chatbots and virtual assistants to automated document processing and beyond. As these systems scale, maintaining visibility into their performance, reliability, and cost becomes critical. Traditional monitoring tools often struggle to capture the dynamic and complex behavior of LLM-based workflows. We can monitor our LLM application in one of two ways:
- Local-hosted observation
- Cloud-hosted observation
In this tutorial, we will cover cloud-hosted observation. (We cover local-hosted observation in this other tutorial.)
IBM Instana is a powerful application performance monitoring (APM) tool and observability platform that is built to deliver real-time, enterprise-grade insights across modern, distributed applications.
- Delivers accurate, real-time data with full contextual visibility for all teams.
- Provides high-fidelity telemetry with no sampling, 1-second metric granularity, and end-to-end tracing.
- Helps reduce alert noise through intelligent issue detection and automation
- Enables clear visibility into dependencies across mobile, web, applications, and infrastructure, supporting 300+ technologies.
- Offers a user-friendly, quick-to-deploy solution with no specialized expertise required and transparent, predictable pricing.
With Instana, organizations can achieve deep observability into LLM workloads—enabling proactive performance tuning, faster troubleshooting, and better cost control.
Architecture overview
Observability is crucial for understanding the behavior, performance, and cost of generative AI applications. IBM Instana makes this possible by capturing and visualizing telemetry from large language model (LLM) workflows in real time.
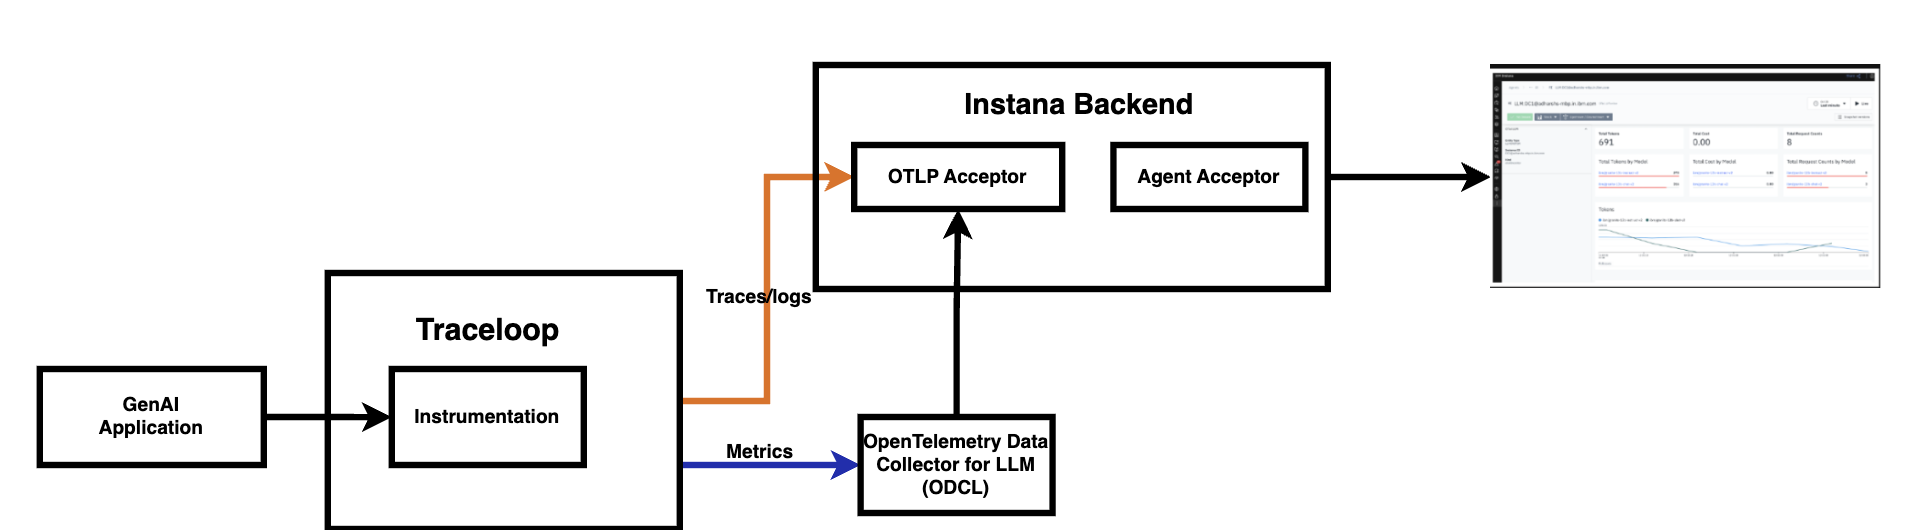
In this local-hosted setup, the generative AI application is instrumented using the Traceloop SDK, which collects key telemetry signals—traces, logs, and LLM-specific metrics, as the model processes requests. These signals are then exported to Instana using one of two supported modes: agent mode or agentless mode, depending on your deployment needs.
Instana supports two flexible telemetry pipelines:
Agent Mode. Telemetry data is routed through a local Instana Agent, which enriches the data before forwarding it to the Instana backend. LLM-specific metrics like token usage, latency, and request cost are collected via a dedicated OpenTelemetry Data Collector (ODCL) and sent through the same agent for unified processing.
Agentless Mode: For lighter-weight deployments, traces and logs are sent directly to Instana's OTLP acceptor, bypassing the agent entirely. This mode is ideal for containerized, serverless, or edge environments where deploying an agent just isn’t feasible.
This tutorial walks you through the Agentless Mode telemetry pipeline to set up observability for LLM applications using IBM Instana. The Agentless architecture offers a more scalable and cloud-native observability pipeline.
Instead of running the Instana Agent locally, telemetry data, especially traces, will be sent directly to the Instana backend OTLP endpoint. Additionally, we’ll host ODCL externally, either on IBM Code Engine or a virtual machine (VM), to collect and forward LLM-specific metrics.
In the local agent architecture, only applications running locally on the same machine as the Instana Agent and ODCL could send their traces and metrics to the Instana UI. However, in this agentless architecture, ODCL is hosted remotely, allowing multiple users or applications, regardless of where they're running, to send their telemetry data to Instana. This is achieved by pointing them to the endpoint of the deployed ODCL, enabling a more scalable and shared observability pipeline.
Specifically, in this tutorial, you’ll learn how to:
- Deploy the OpenTelemetry Data Collector (ODCL) remotely on IBM Code Engine or a virtual machine to collect LLM-specific metrics.
- Configure your generative AI application to send traces and logs directly to Instana’s OTLP endpoint, bypassing the local agent.
- Instrument your application with the Traceloop SDK to capture detailed telemetry, including token usage, request cost, and latency.
- Run the application and explore traces, logs, and metrics in the Instana UI to identify performance trends, detect bottlenecks, and optimize cost.
Setting up ODCL
For setting up ODCL as part of a cloud-native observability pipeline, we have two deployment options: one using IBM Code Engine for a fully managed cloud server environment, and another using a Virtual Machine (VM) for greater control and customization. Choose the approach that best fits your needs.
Deploying ODCL in a Virtual Machine (VM)
The first approach is to setup the ODCL in a VM and send the traces and logs to it, which will then be forwarded to otlp-acceptor in the Instana backend.
First, you need to get a VM and get connected to it:
- Request for an Ubuntu VSI on IBM Cloud. See the docs for how to request and access it.
- Once the instance is ready, get the
public_ip,port, andssh_keyand keep them handy. Also, raise a support ticket to open the port 8000 as by default no port is open for VSI. It may take some time to get the port open. To get connected to the VM, run this command:
ssh -v -i <ssh_key> -p <port> ubuntu@<public_ip>
Next, you need to set up ODCL in the VM:
Install Java 11 using this command:
sudo apt install openjdk-11-jre-headlessDownload ODCL using this command:
wget https://github.com/instana/otel-dc/releases/download/v1.0.7/otel-dc-llm-1.0.7.tarYou can opt for the latest version available, but we used v1.0.7.
Unzip the file using this command:
tar -xvf otel-dc-llm-1.0.7.tarYou should have a folder named
otel-dc-llm-1.0.7with three subfolders:bin,config, andlib.
Now, you need to configure ODLC.
Open the
config.yamlfile and change the value ofotel.backend.urltohttp://<instana-backend-otlp-acceptor>:4317. Also, update theotel.service.portto 8000, or whatever port you opened for it.Review the required endpoints for ODCL in the Instana docs.
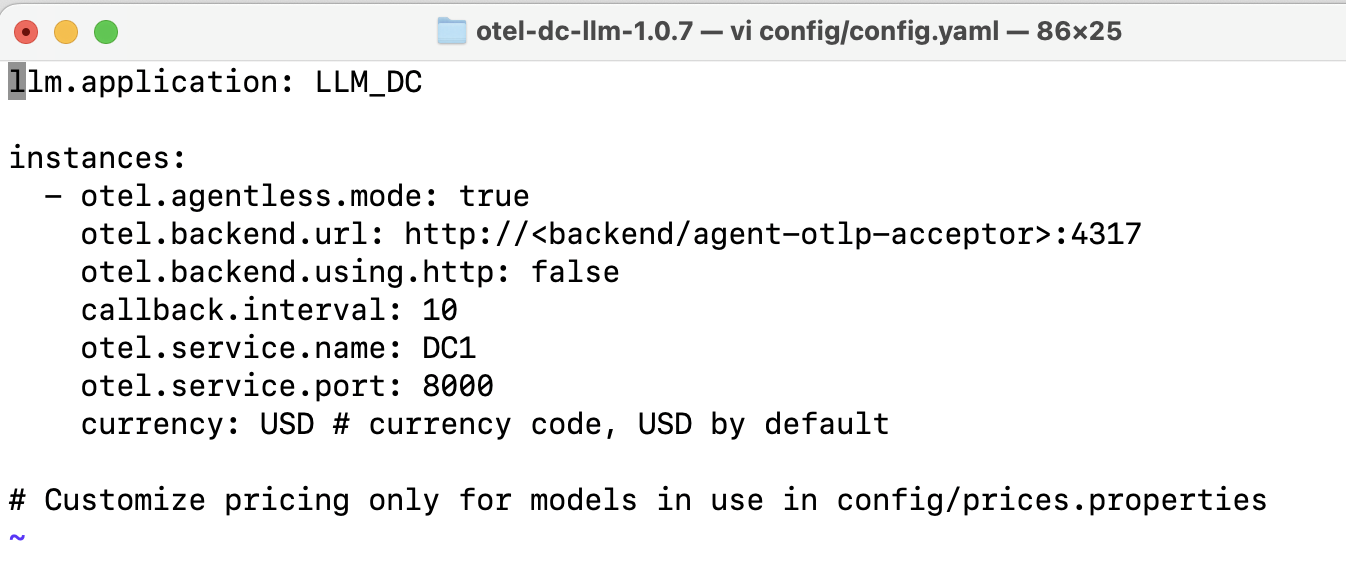
Save and close the file.
Open the
prices.propertiesfile and follow the instructions in the file to add the LLM name along with its input and output token costs to the list used in your LLM application.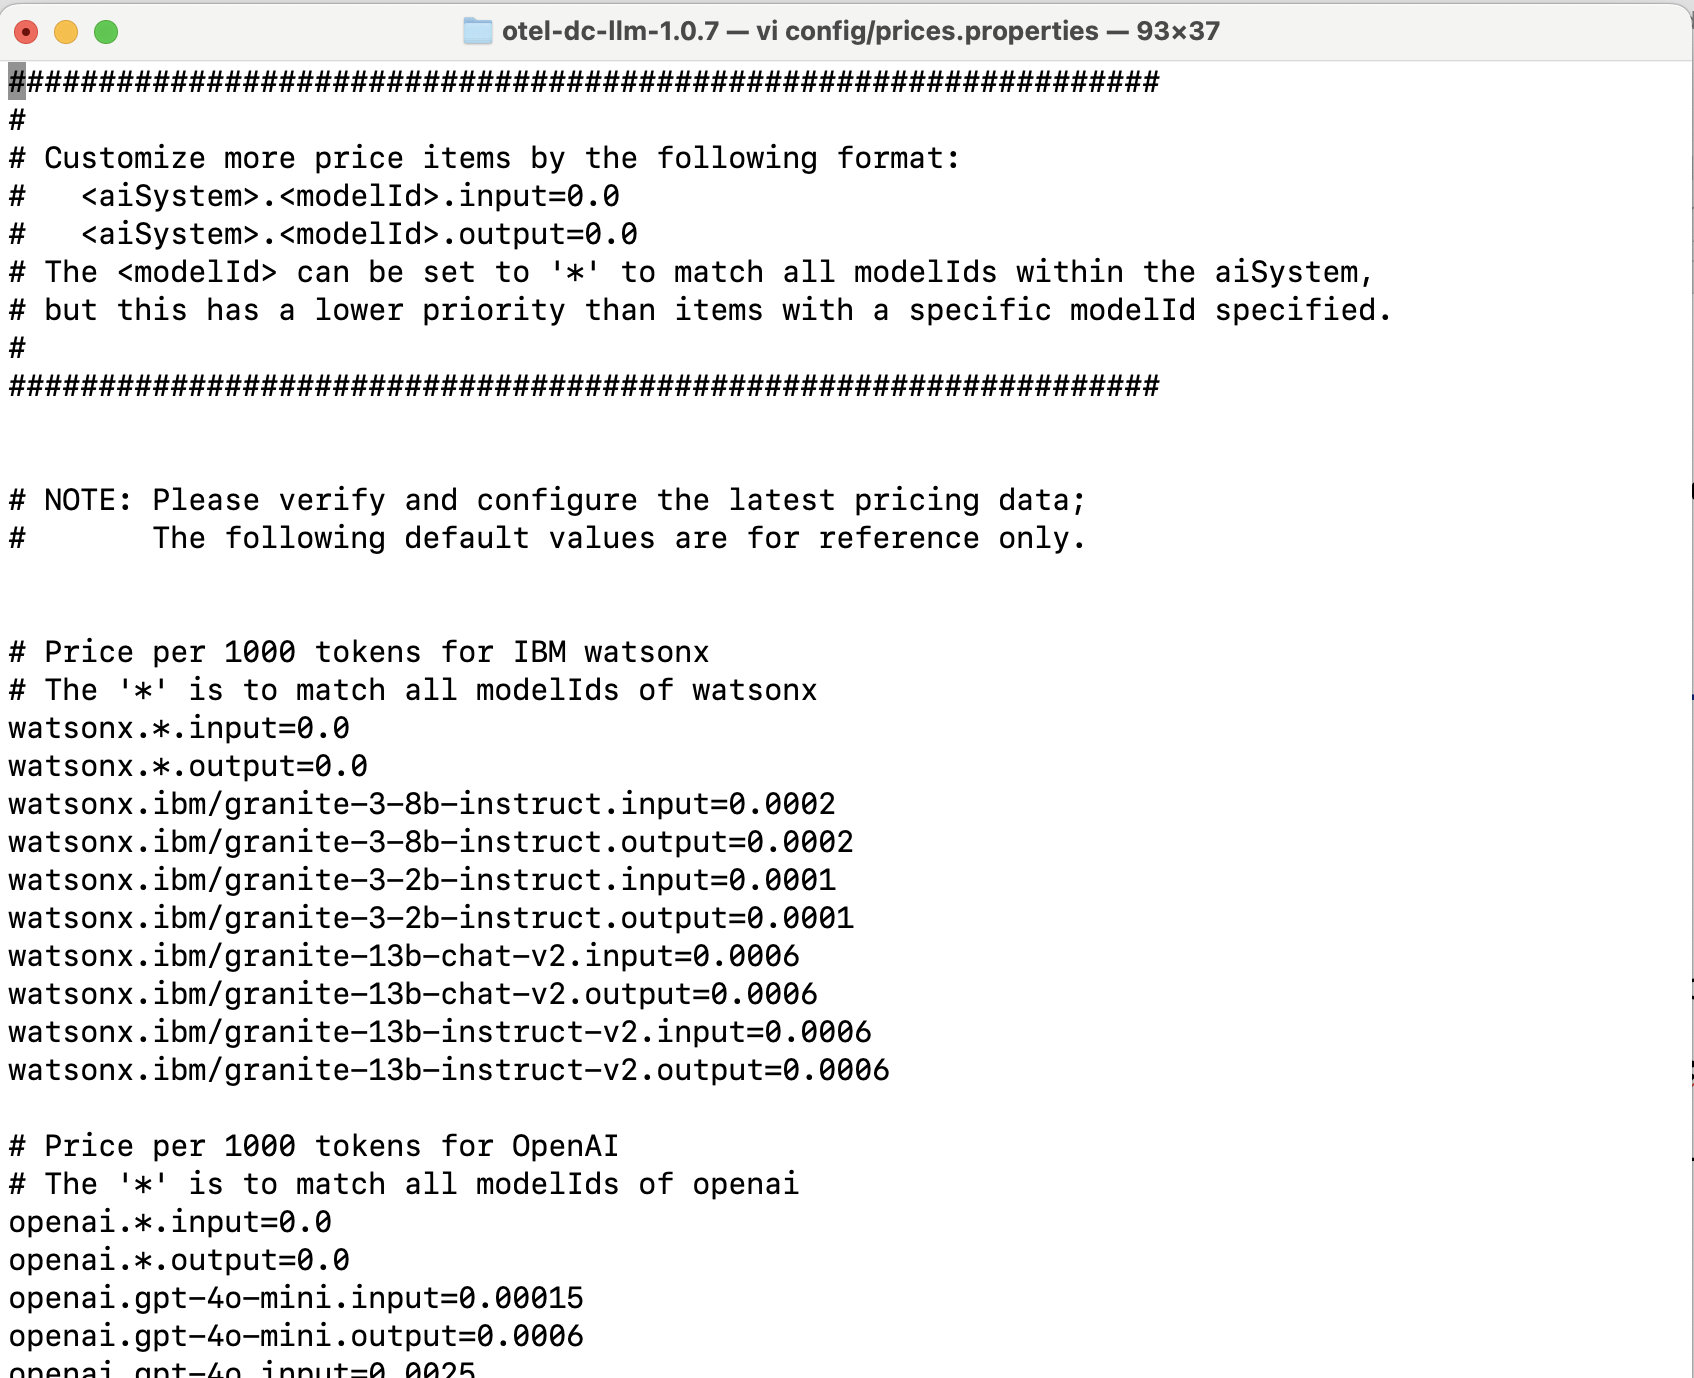
Save and close the file.
Run the following command to run the ODCL and keep it running:
nohup ./bin/otel-dc-llm >/dev/null 2>&1 &Alternatively, you can use either
tmuxorscreento run the ODCL in the backend.
Once your ODCL is running, anyone can send the traces or logs to this ODCL using the public IP of the VM.
Deploying ODCL in IBM Code Engine
The second approach is to set up the ODCL in IBM Code Engine and send the traces and logs to it, which will then be forwarded to otlp-acceptor in the Instana backend.
First, request for a trial instance of IBM Code Engine. While your instance is getting ready, let's create the Dockerfile with the ODCL and required changes that we need to do in the config.yaml and prices.properties files. You can use the following Dockerfile content to start with, and then update the otel.backend.url, otel.service.name, model_name, prices, and the version of ODCL in the Dockerfile. Once done with the required changes, keep the Dockerfile in a GitHub repo.
FROM debian:bullseye-slim

RUN apt-get update && \
    apt-get install -y openjdk-11-jdk wget && \
    apt-get clean

RUN JAVA_PATH=$(dirname $(dirname $(readlink -f $(which java)))) && \
    echo "export JAVA_HOME=$JAVA_PATH" >> /etc/profile.d/java_home.sh && \
    echo "export PATH=\$JAVA_HOME/bin:\$PATH" >> /etc/profile.d/java_home.sh

RUN echo "JAVA_HOME set to $JAVA_HOME" && ls $JAVA_HOME

WORKDIR /app

RUN wget https://github.com/instana/otel-dc/releases/download/v1.0.7/otel-dc-llm-1.0.7.tar

RUN tar xf otel-dc-llm-1.0.7.tar

RUN chmod +x /app/otel-dc-llm-1.0.7

WORKDIR /app/otel-dc-llm-1.0.7/config

RUN sed -i 's|otel.agentless.mode:.*|otel.agentless.mode: true|' config.yaml \
    && sed -i 's|otel.backend.url:.*|otel.backend.url: https://<instana-backend-otlp-acceptor>:4317|' config.yaml \
    && sed -i 's|otel.service.name:.*|otel.service.name: odcl-ce|' config.yaml

RUN sed -i 's|^langchain\.\*\.input=.*|langchain.*.input=0.5|' prices.properties \
    && sed -i 's|^langchain\.\*\.output=.*|langchain.*.output=0.8|' prices.properties

WORKDIR /app

RUN chmod +x /app/otel-dc-llm-1.0.7/bin/otel-dc-llm

EXPOSE 8000

CMD ["/bin/bash", "-c", "cd /app/otel-dc-llm-1.0.7 && ./bin/otel-dc-llm"]
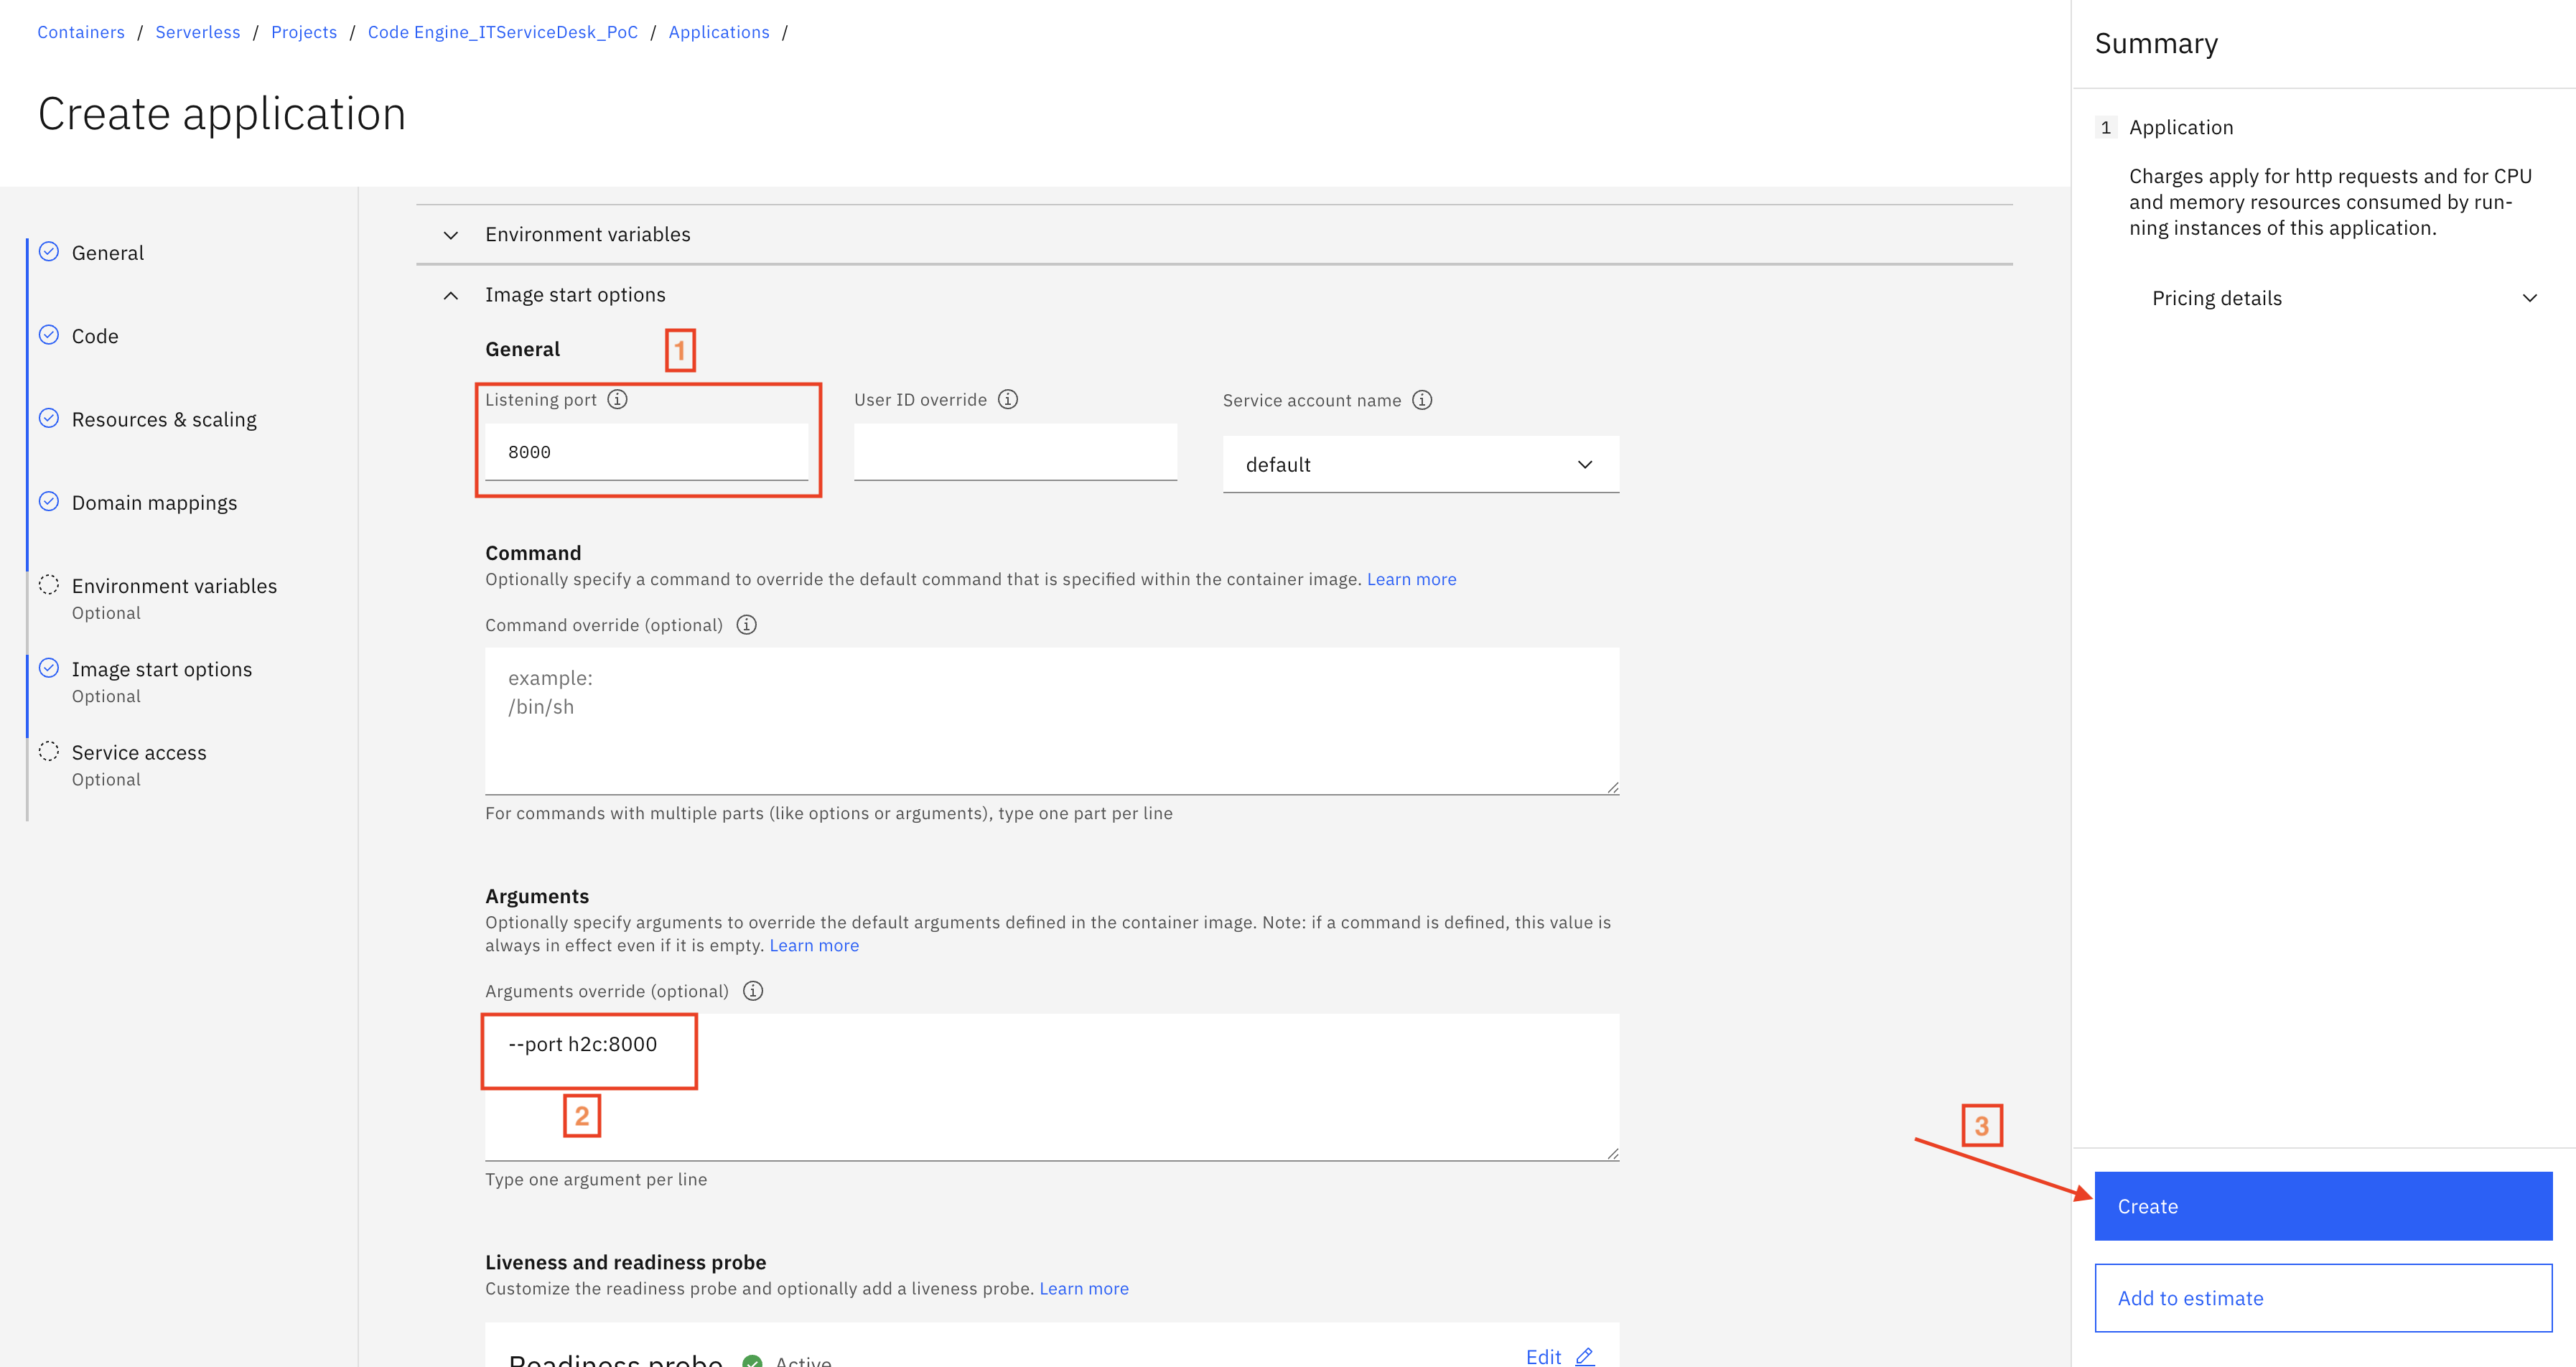
Now, follow the steps in the Code Engine docs to deploy ODCL using the Dockerfile that you stored in GitHub. Be sure to make these changes:
- In Image start options, set the listening port to 8000.
- In Arguments, add the following argument:
--port h2c:8000.
Once you've updated these options, click the Create button to start building the application.
It will take around 2-4 minutes to build the application and another 4-5 minutes to finish the deployment. Once it’s ready, anyone can send the traces or logs to this ODCL using the domain.
Instrumenting the LLM Application
Instrumentation involves adding code to your LLM application to capture detailed insights into its LLM API calls. This process enables the collection of both trace and metric data. Trace data is sent directly to the Instana Agent, while metric data is first sent to the LLM Data Collector (ODCL) for aggregation before being forwarded to the agent.
Verify that Python 3.10+ is installed in your machine. If not installed, download and install it from the Python site or install it using terminal.
(Optional) It is recommended to create a virtual environment for your applications. This helps keep your dependencies organized and prevents conflicts with other applications. To create a virtual environment, run these commands
python3 -m venv venv # to create a virtual environment named as venv. source venv/bin/activate # to activate the virtual environment.Install the required libraries using this command:
pip install traceloop-sdk==0.38.7 ibm-watsonx-ai==1.0.5 ibm-watson-machine-learning==1.0.357 langchain-ibm==0.1.7 langchain==0.2.2 langchain-community==0.2.3 langchain-core==0.2.4 langchain-text-splitters==0.2.1In your LLM app, initialize the Traceloop tracer:
from traceloop.sdk import Traceloop Traceloop.init()If your application involves complex workflows or chains, you can annotate them to gain clearer visibility into their execution. By doing so, you’ll be able to view the full trace of your workflow in Traceloop or any compatible observability dashboard. To simplify this process, you can use decorators such as
@workflowfor synchronous functions or@aworkflowfor asynchronous ones around functions that render prompts and invoke LLMs. For example:from traceloop.sdk.decorators import workflow @workflow(name="suggest_answers") def suggest_answers(question: str):
To quickly verify the instrumentation, you can use the following code to generate a sample application named sample_app.py.
import os, types, time, random
from ibm_watsonx_ai.metanames import GenTextParamsMetaNames
from ibm_watsonx_ai.foundation_models import ModelInference
from pprint import pprint
from traceloop.sdk import Traceloop
from traceloop.sdk.decorators import workflow
from langchain_ibm import WatsonxLLM
from dotenv import load_dotenv
load_dotenv()

Traceloop.init(app_name="watsonx_llm_langchain_question",disable_batch=True)

def watsonx_llm_init() -> ModelInference:
    """
    Initialize the WatsonxLLM model with predefined parameters.

    Returns:
        ModelInference: An instance of the WatsonxLLM model configured with specified parameters.
    """
    watsonx_llm_parameters = {
        GenTextParamsMetaNames.DECODING_METHOD: "sample",
        GenTextParamsMetaNames.MAX_NEW_TOKENS: 100,
        GenTextParamsMetaNames.MIN_NEW_TOKENS: 1,
        GenTextParamsMetaNames.TEMPERATURE: 0.5,
        GenTextParamsMetaNames.top_K: 50,
        GenTextParamsMetaNames.top_P: 1,
    }
    # Randomly select a model from available IBM Watsonx models
    models = ['meta-llama/llama-3-3-70b-instruct', 'ibm/granite-13b-instruct-v2']
    model = random.choice(models)

    # Initialize WatsonxLLM with API credentials and model parameters
    watsonx_llm = WatsonxLLM(
        model_id=model,
        url=os.getenv("WATSONX_URL"),
        apikey=os.getenv("API_KEY"),
        project_id=os.getenv("PROJECT_ID"),
        params=watsonx_llm_parameters,
    )
    return watsonx_llm

@workflow(name="watsonx_llm_langchain_question")
def watsonx_llm_generate(question):
    """
    Generate a response from the WatsonxLLM model based on the given question.

    Args:
        question (str): The input query for the model.

    Returns:
        str: The model-generated response.
    """
    watsonx_llm = watsonx_llm_init()
    return watsonx_llm.invoke(question)

# Generate responses for a set of predefined questions
for i in range(10):
    question_multiple_responses = [ "What is AIOps?", "What is Gitops?"]
    question = random.choice(question_multiple_responses)
    response = watsonx_llm_generate(question)
    # Handle generator response type if applicable
    if isinstance(response, types.GeneratorType):
         for chunk in response:
             print(chunk, end='')
    pprint(response)
    time.sleep(2)
Running the application and sending metrics and traces
With everything set up, we’re now ready to launch the full observability stack. We’ll start by running the OpenTelemetry Data Collector (ODCL), followed by our sample LLM application. Once everything is running, we’ll head over to the IBM Instana UI to explore the collected traces and metrics, giving us real-time insights into the application's behavior and performance.
Export the credentials for the sample watsonx application
You need an IBM Cloud account to create a watsonx.ai project and get an API key. (Read more about managing API keys in the IBM Cloud docs.)
To enable access to the LLMs in the sample watsonx application, export your watsonx credentials.
export WATSONX_URL="<watsonx-url>"
export PROJECT_ID="<watsonx-project-id>"
export API_KEY="<watsonx-api-key>"
Export the credentials for the sample OpenAI application
To create an API key to access the OpenAI API or use the existing one, log in to OpenAI and go to OpenAI.
To enable access to the LLMs in the sample OpenAI application, export your OpenAI credentials.
export OPENAI_API_KEY=<openai-api-key>
Running the app in a VM
Export the following credentials in the terminal from where you are going to run the sample app. Or, you can keep the credentials in an .env file within same directory as the sample app.
export TRACELOOP_BASE_URL=<instana-endpoint-without-http>:4317
export TRACELOOP_HEADERS="x-instana-key=<agent-key>"
export TRACELOOP_LOGGING_ENABLED=true
export TRACELOOP_LOGGING_ENDPOINT=$TRACELOOP_BASE_URL
export TRACELOOP_METRICS_ENABLED=true
export OTEL_METRIC_EXPORT_INTERVAL=10000
export OTEL_EXPORTER_OTLP_INSECURE=false

export TRACELOOP_METRICS_ENDPOINT = <ipv4>:8000 # VM Machine's public IP
export OTEL_EXPORTER_OTLP_METRICS_INSECURE=true
Now, run your application using command:
python3 sample_app.py
Running the app in Code Engine
Export the following credentials in the terminal from where you are going to run the sample app. Or, you can keep the credentials in an .env file within same directory as the sample app.
export TRACELOOP_BASE_URL=<instana-endpoint-without-http>:4317
export TRACELOOP_HEADERS="x-instana-key=<agent-key>"
export TRACELOOP_LOGGING_ENABLED=true
export TRACELOOP_LOGGING_ENDPOINT=$TRACELOOP_BASE_URL
export TRACELOOP_METRICS_ENABLED=true
export OTEL_METRIC_EXPORT_INTERVAL=10000
export OTEL_EXPORTER_OTLP_INSECURE=false

export TRACELOOP_METRICS_ENDPOINT=<ce_link_without_https>:443
export OTEL_EXPORTER_OTLP_METRICS_INSECURE=false
Now, run your application using command:
python3 sample_app.py
View the collected traces and metrics
Once ODCL and the Instana Agent is running, and once your LLM application is instrumented and running, you can view the collected metrics directly in the Instana UI. To access the LLM observability dashboard:
- Open the Instana UI, and navigate to Infrastructure.
- Click Analyze Infrastructure.
- From the list of entity types, select OTEL LLMonitor.
Choose the relevant OTEL LLMonitor instance to open its dashboard.
In the case of a VM deployment, it should be something like
LLM:<service_name_in_config>@<some_random_int_char_string>In the case of a Code Engine deployment, it should be something like
LLM:<service_name_in_dockerfile>@<ce_deployed_instance_name>
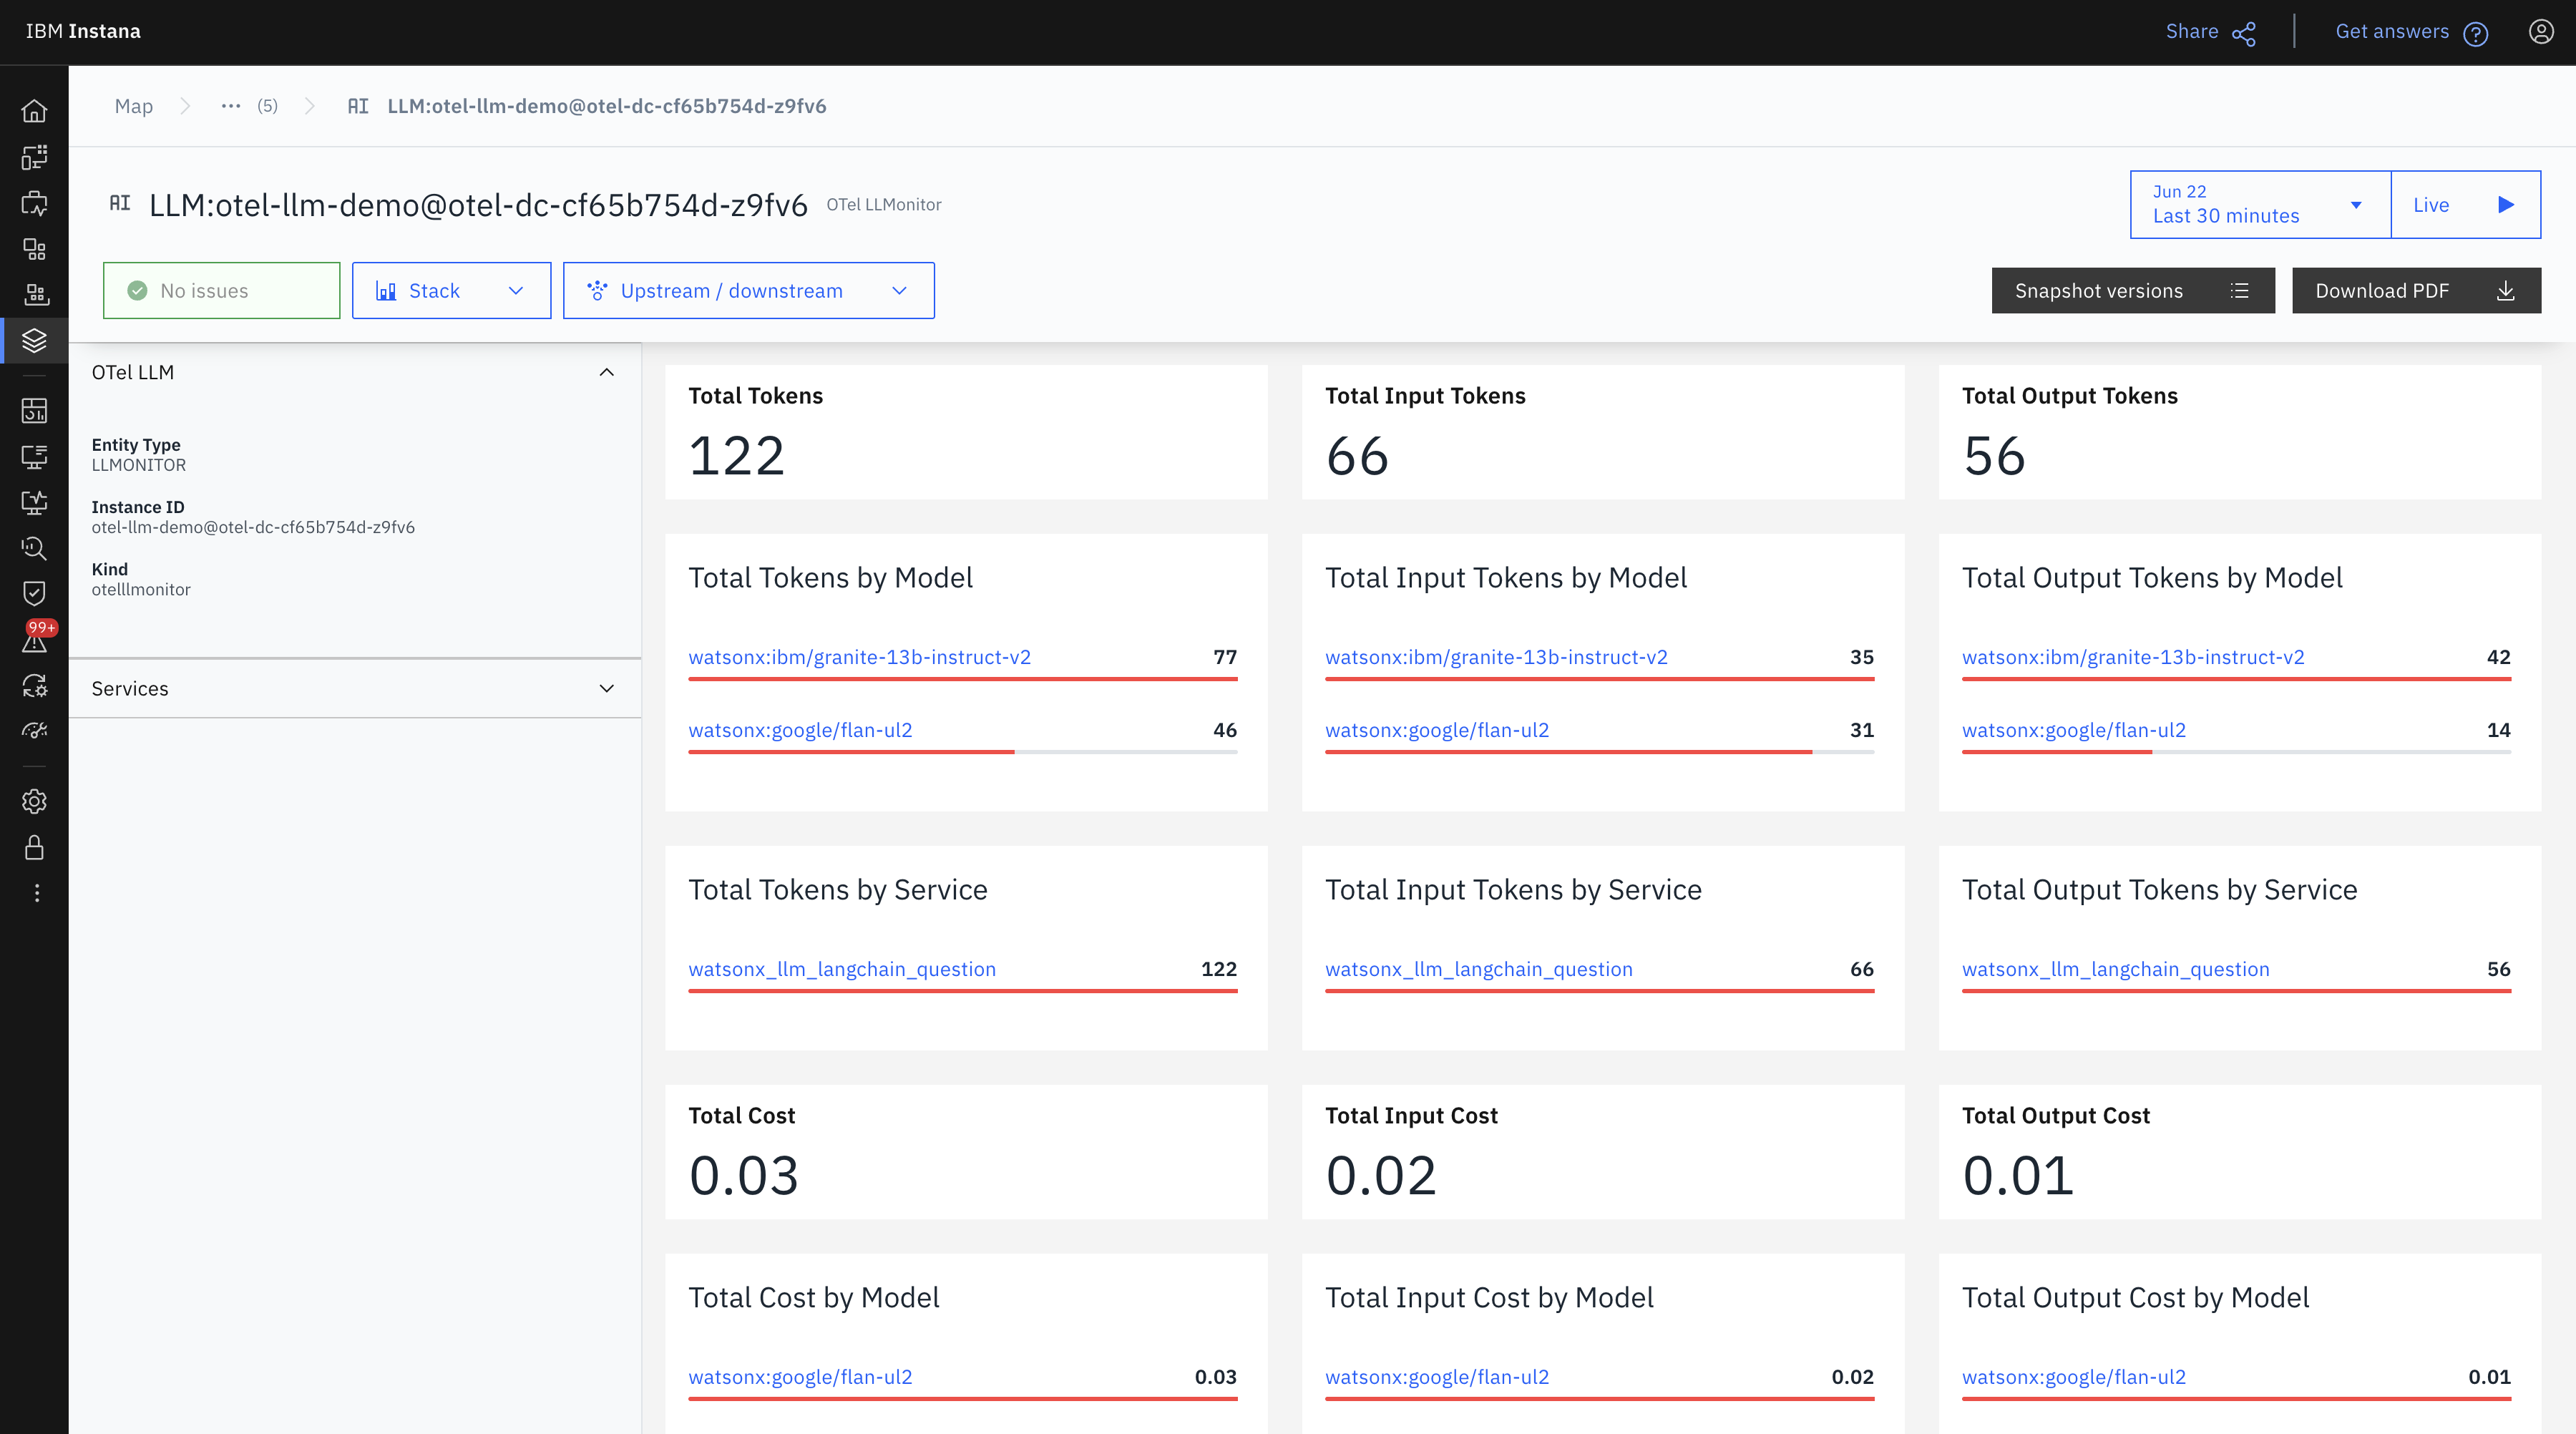
Here, you’ll find key LLM observability metrics, including: Total Tokens, Total Cost, Total Requests, Average Latency, and many more. These metrics provide valuable insights into your LLM application's performance and usage. See below images for reference.
For more information about viewing traces, see the Analyze Calls and Traces docs page.
The following view is a snapshot-driven walkthrough of our demo monitoring dashboard.
This view summarizes the total tokens processed:
- 122 tokens overall (66 input, 56 output)
- The top-used models were
granite-13b-instruct-v2andflan-ul2. - Most of the cost ($0.03) was attributed to
flan-ul2, despitegranitehaving higher output.
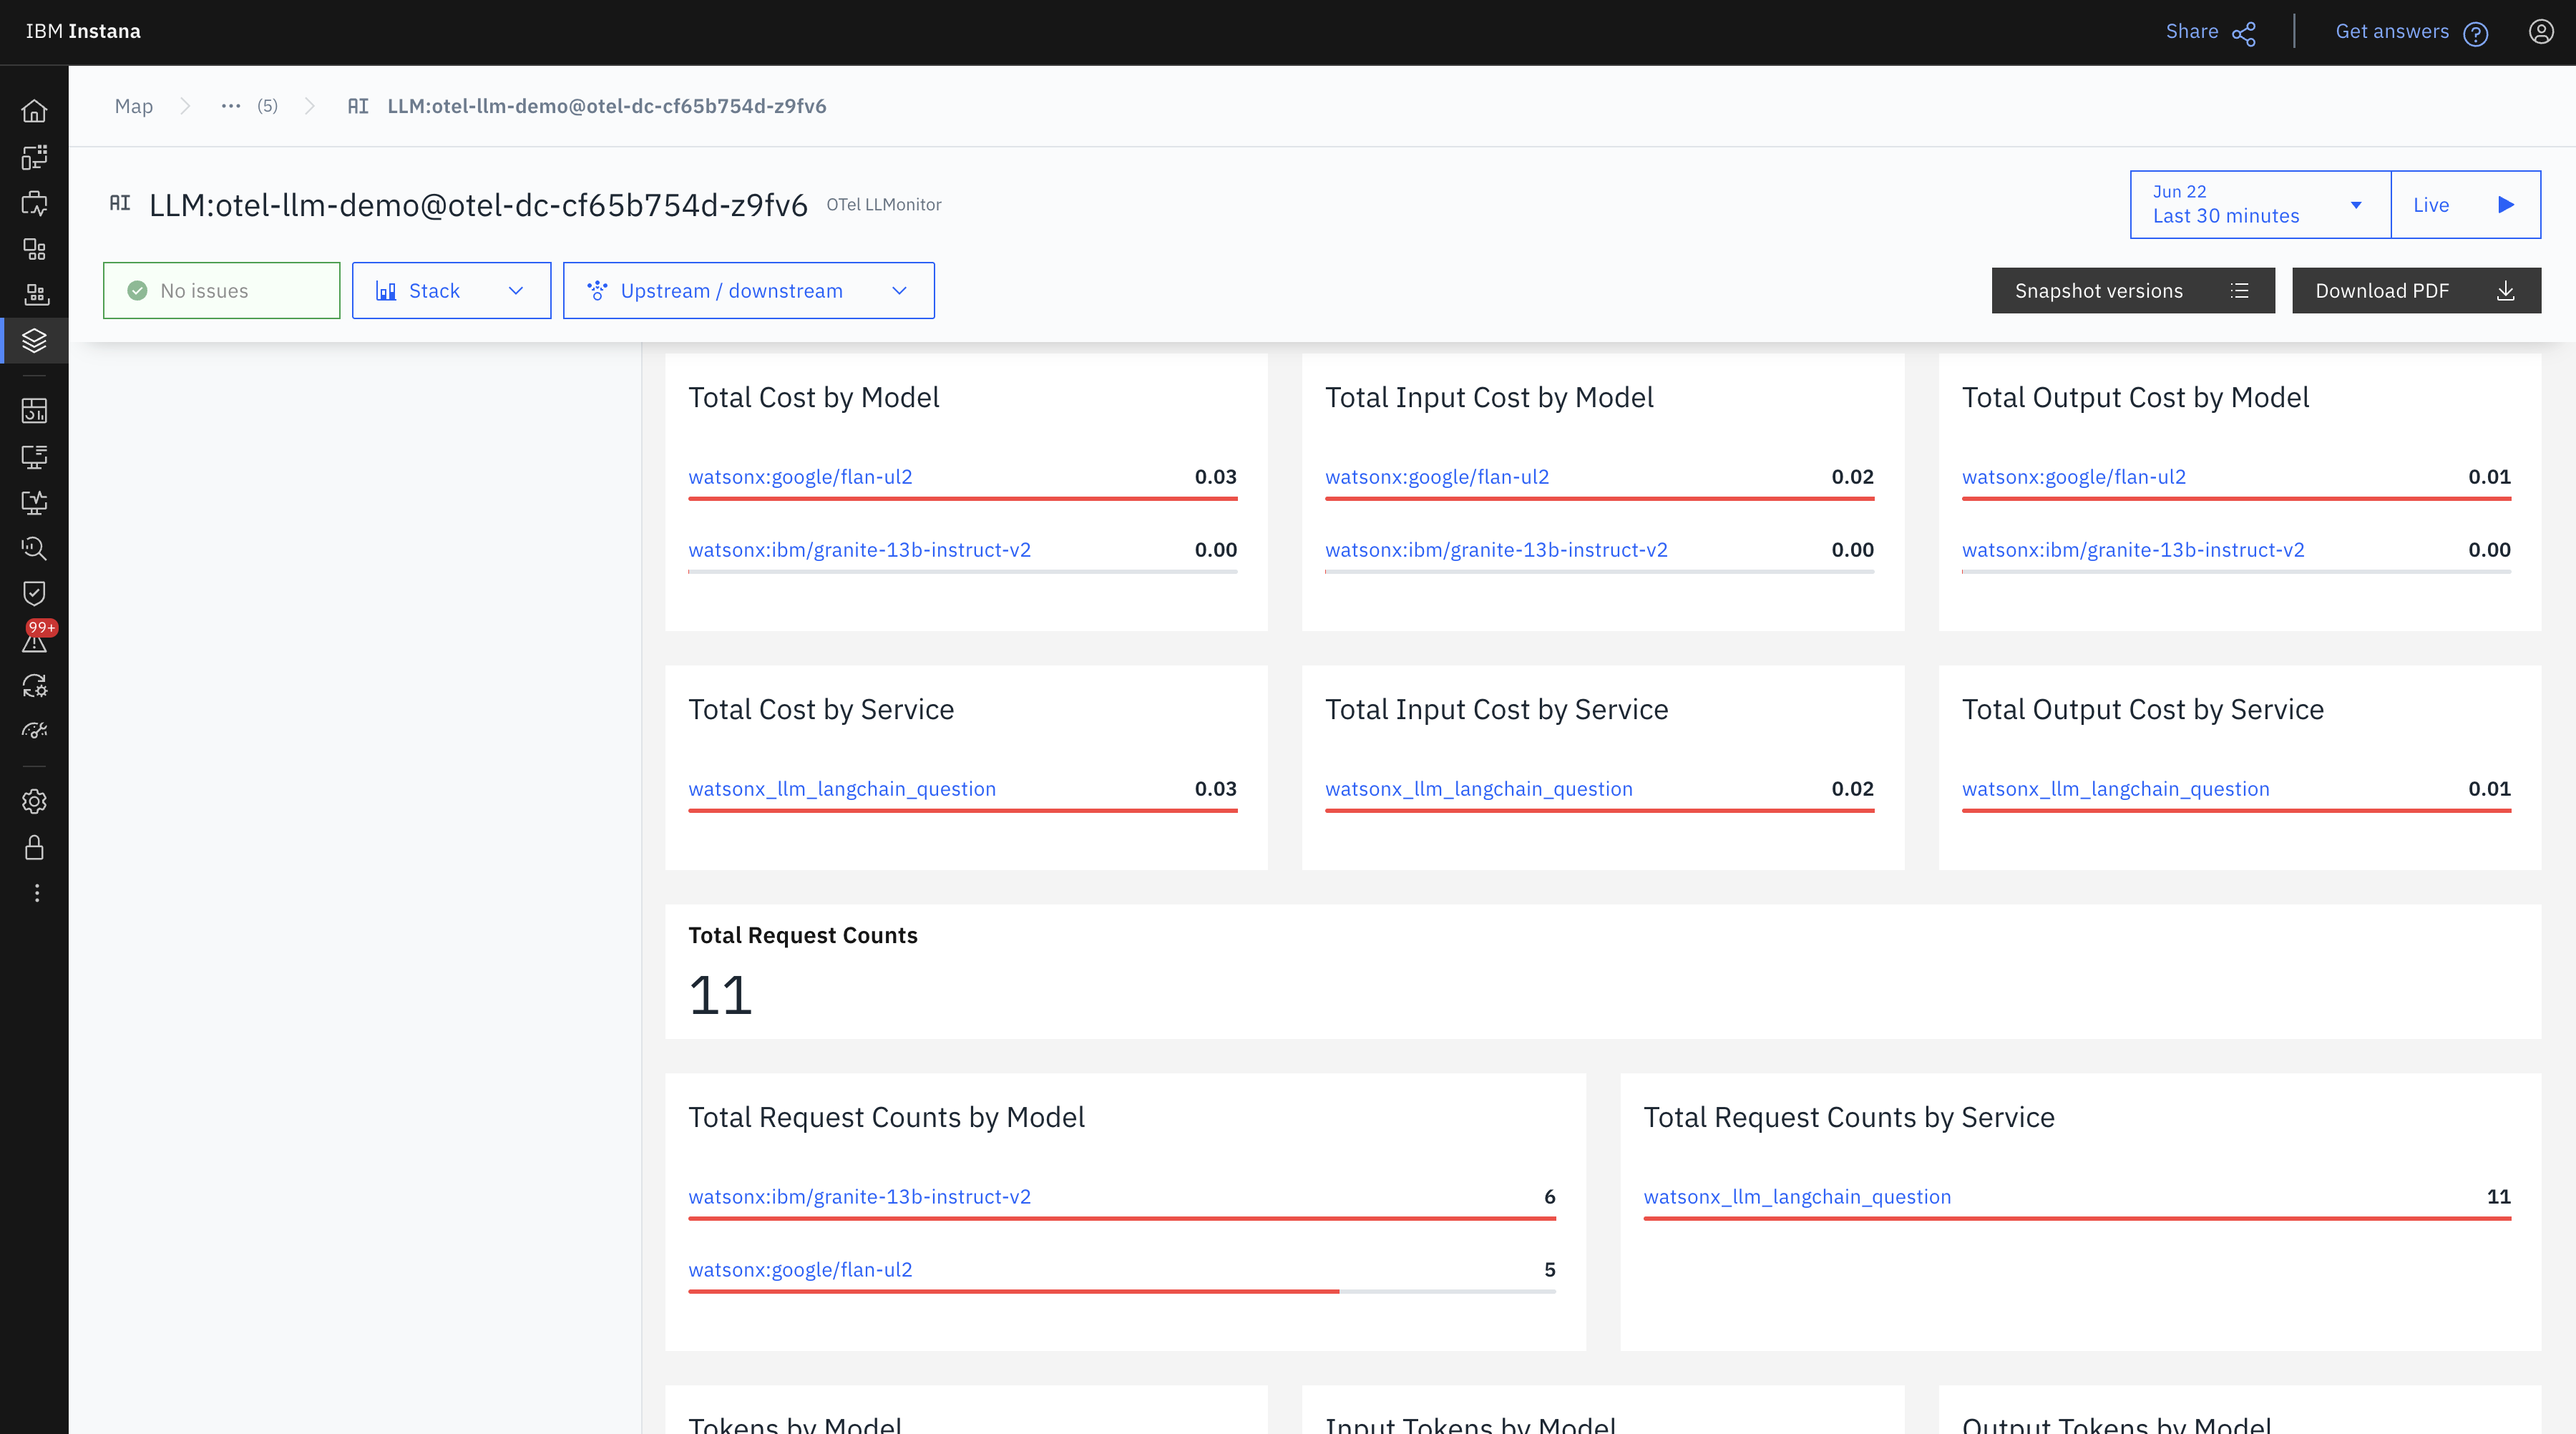
The following view shows a clear cost distribution by model and service.
- All 11 requests came through the service
watsonx_llm_langchain_question. - Granite had 6 requests, Flan had 5—yet Flan generated all the cost.
- This hints at possible differences in pricing or token usage efficiency.
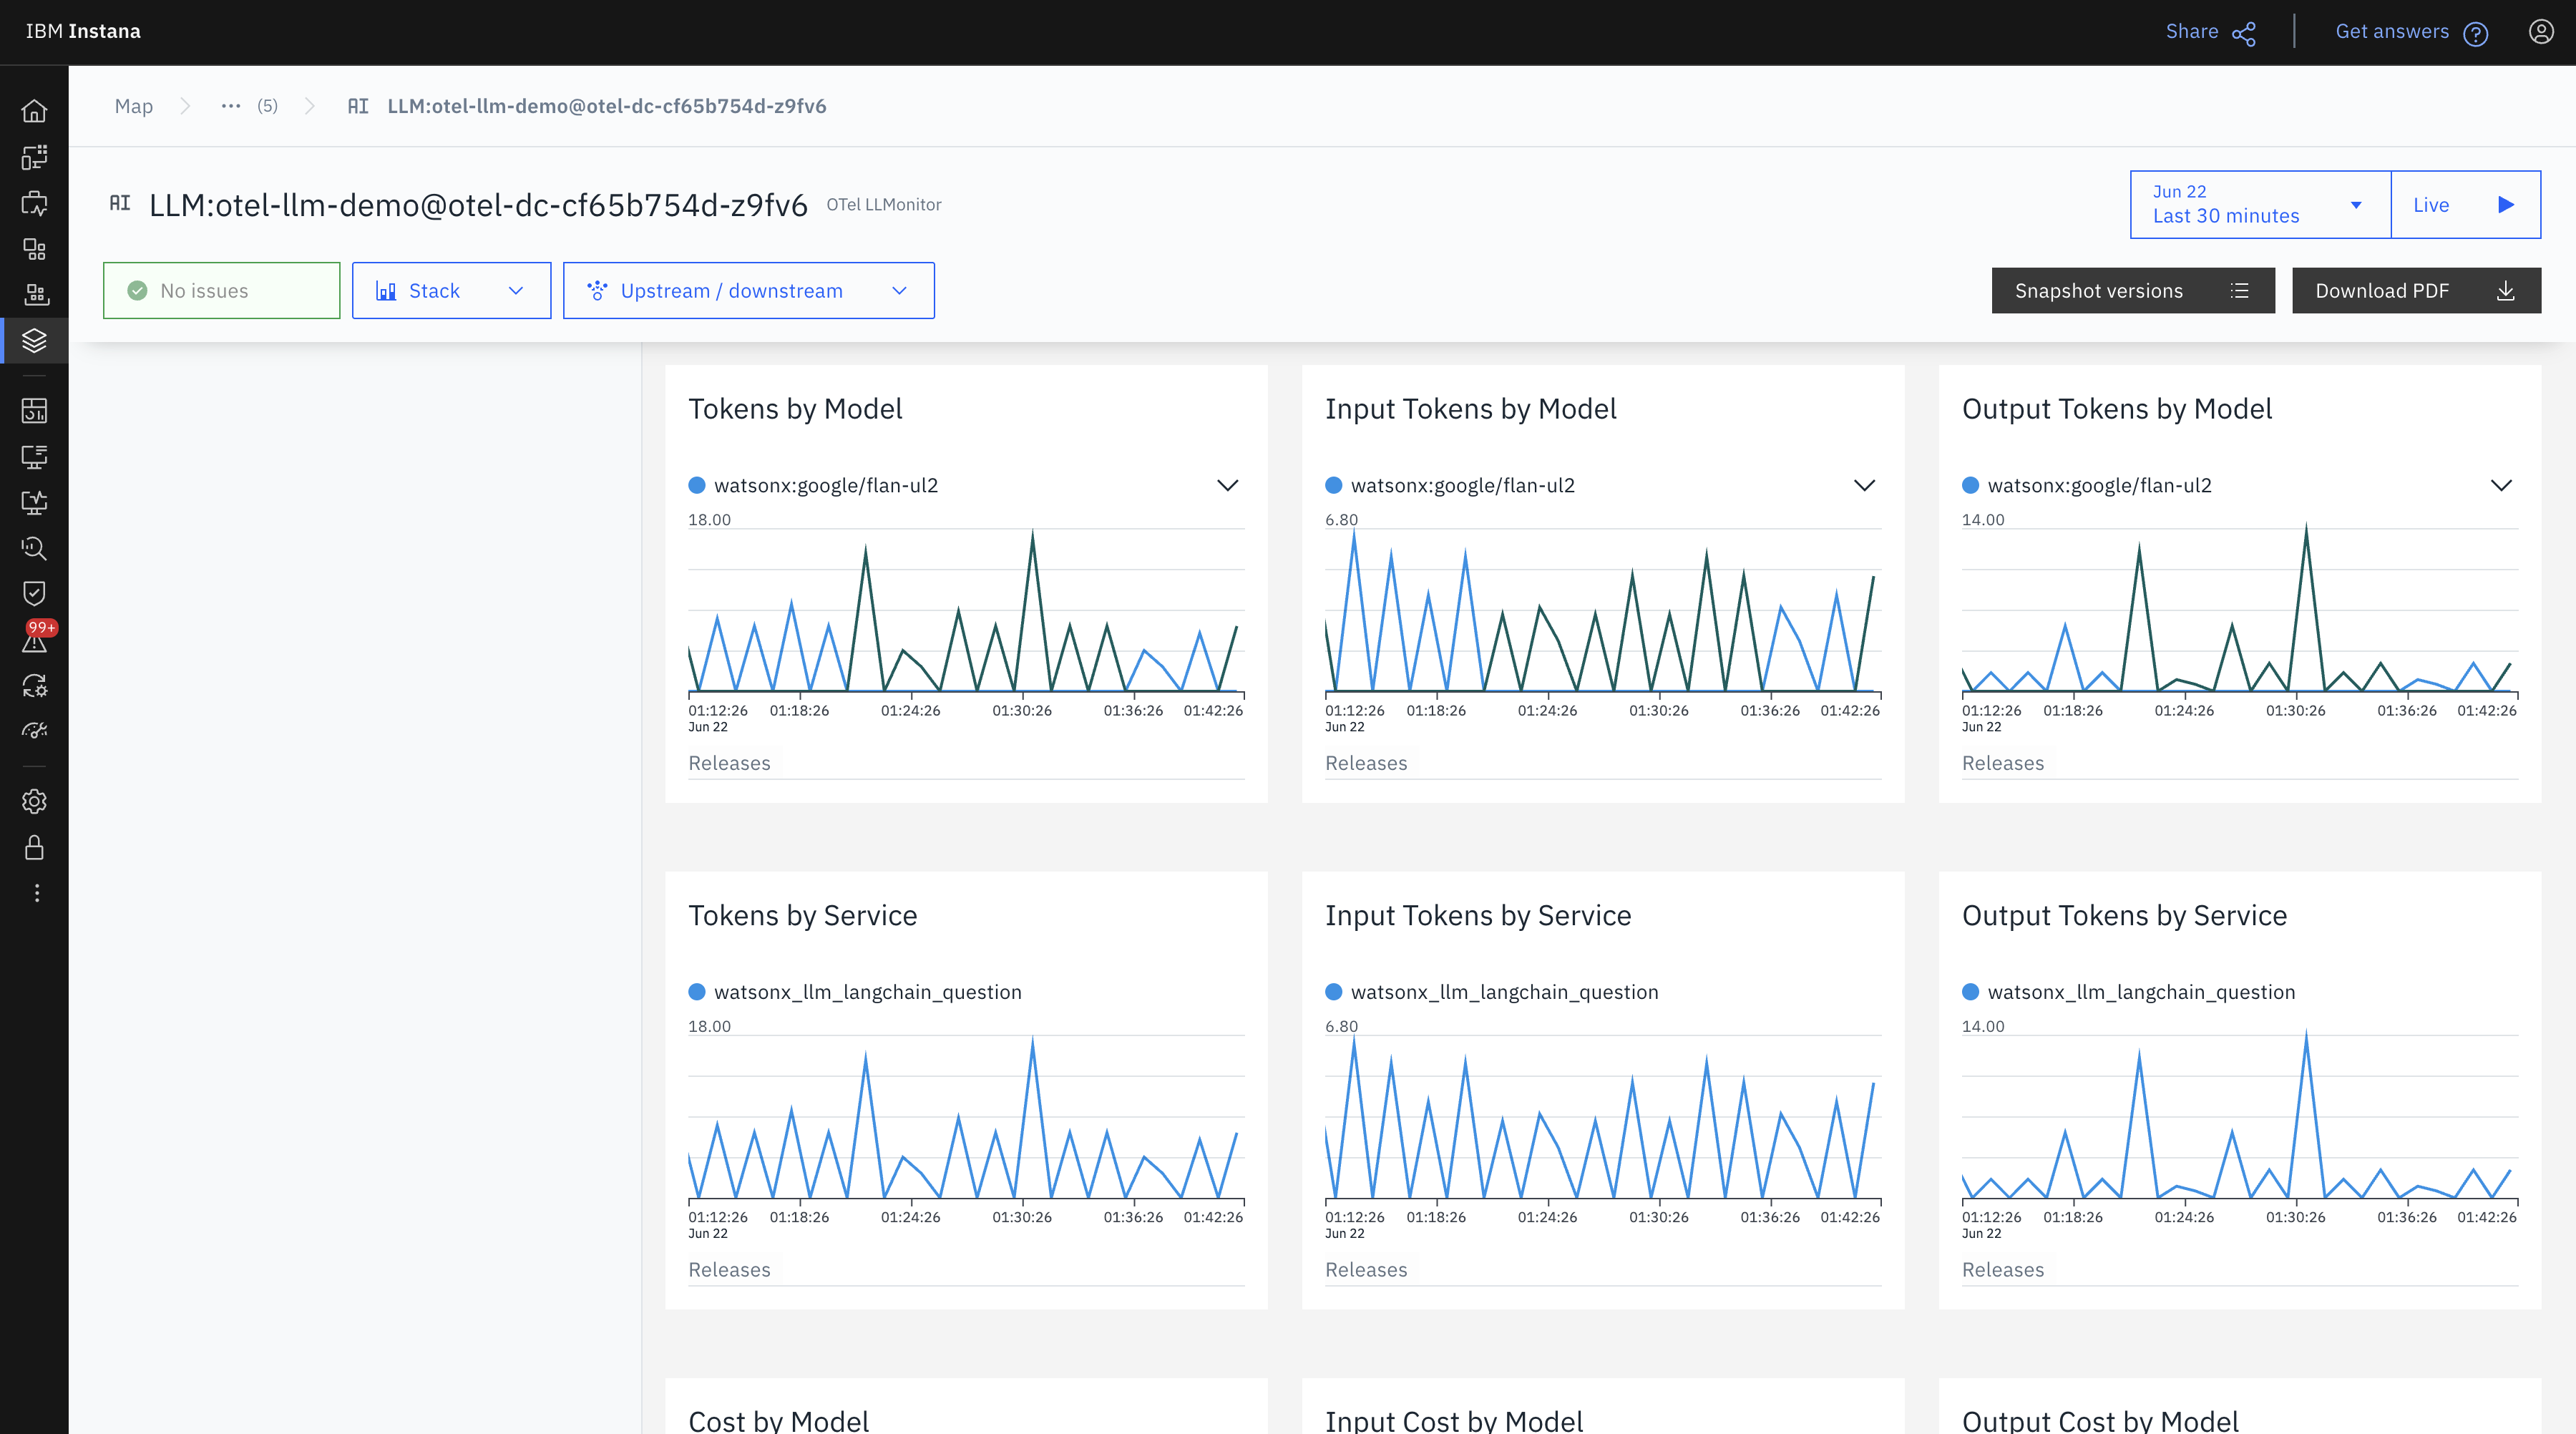
This time-series graph shows token usage per model and service across a 30-minute window.
- Token spikes correlate with request activity.
- Flan’s usage appears more frequent but with smaller token batches per call.
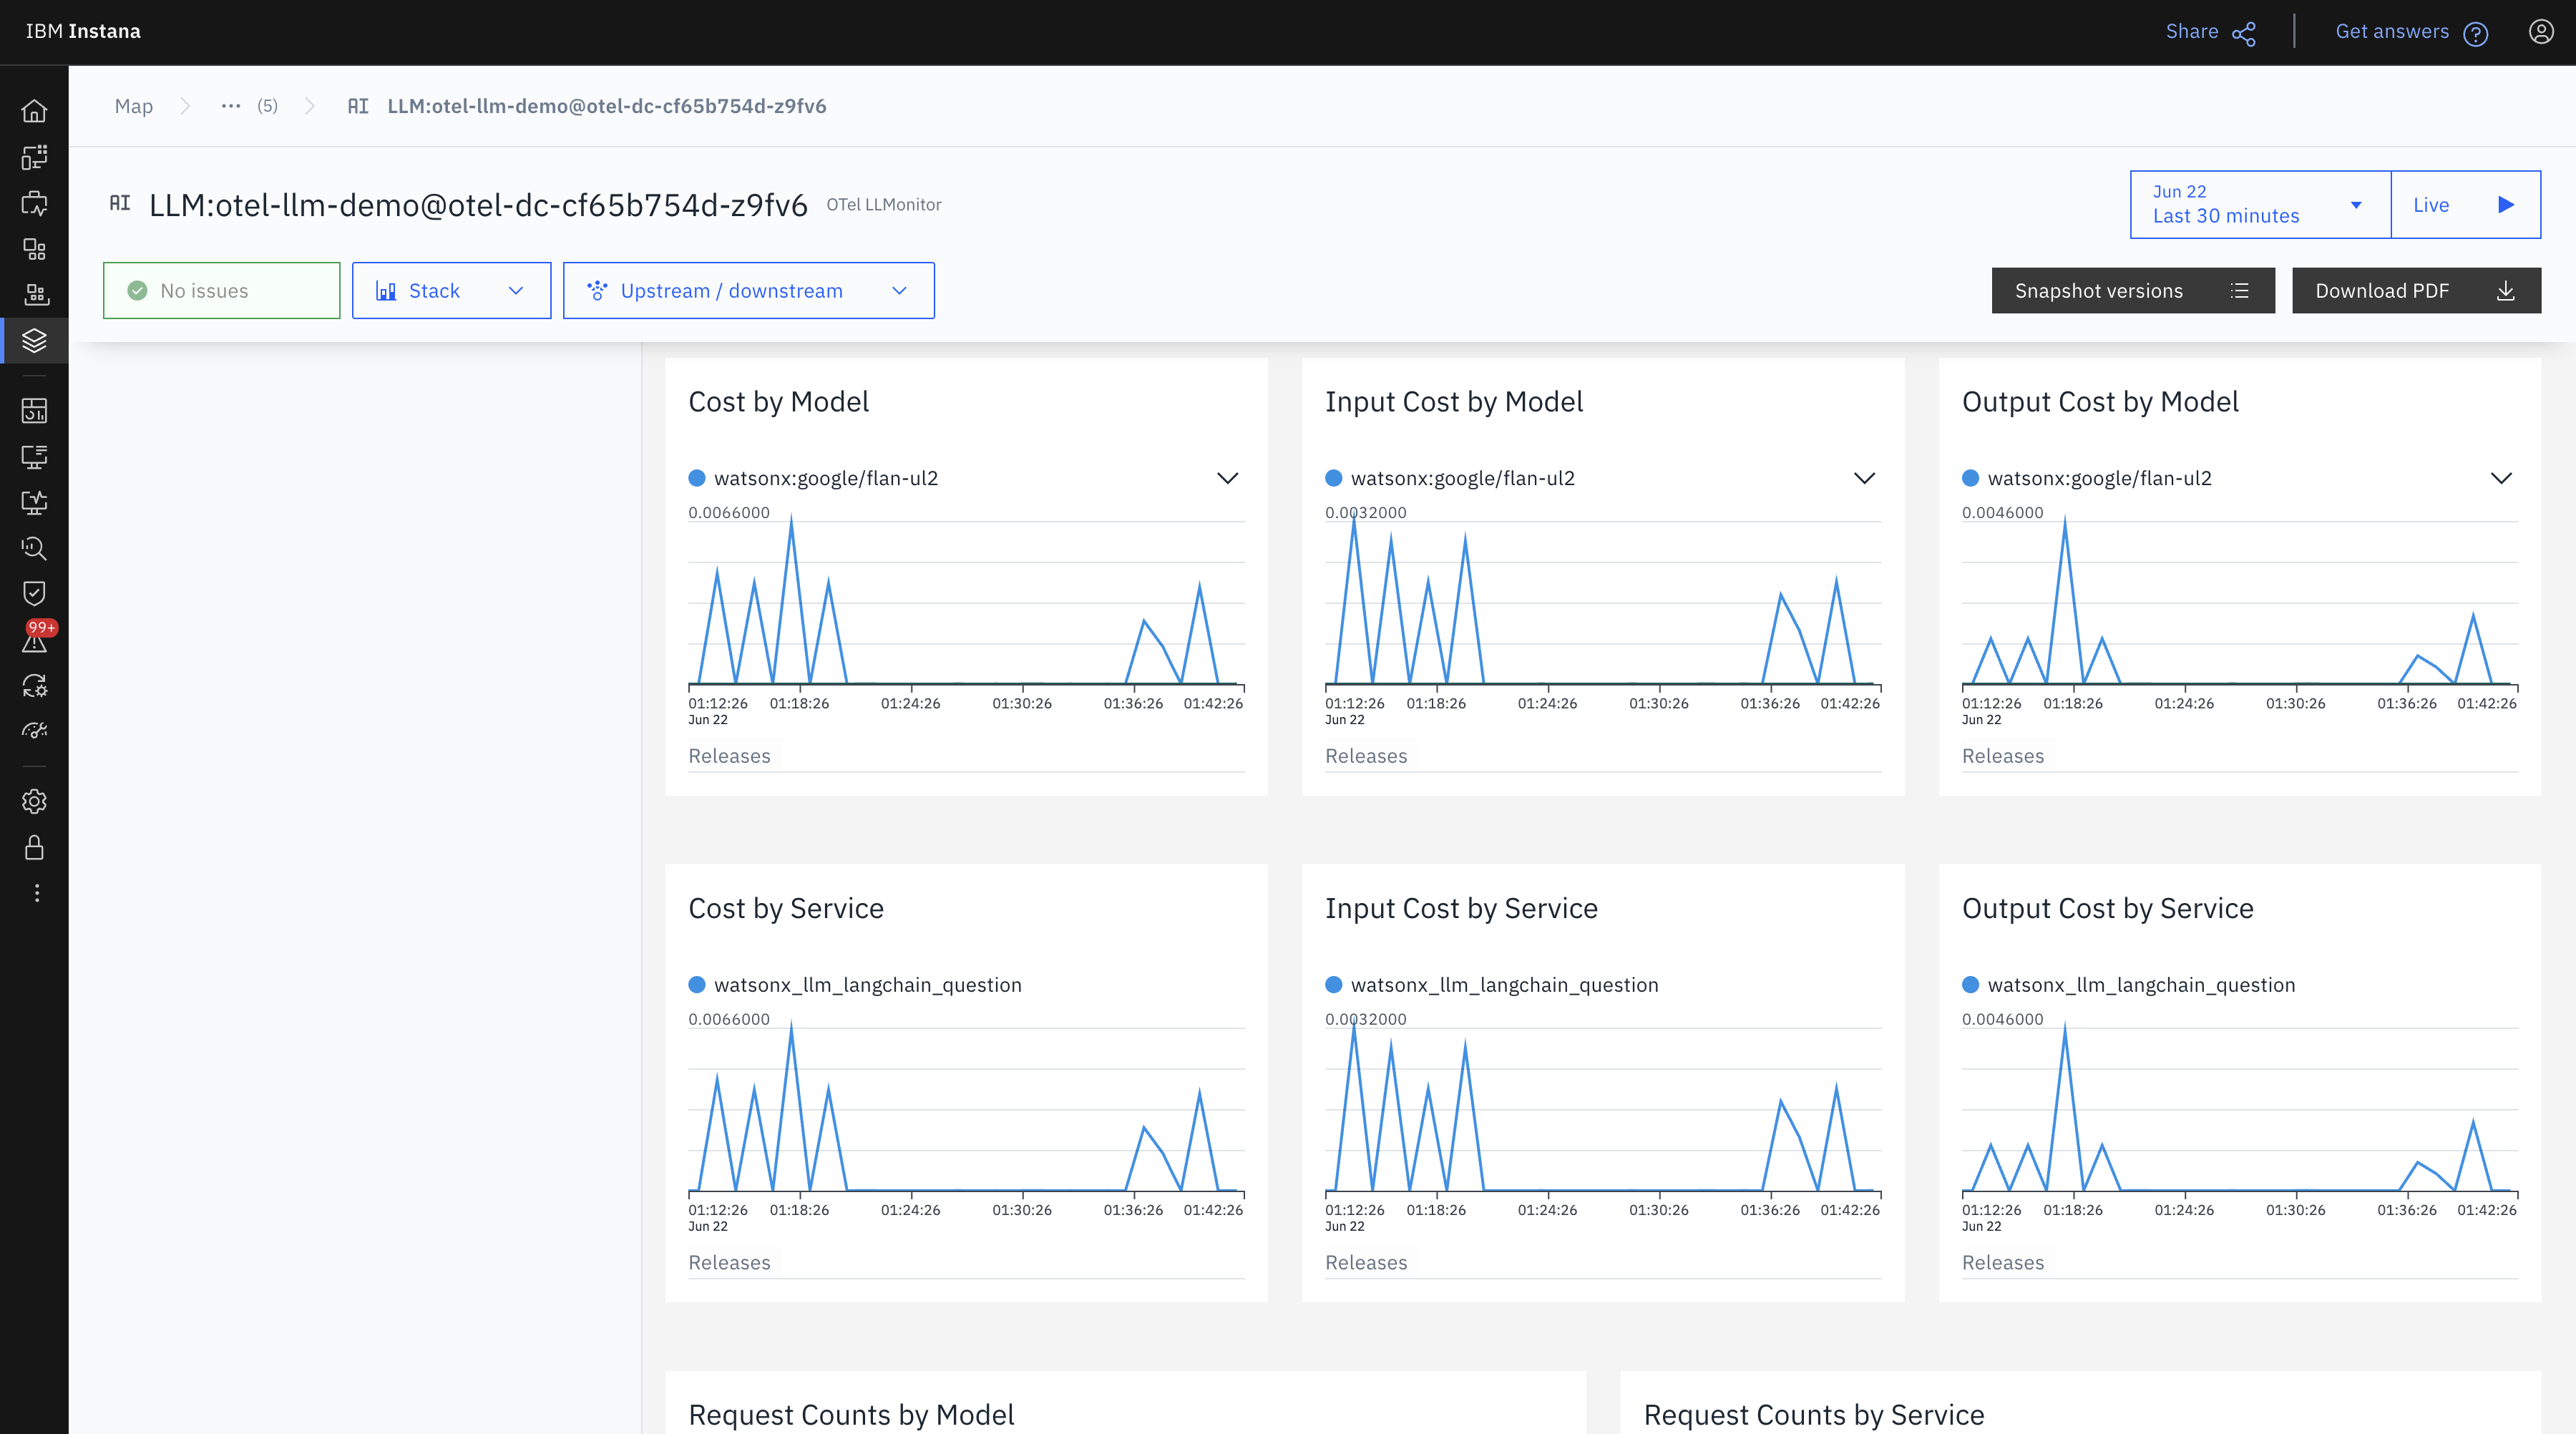
In the following view, you can see fluctuations in cost across time intervals.
- Input and output costs mirror the token patterns seen earlier.
- Granular tracking like this helps understand high-cost periods and optimize prompts accordingly.
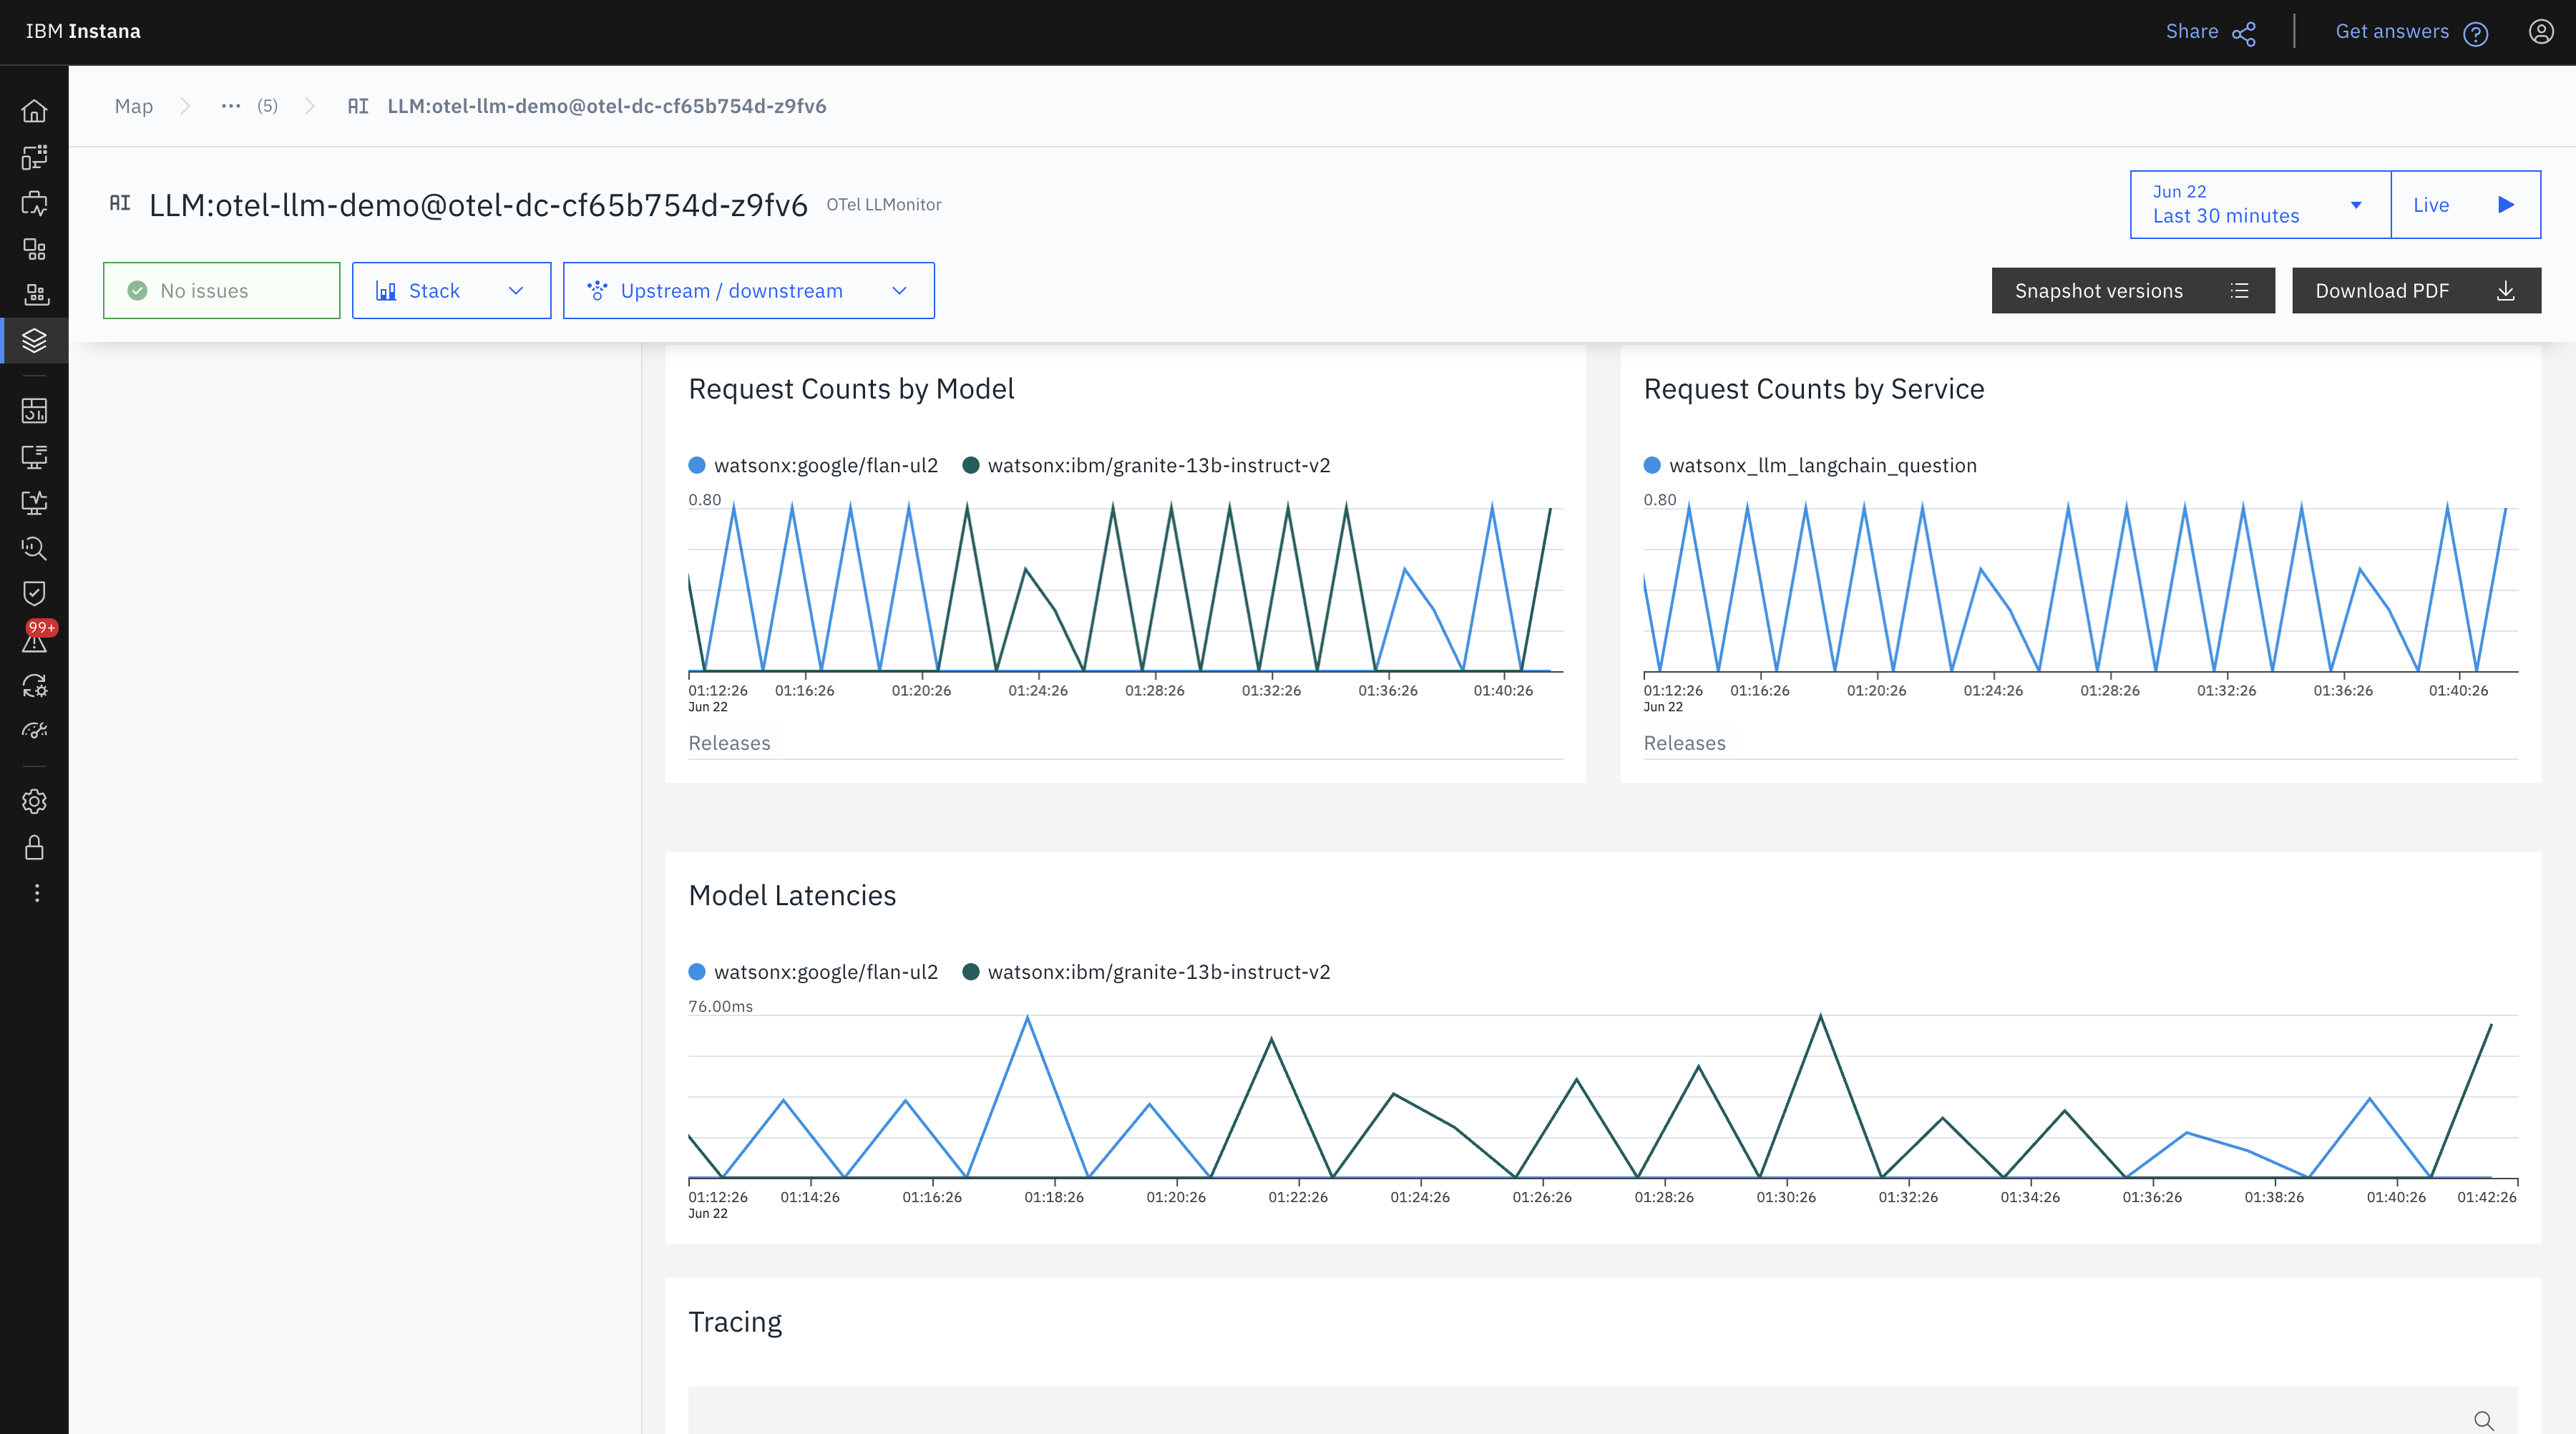
Lastly, in this view, you see the request frequency and model latencies.
- Flan and Granite both maintained steady throughput.
- Latency varied slightly, with Flan showing slightly higher spikes at times, possibly due to concurrent loads.
Conclusion
By adopting the cloud-native, agentless ODCL deployment with IBM Instana, you gain a scalable, low-maintenance observability pipeline purpose-built for LLM workloads. This architecture removes the need for local agents, making it easier to monitor distributed applications across teams, regions, and environments. It centralizes LLM-specific telemetry, such as token usage, latency, and cost, while still providing real-time, high-fidelity insights. The result is faster troubleshooting, more informed cost optimization, and a flexible setup that adapts to modern, containerized, and serverless deployments without sacrificing depth or accuracy in monitoring.