

OpenTelemetry-native application performance monitoring
Auto-instrument your applications, visualize and correlate dependencies, and quickly pinpoint root causes — right down to the code.
Guided Demo
100% visibility, zero downtime
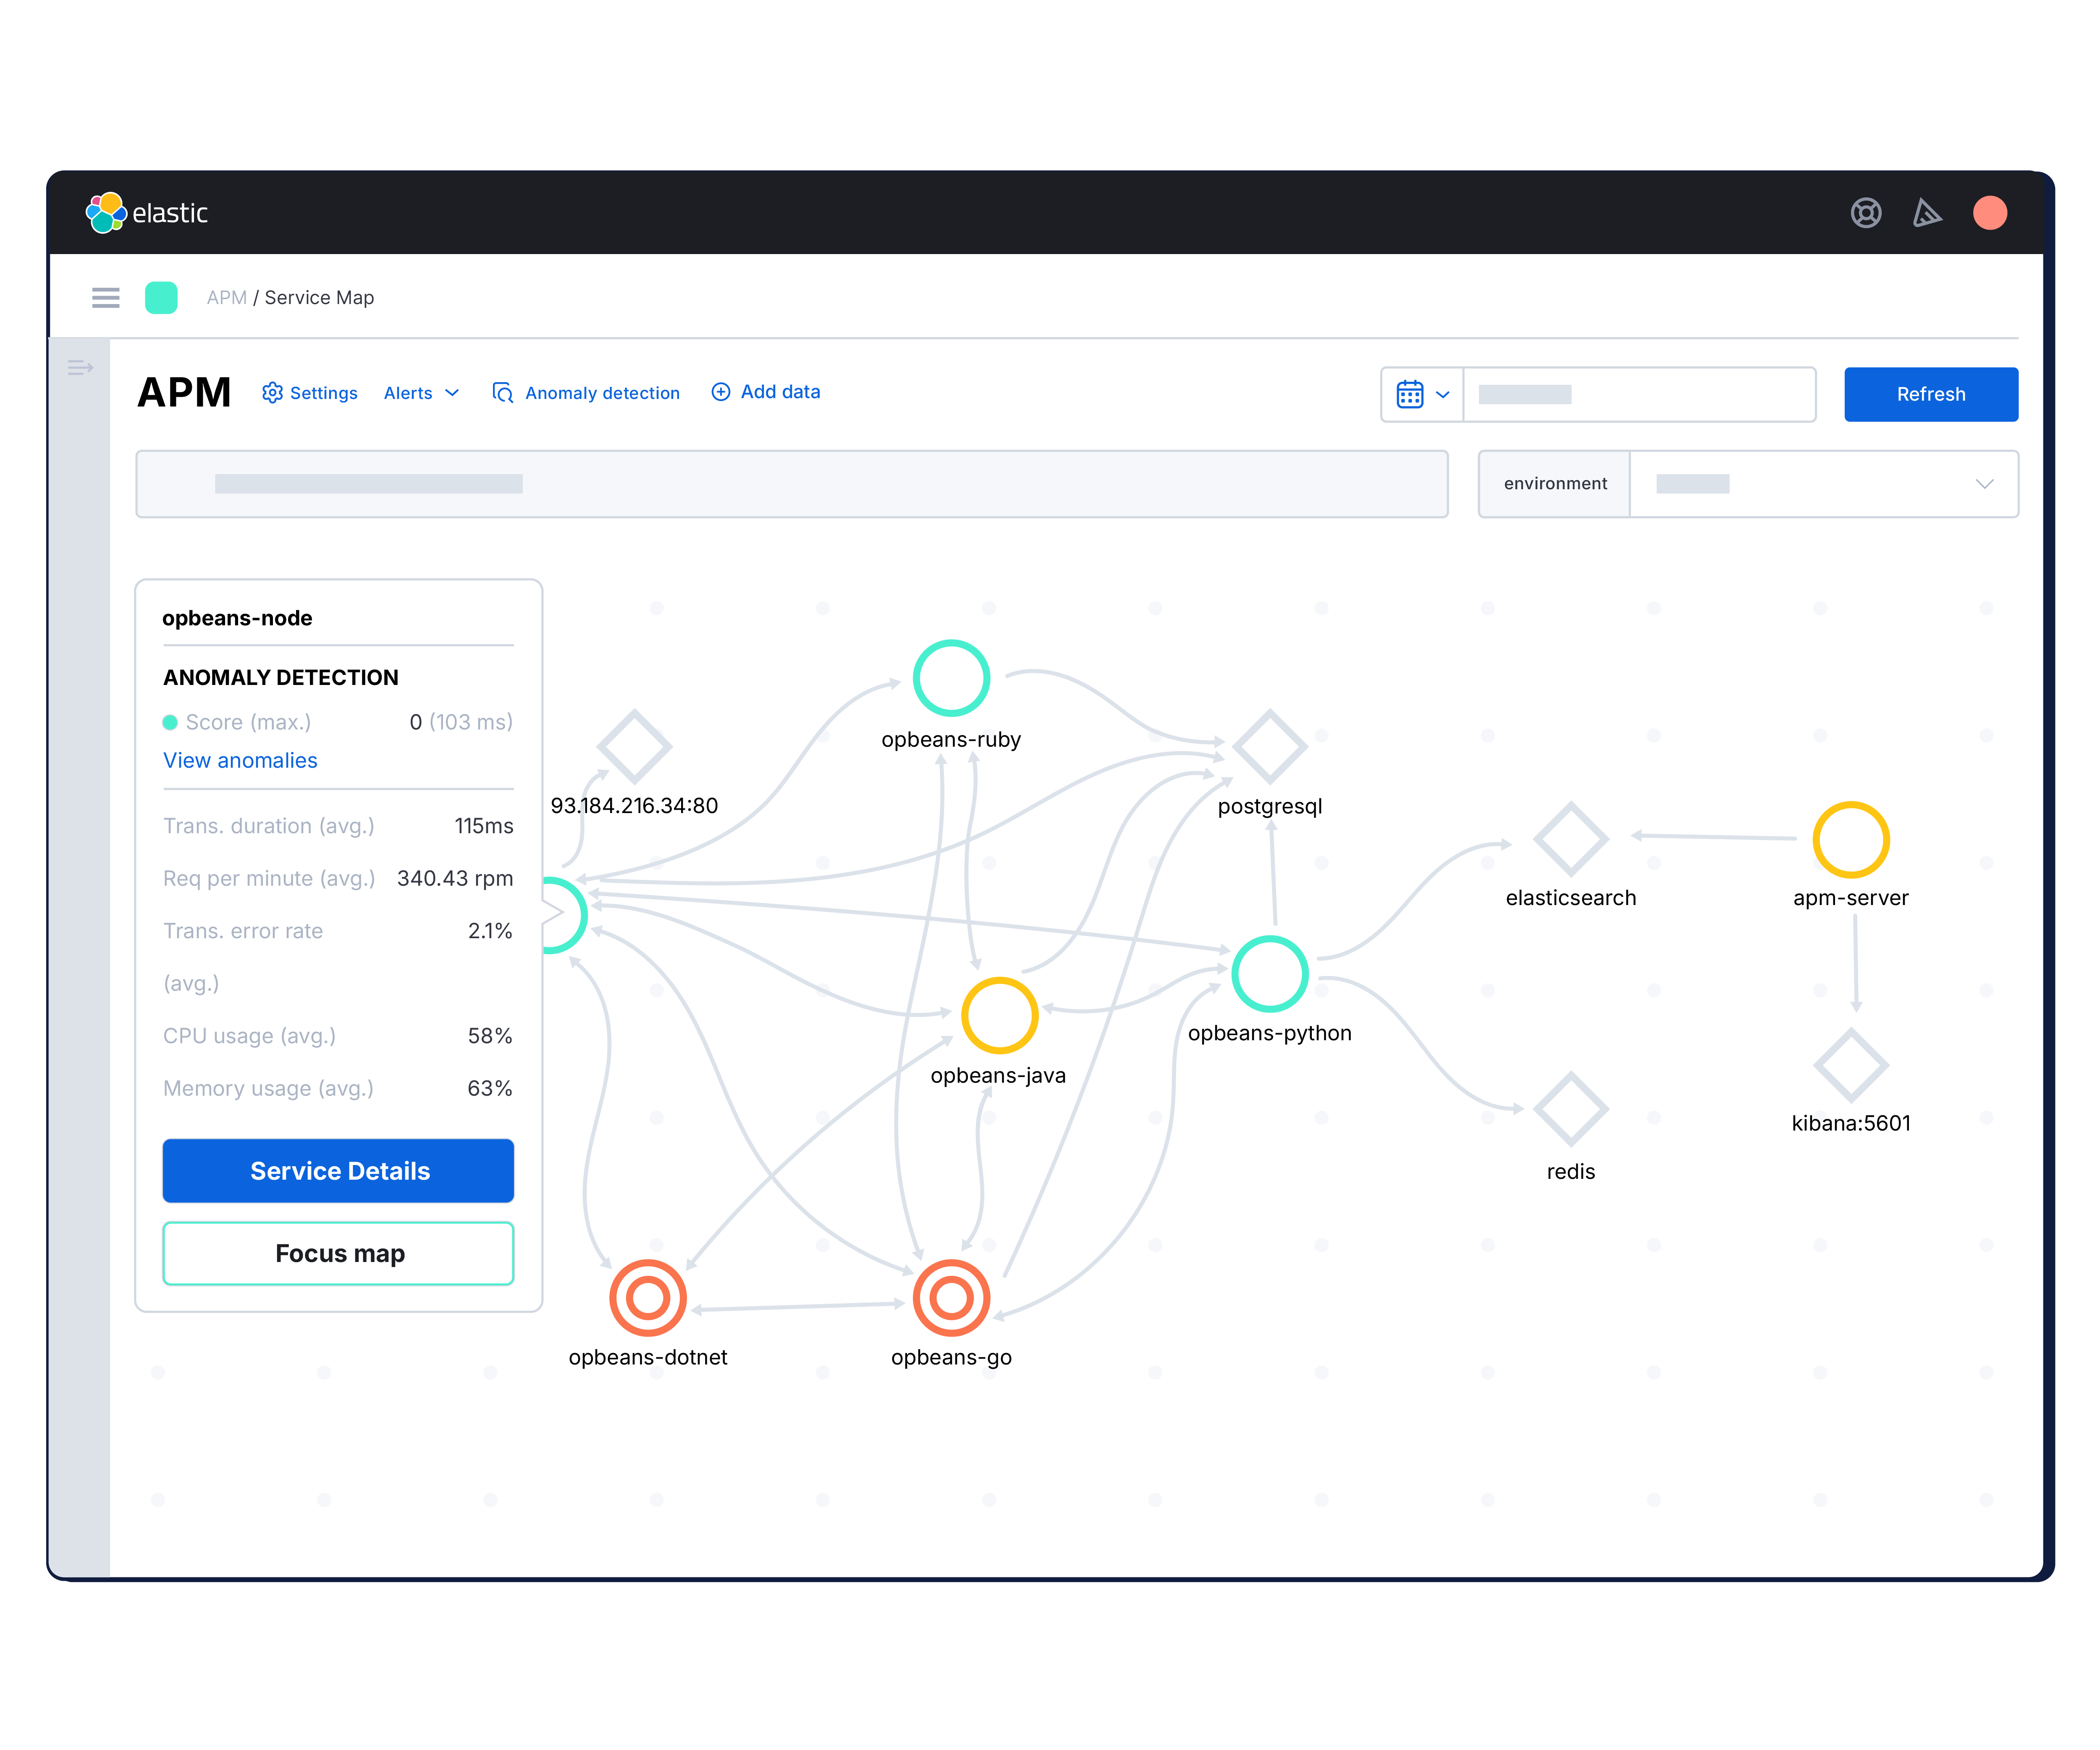
Spotlight anomalies and speed up troubleshooting across distributed microservices, serverless functions, AI models, third-party APIs, and more.

Bring your data. We'll do the rest.
STEP 1: Auto-instrument with OpenTelemetry (OTel) — it just works.
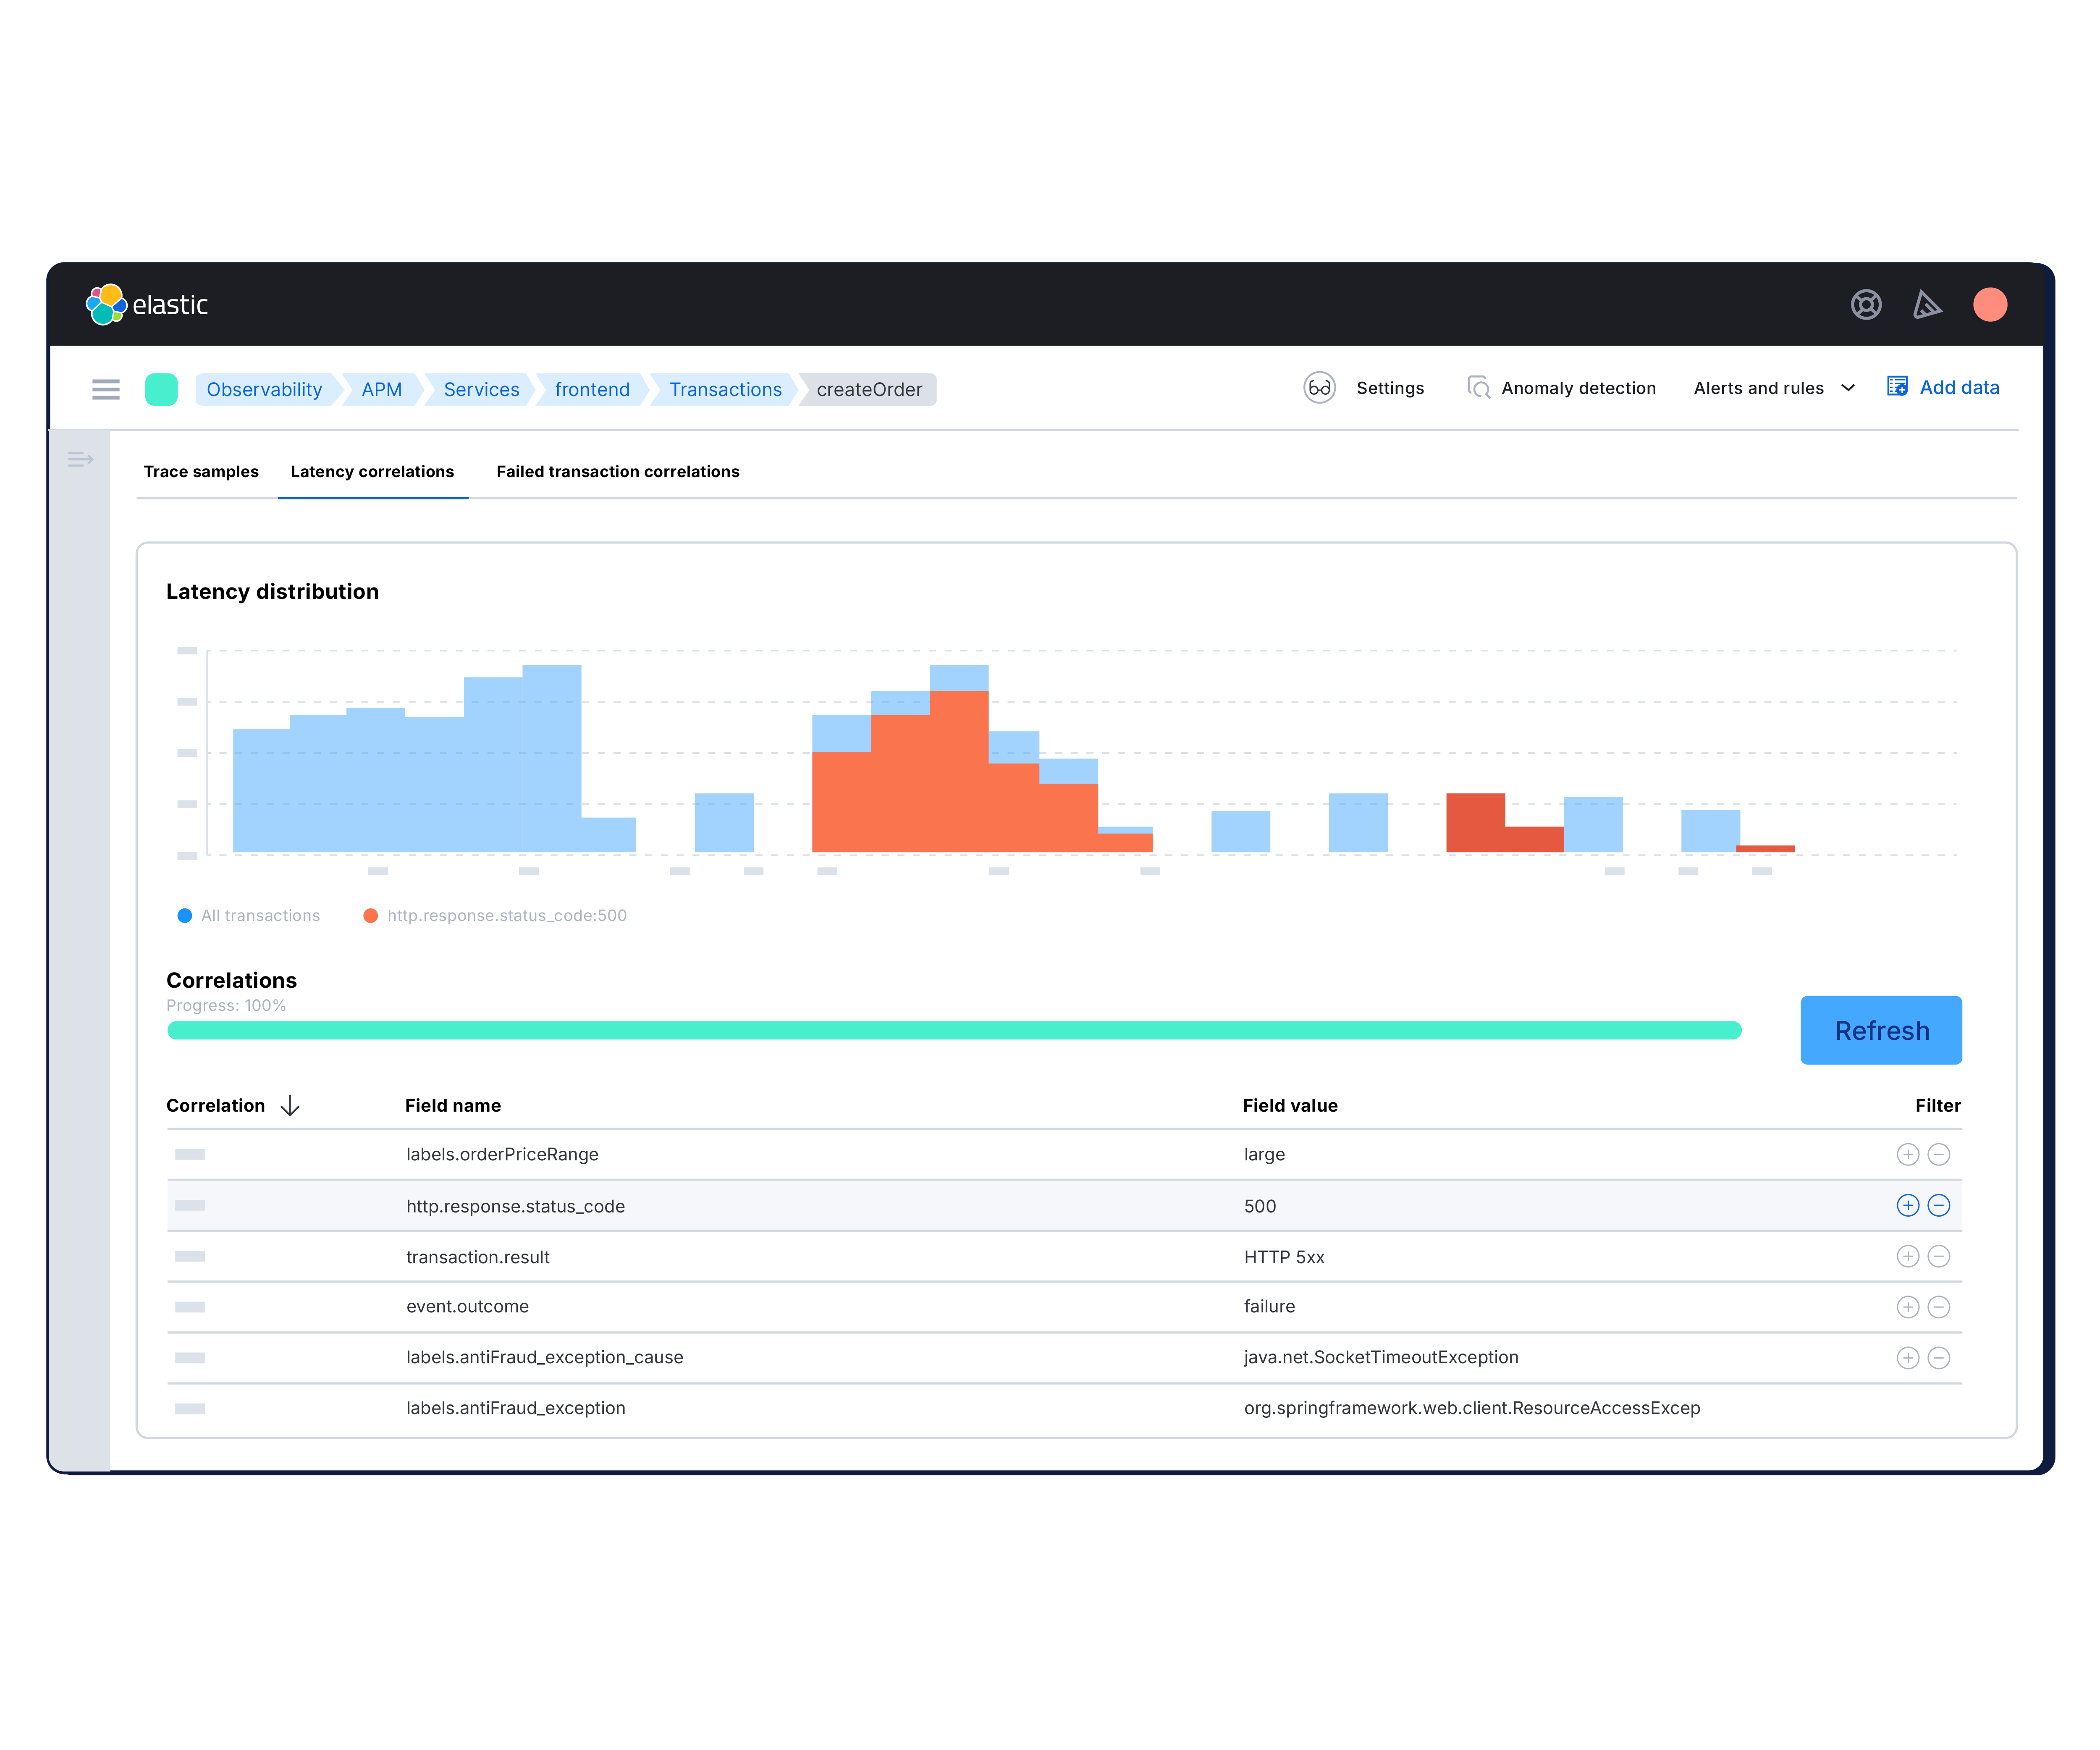
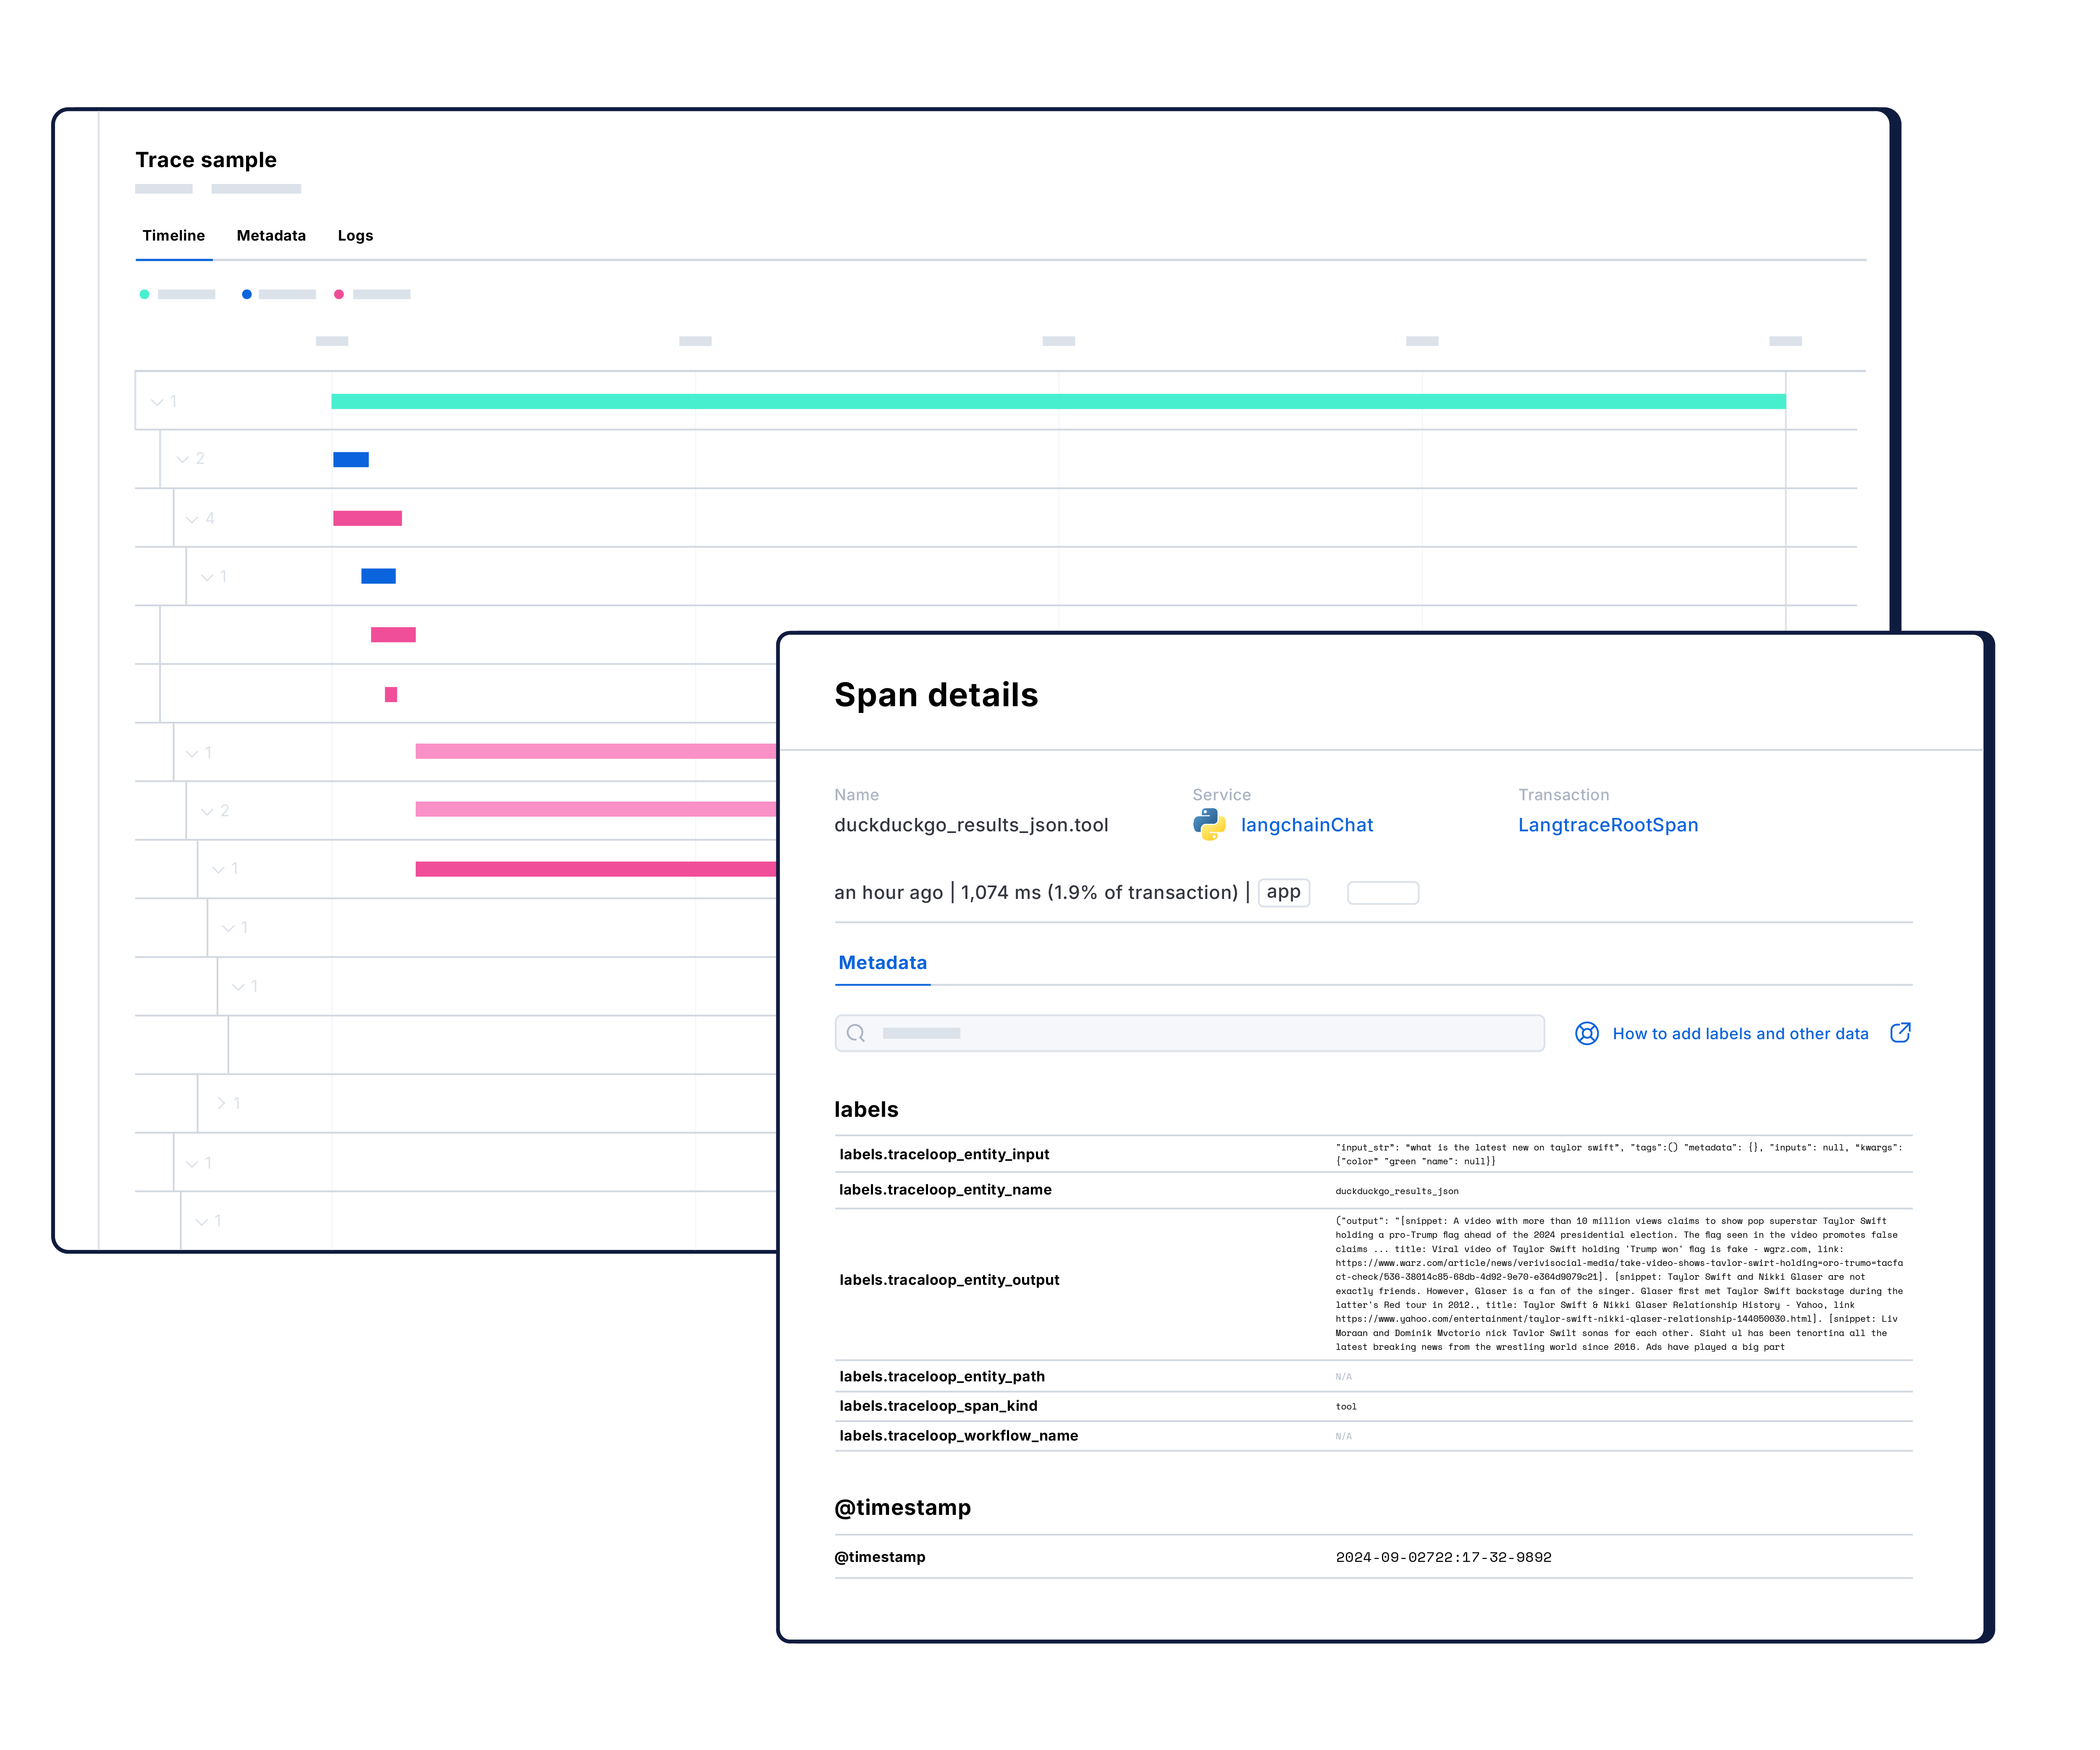
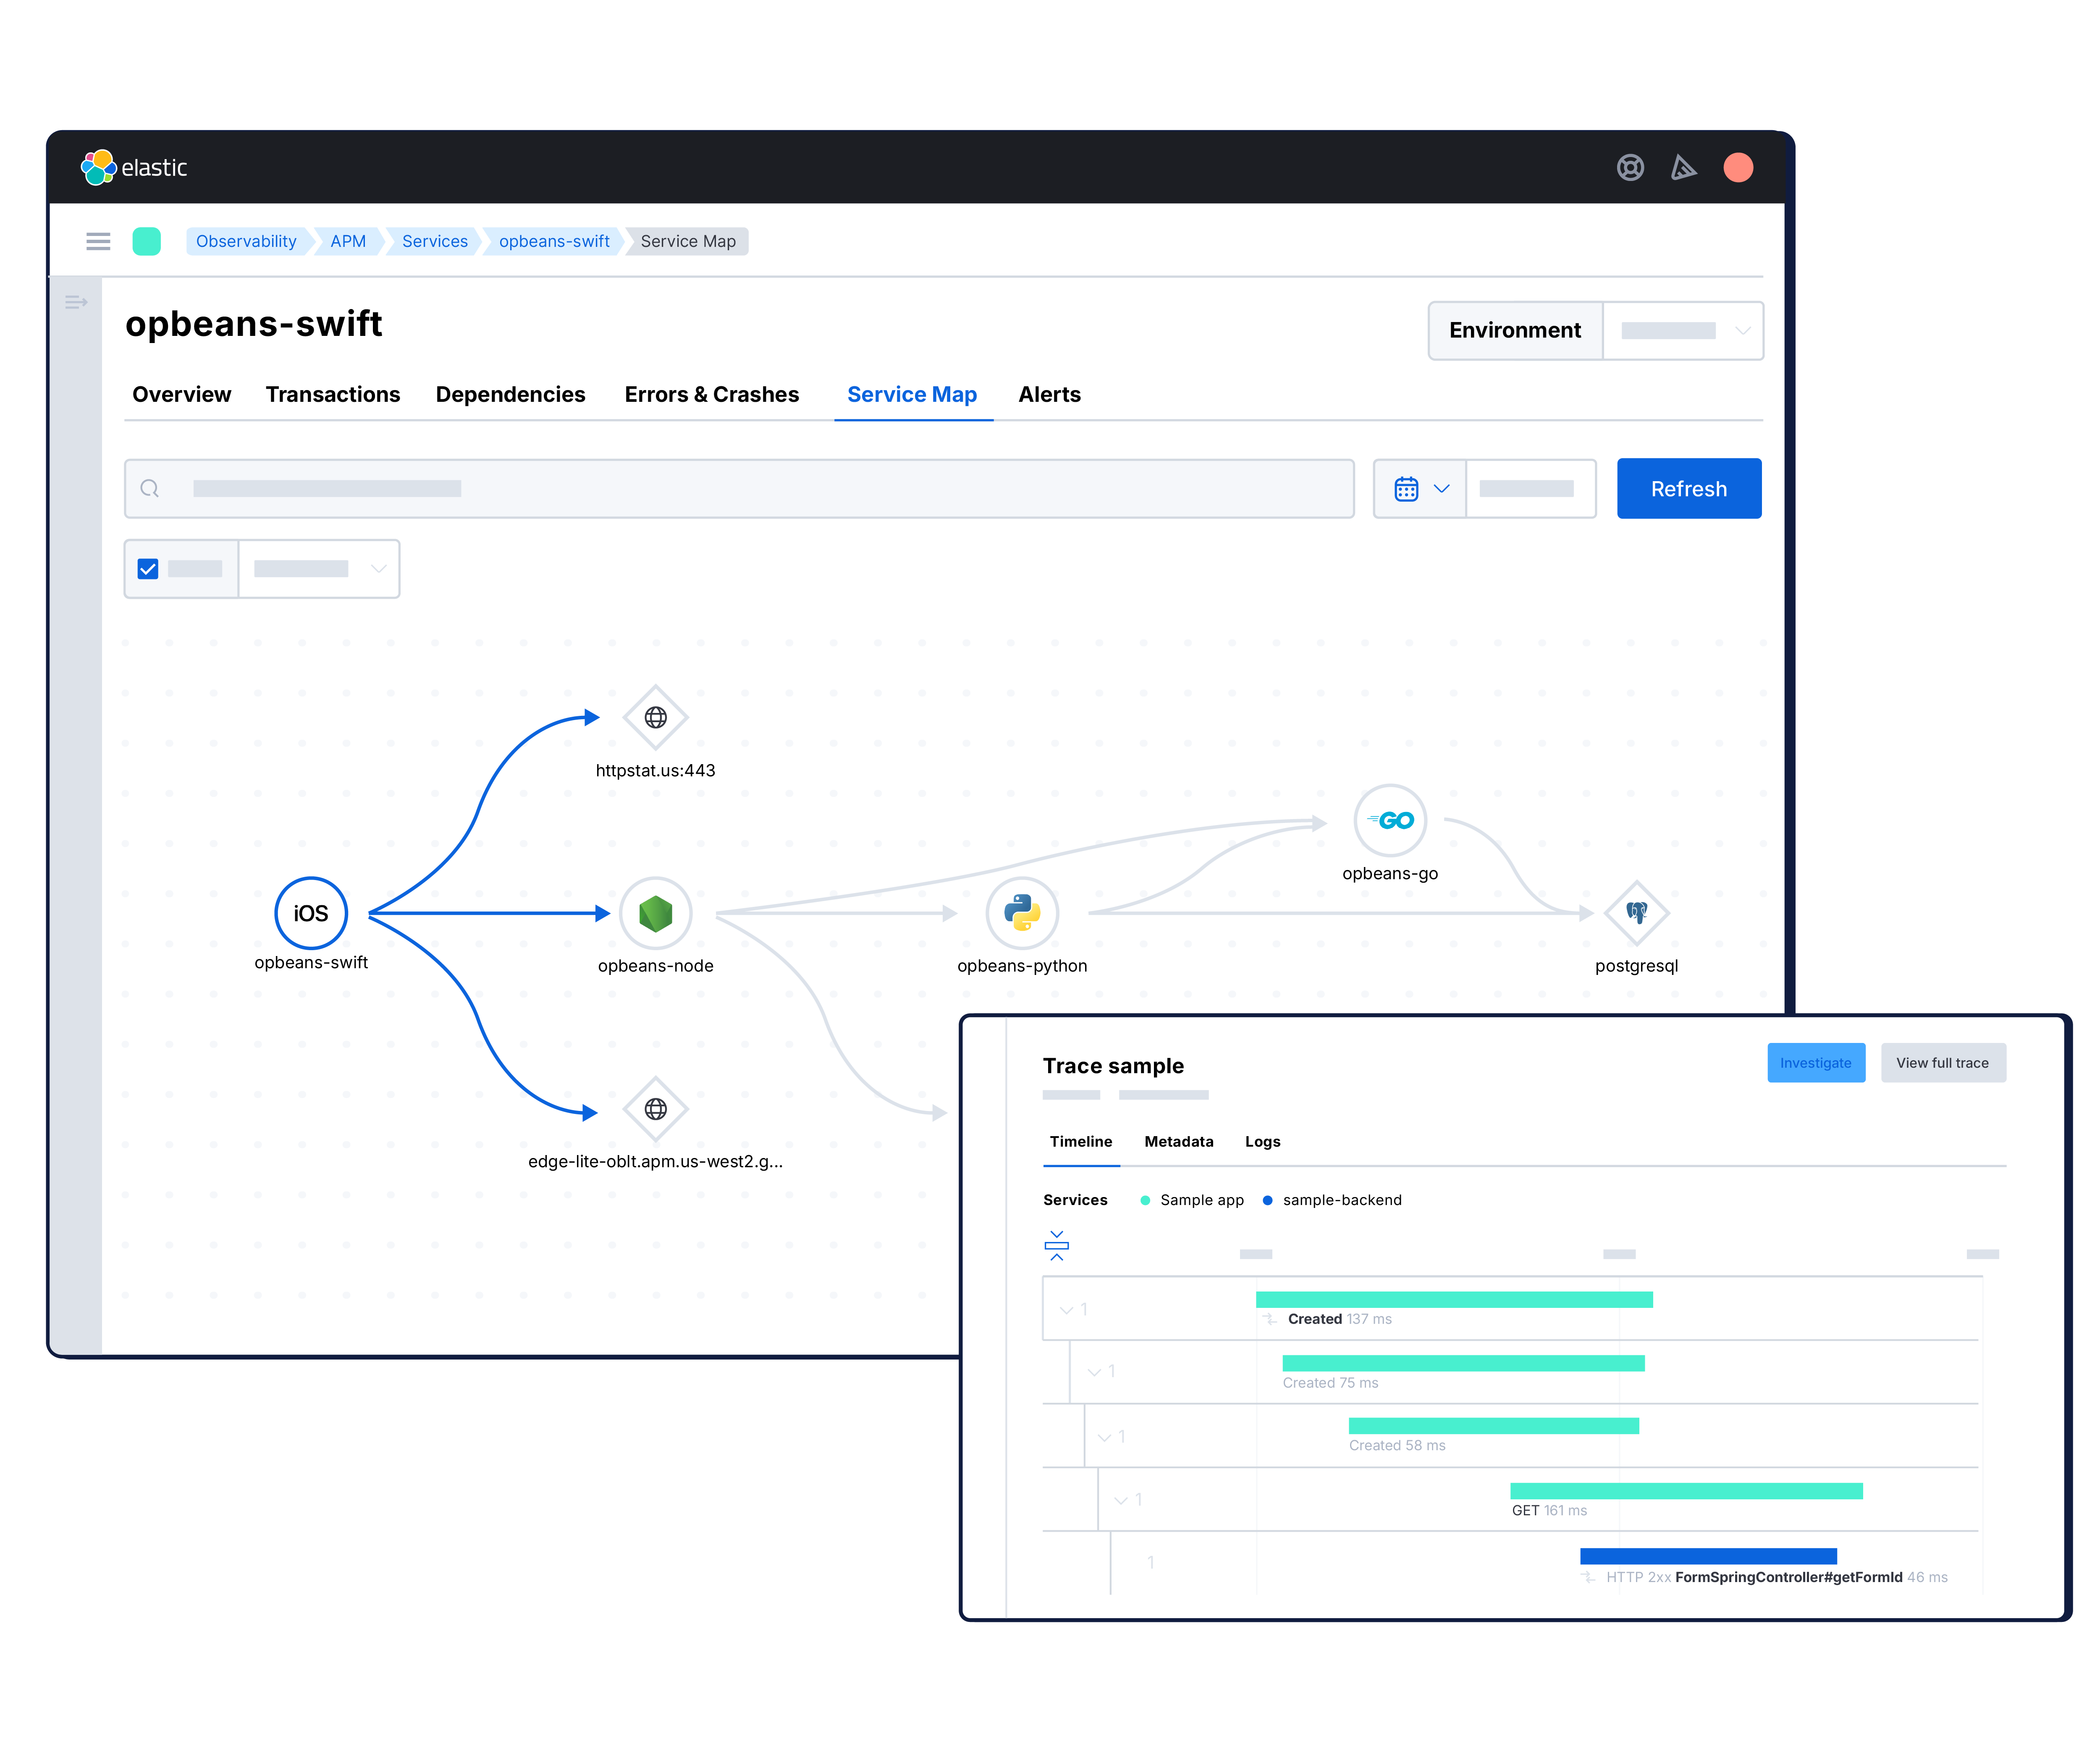
STEP 2: Visualize and analyze — with AI-assisted investigations.
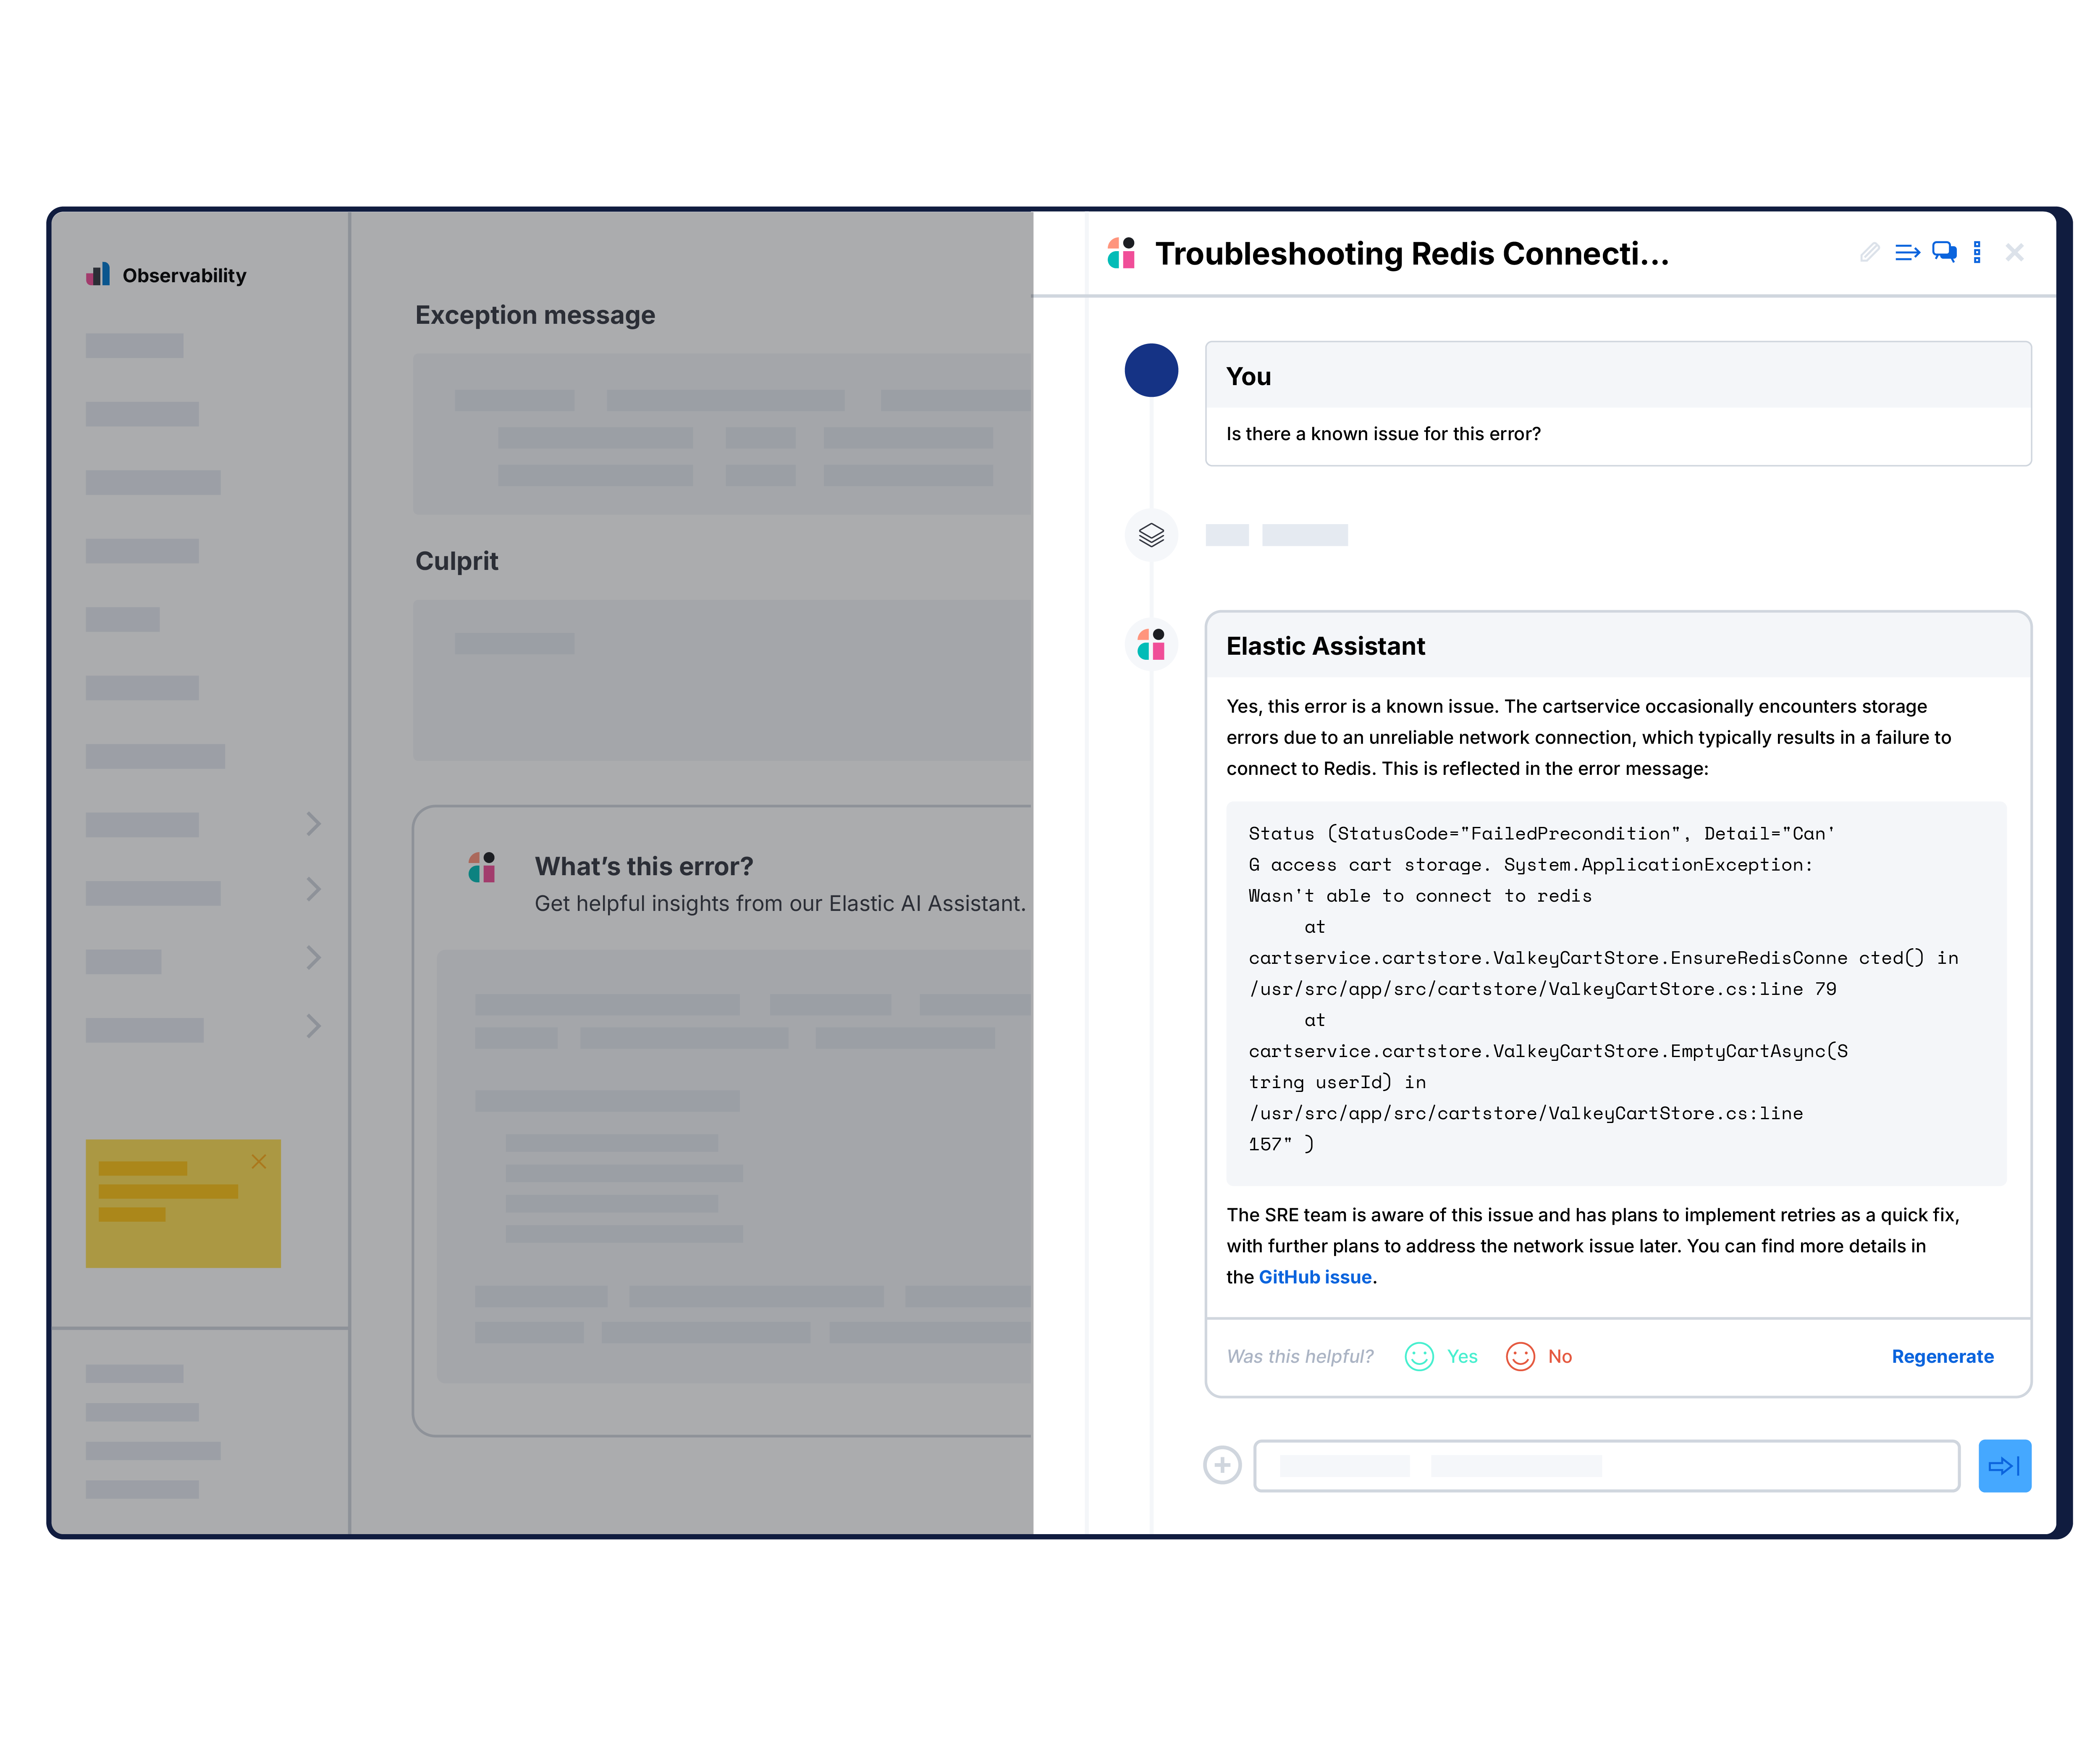
STEP 3: Pinpoint root cause — right down to the code.
STEP 2: Visualize and analyze — with AI-assisted investigations.
STEP 3: Pinpoint root cause — right down to the code.
WHY OTEL-NATIVE MATTERS
APM should be open. Period.
Data silos, proprietary formats, and closed ecosystems slow you down. Elastic is open source and OTel-native, delivering broad language support, improved interoperability, and detailed context for troubleshooting.


VISUALIZE & ANALYZE
Pinpoint code issues and debug faster
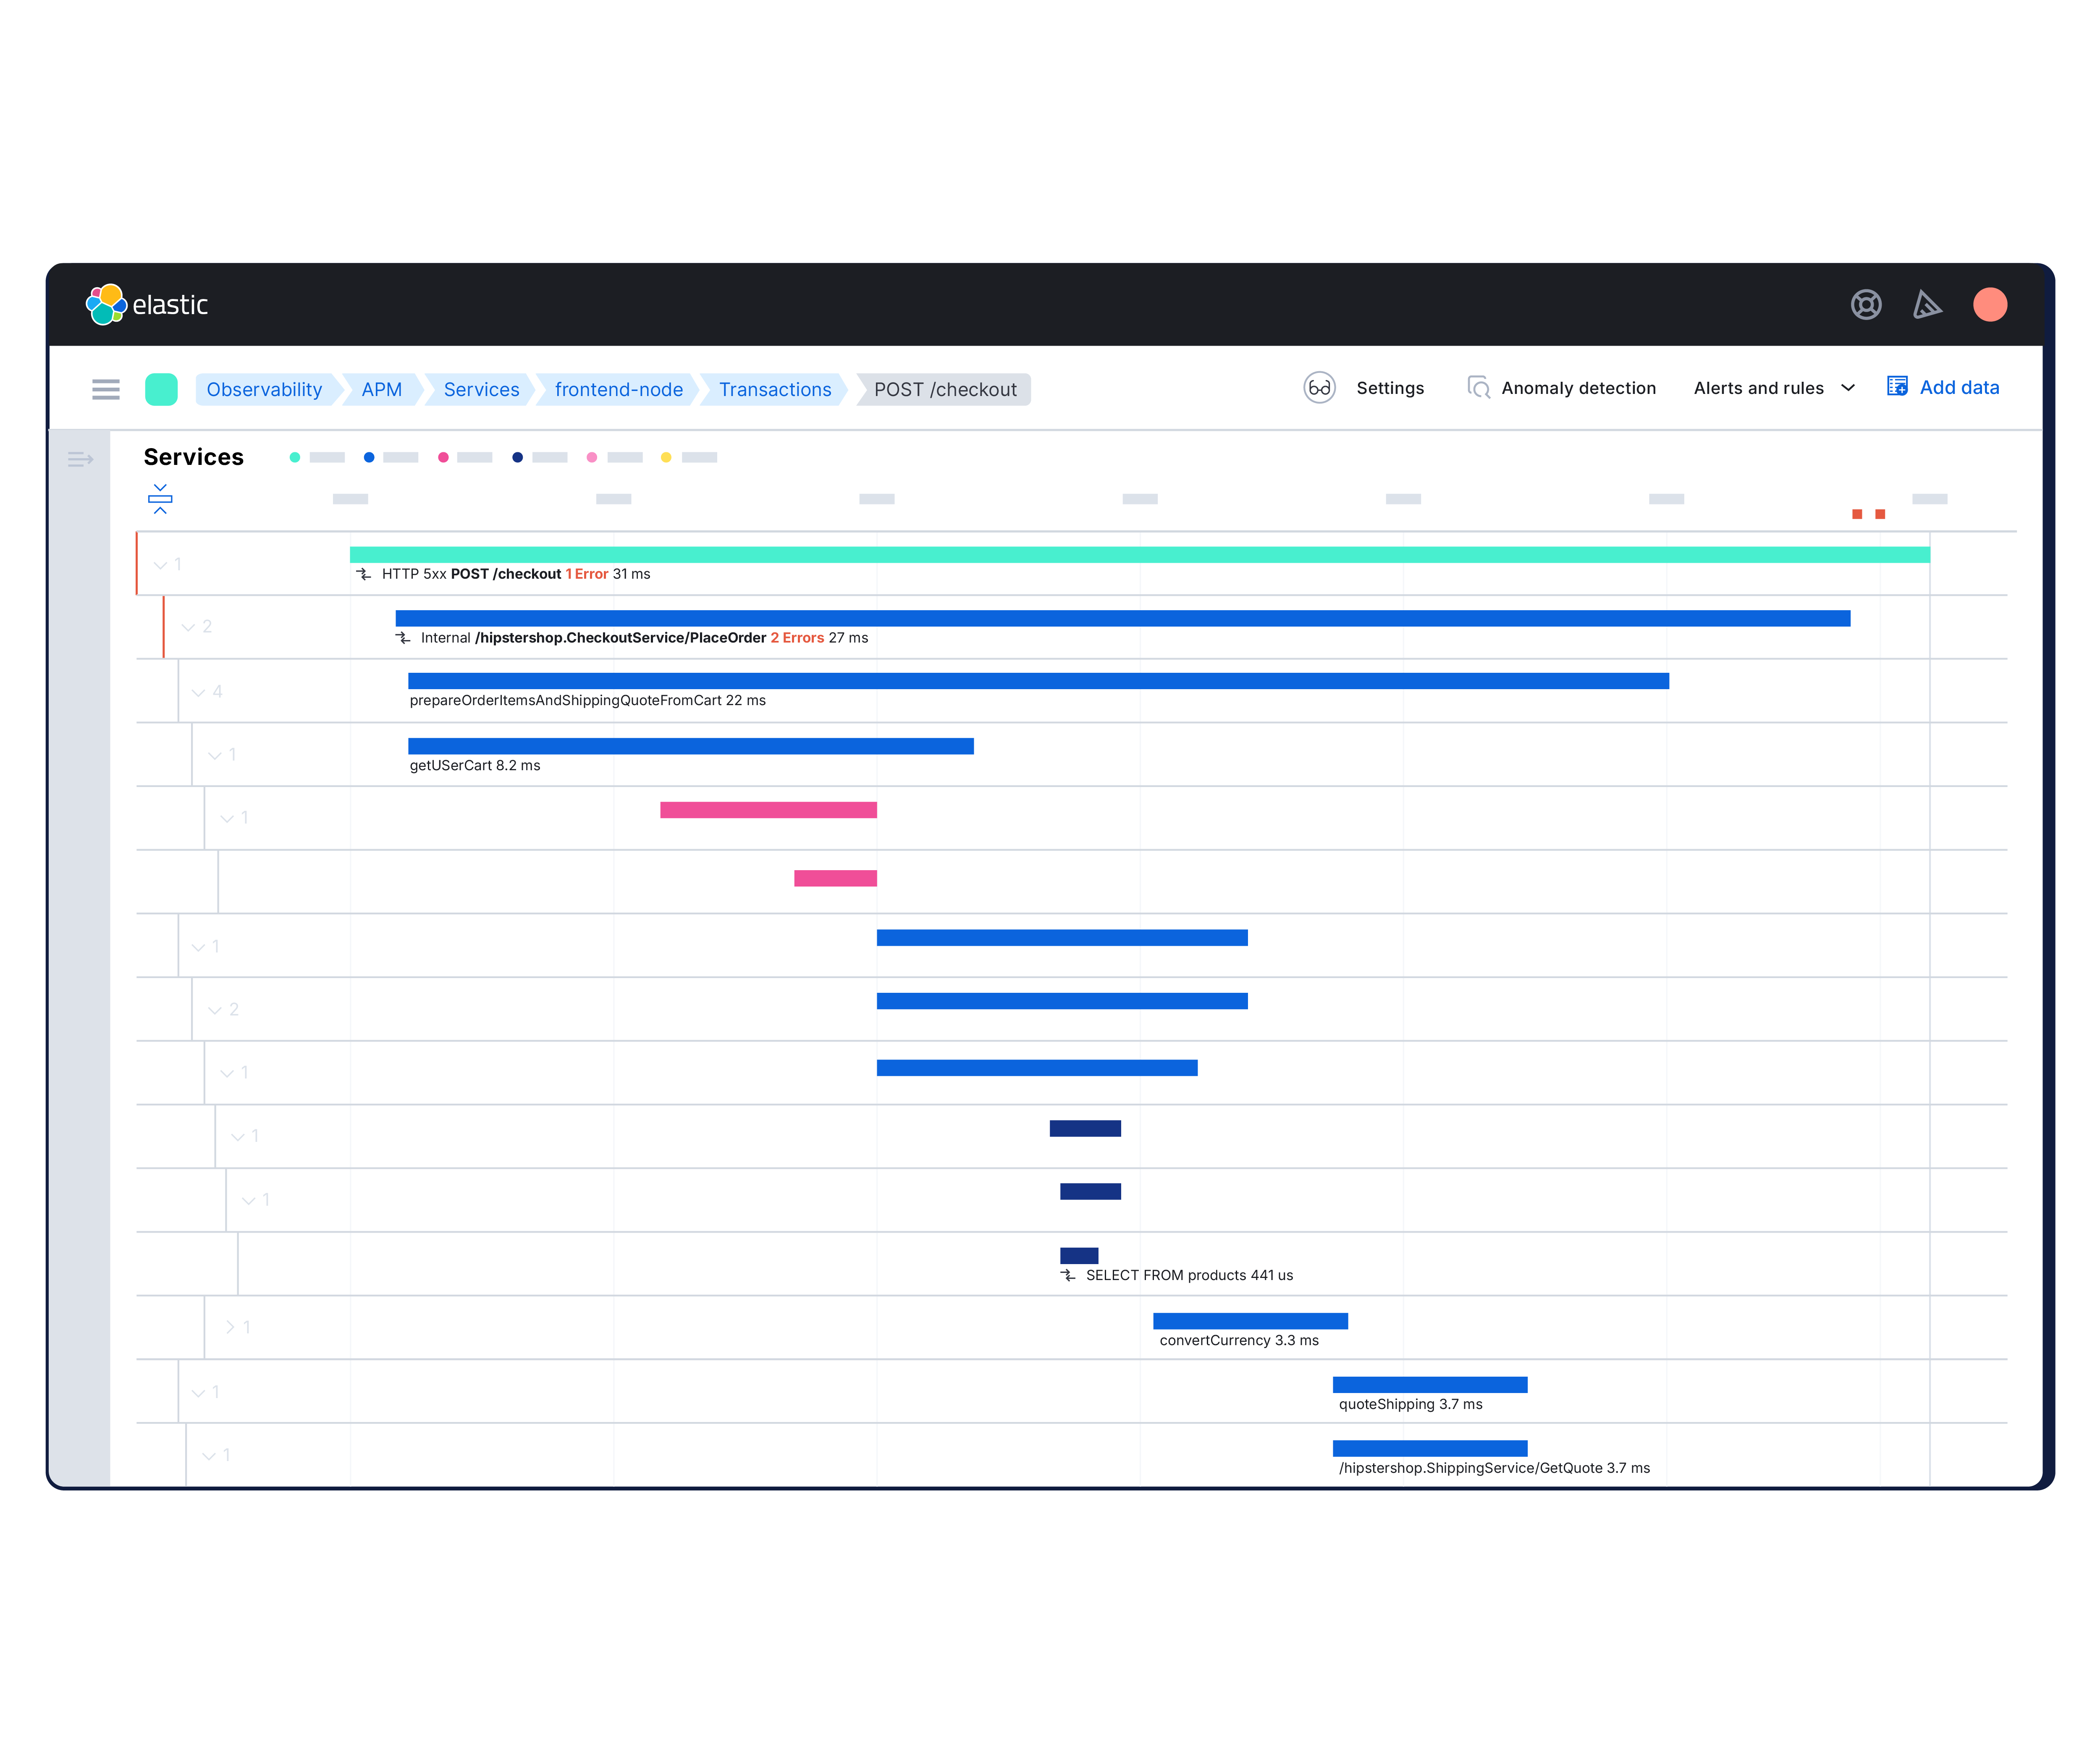
Every trace matters. Elastic gives you full visibility into every service, every span, and every request — captured and correlated.
- Track requests across your stack with lightweight, OpenTelemetry-based distributed tracing. Head- and tail-based sampling cuts overhead without cutting context. Get the critical traces you need without the performance penalty.
Broad language support


See why companies like yours choose Elastic APM
Get full end-to-end visibility — from code to infrastructure.
Customer spotlight
 Equinox uses Elastic APM to monitor 200+ microservices, cutting time to deploy fixes by up to 50% and accelerating issue resolution across its stack.
Customer spotlight
 Wells Fargo relies on Elastic APM to monitor money-moving apps at scale — capturing 100% of distributed traces and correlating them with logs and other signals.
Customer spotlight
 Lufthansa's Miles & More loyalty program uses Elastic APM to monitor key services, employing unified views for faster detection and root cause analysis.

