Monitor your multi-cloud and hybrid infrastructure
Ship logs, metrics, and events from 450+ data sources, including AWS, Microsoft Azure, and Google Cloud. Detect, investigate, and resolve issues quickly with AI using Elastic Observability.
From cloud to bare metal
Bring your infrastructure into focus
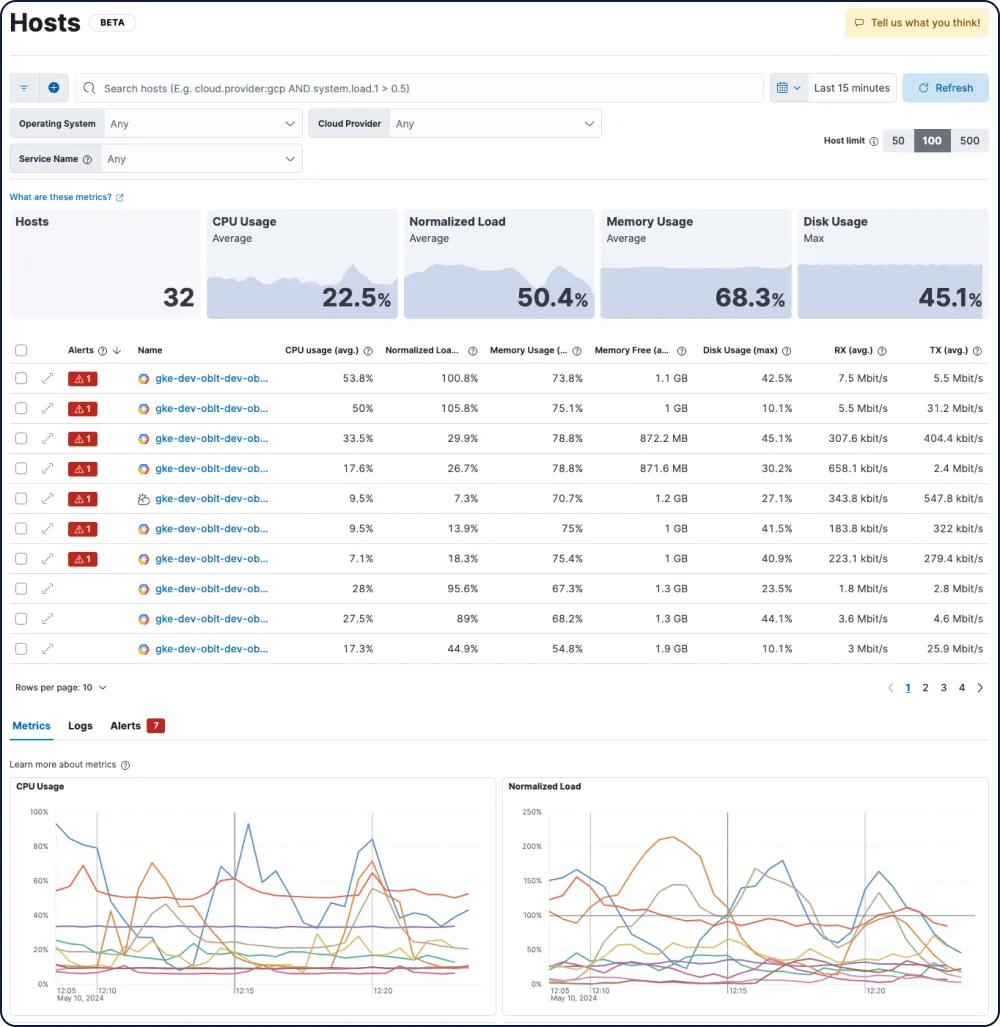
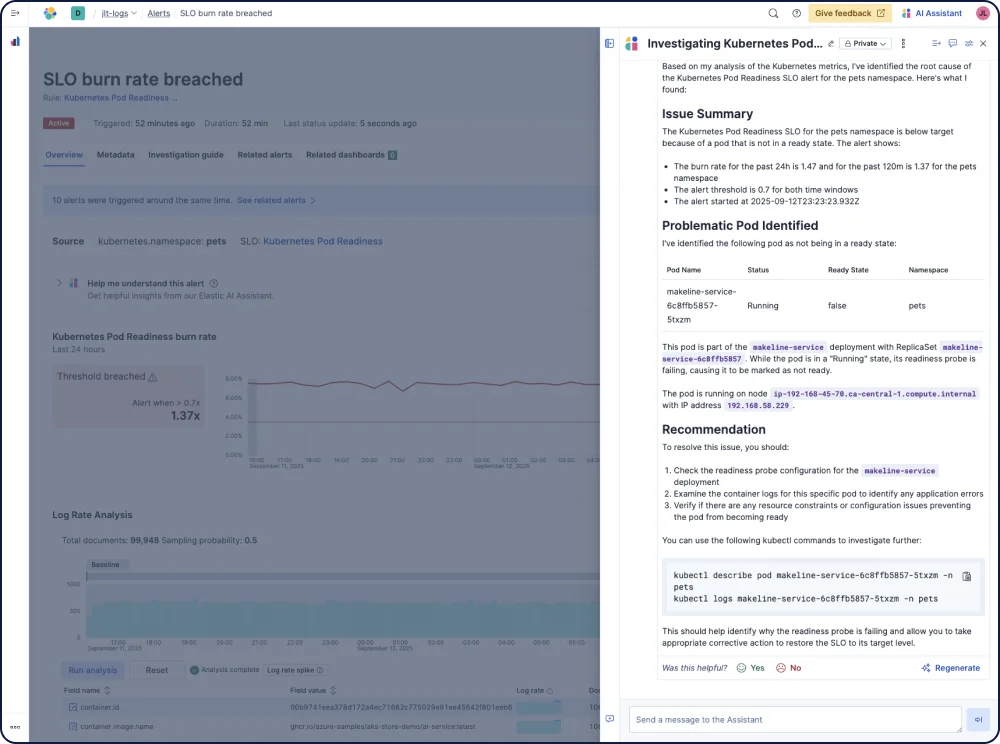
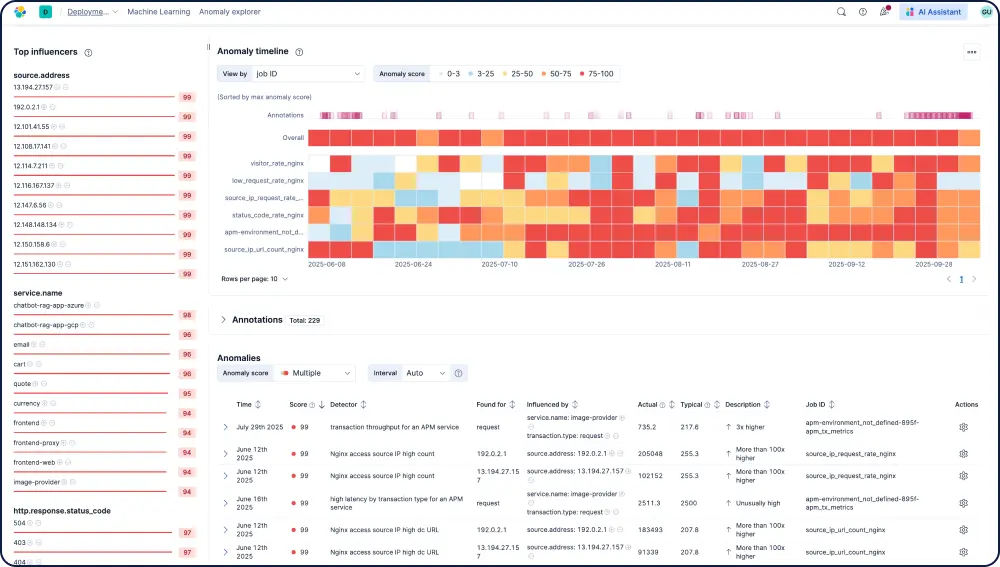
Elastic gives you rich AI-powered contextual visibility into your infrastructure, highlights anomalies, and uncovers trends, so you can plan capacity, and detect and resolve issues faster.
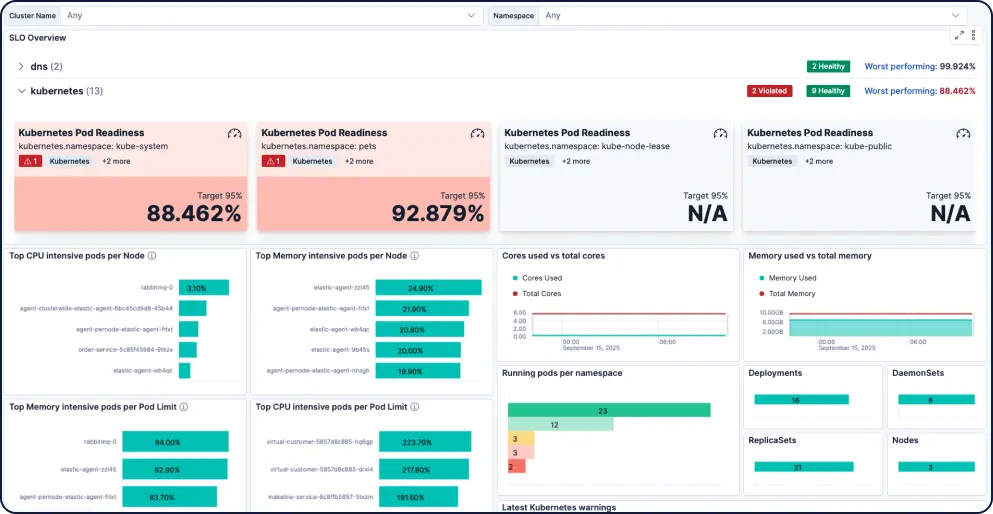
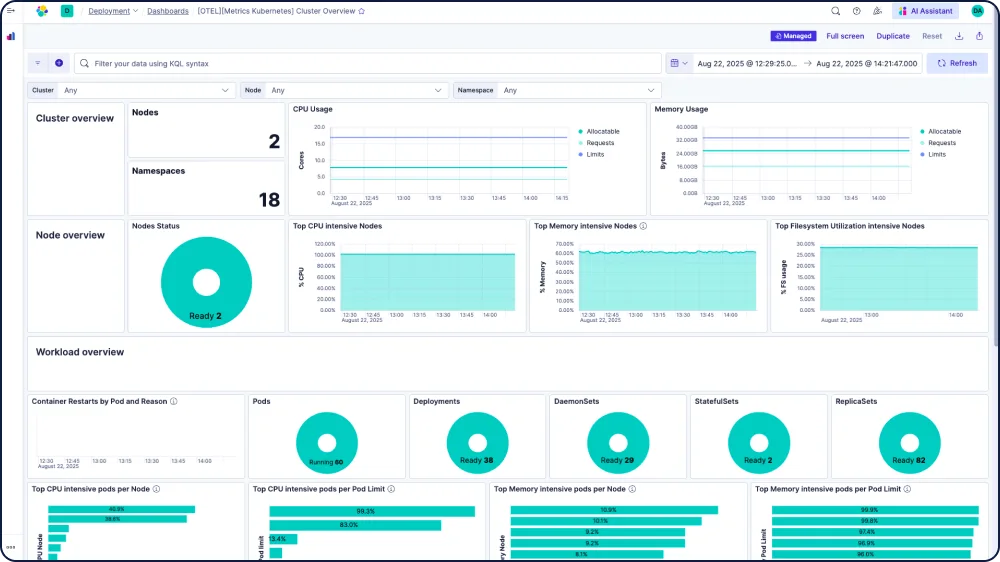
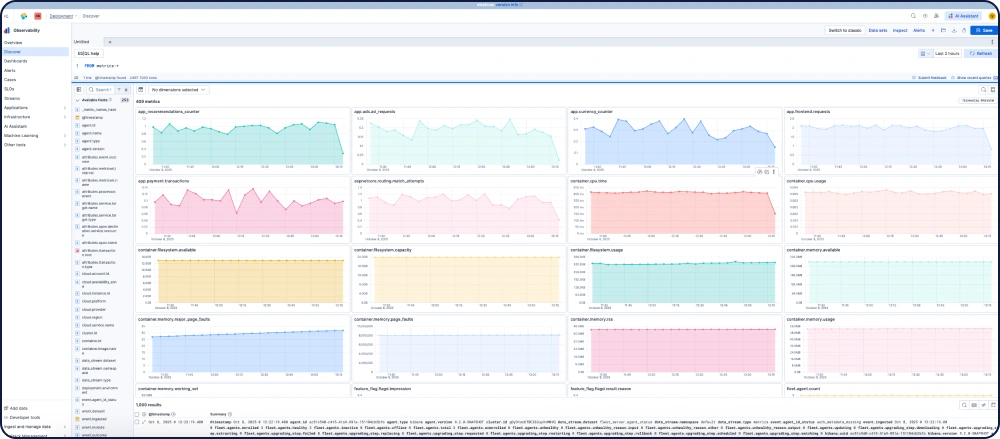
Out-of-the-box and customizable dashboards track performance and health across on-prem and cloud infrastructure. Track SLOs, resource metrics, and anomalies from a single view for faster troubleshooting.


Custom data integrations in minutes
You can also easily build custom integrations for bespoke use cases using sample logs with AI-driven Automatic Import. Agentic workflows handle normalization, pipelines, mappings, and templates, while you inspect and adjust as needed. Results are fully reusable.Cloud telemetry made simple
Effortlessly stream telemetry from your critical cloud provider services, including via secure agentless collection directly from the cloud console.


See why companies like yours choose Elastic Observability
Get log analytics at scale to turn messy logs into operational answers.
Customer spotlight

Comcast ingests 400 terabytes of data daily with Elastic to monitor services and accelerate root cause analysis, ensuring a top-notch customer experience.
Customer spotlight

Discover reduced storage costs by 50% and improved data retrieval times by implementing a centralized logging platform with Elastic.
Customer spotlight

Informatica cut costs and reduced MTTR by migrating its entire logging workload to Elastic for 100+ applications and 300+ Kubernetes clusters.