Looking at the gross domestic product (GDP) per capita of a place is just one way to measure its standard of living and economic health — and in the US, that figure can vary dramatically from state to state.
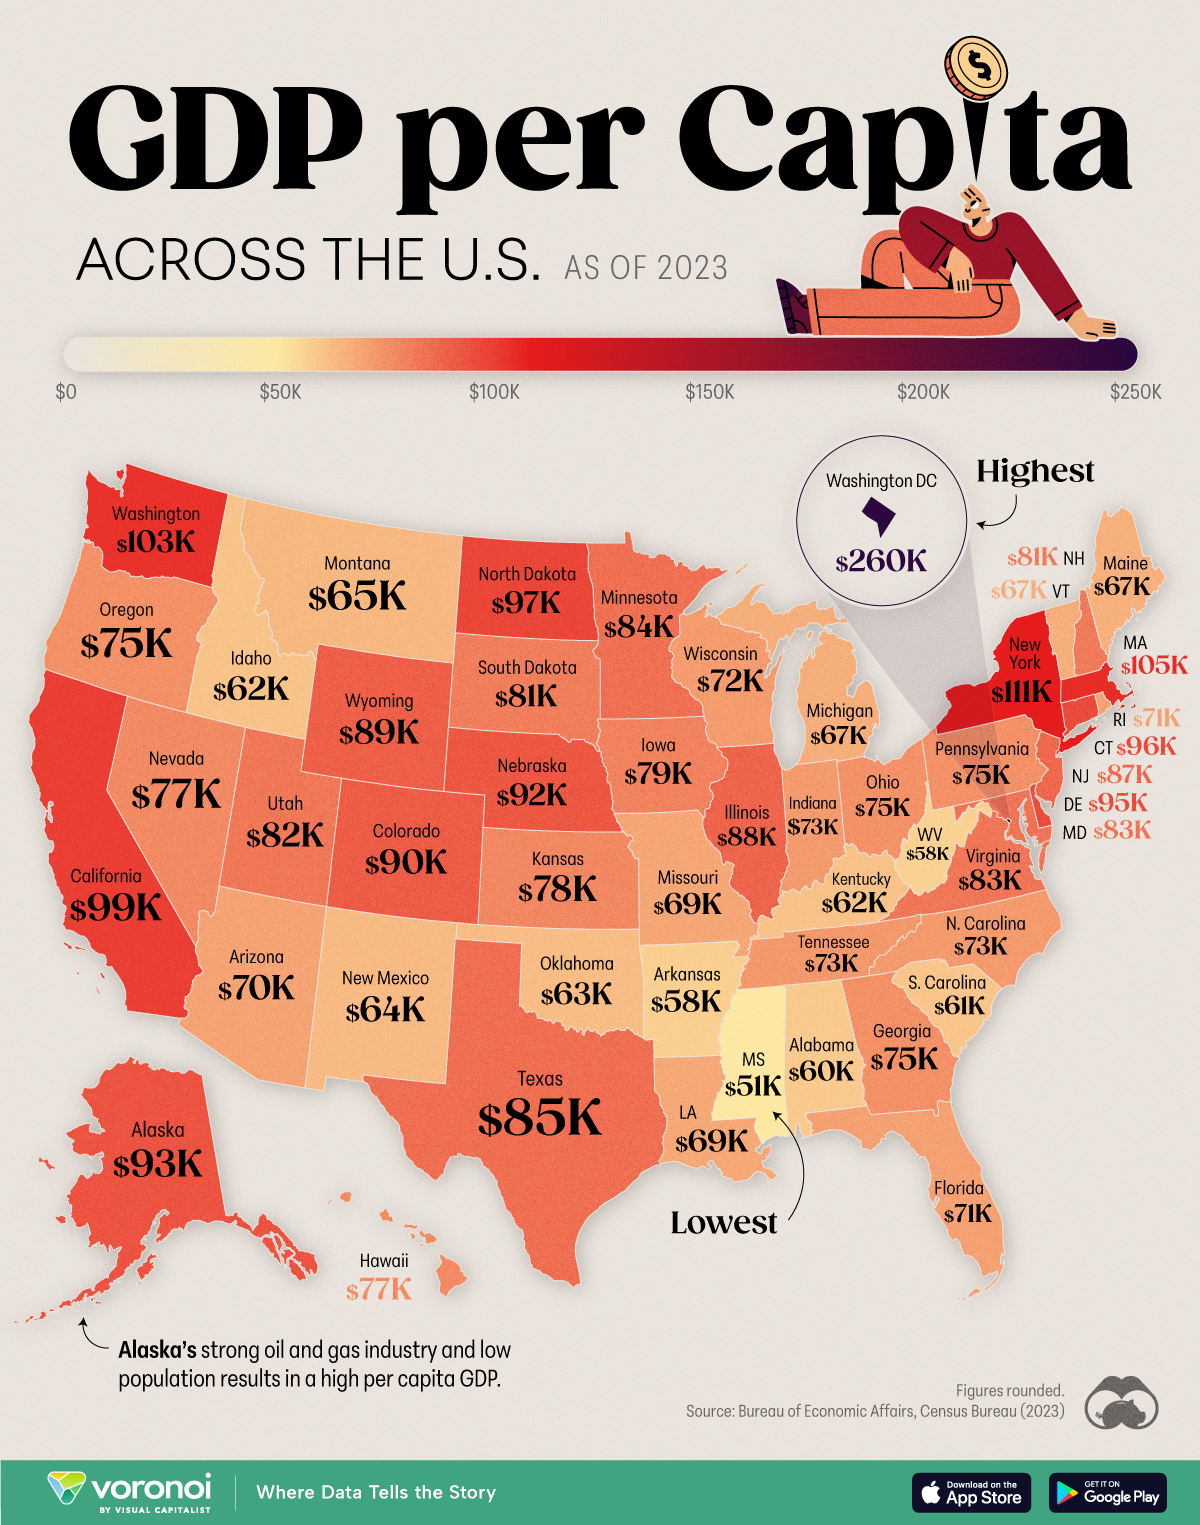
Based on 2023 data from the Bureau of Economic Affairs and the Census Bureau, the map below shows the GDP per capita of each US state.
The highest per-capita GDP in the US belongs to Washington, DC, where it stands at almost $260,000. Trailing behind in second and third place are New York ($110,980) and Massachusetts ($105,164).
Washington and California round off the top five states, with per-capita GDPs of $103,402 and $99,329, respectively.
The country's lowest GDPs per capita belong to states in the South: Mississippi ($51,416), West Virginia ($57,711), Arkansas ($58,221), Alabama ($59,692) and South Carolina ($60,932). These states are also home to some of the highest poverty rates in the US.
Click image to enlarge
Via Visual Capitalist.

