

LLM observability
Monitor and optimize AI performance, cost, safety, and reliability
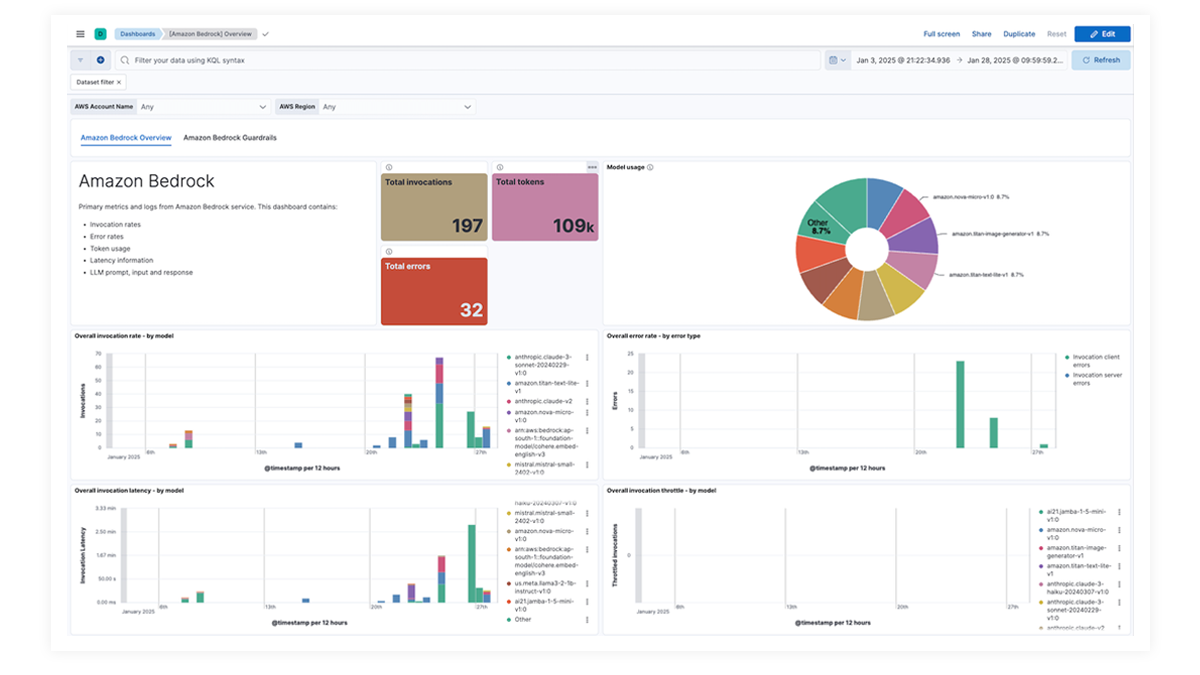
Get the full picture with at-a-glance dashboards
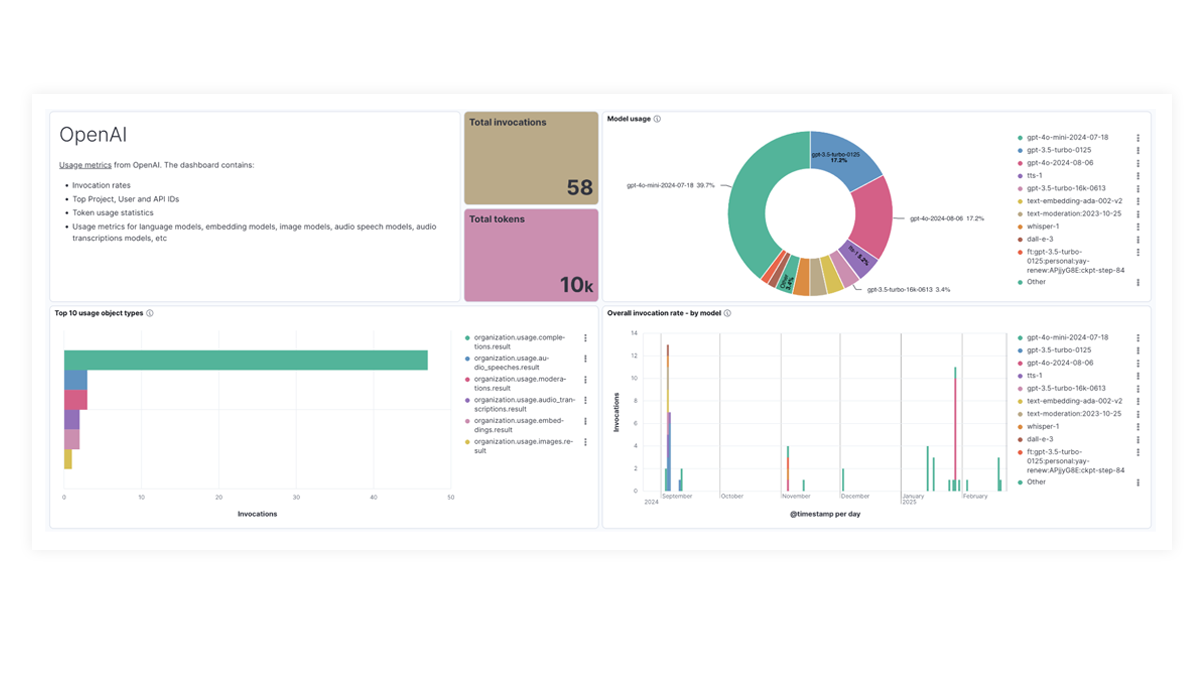
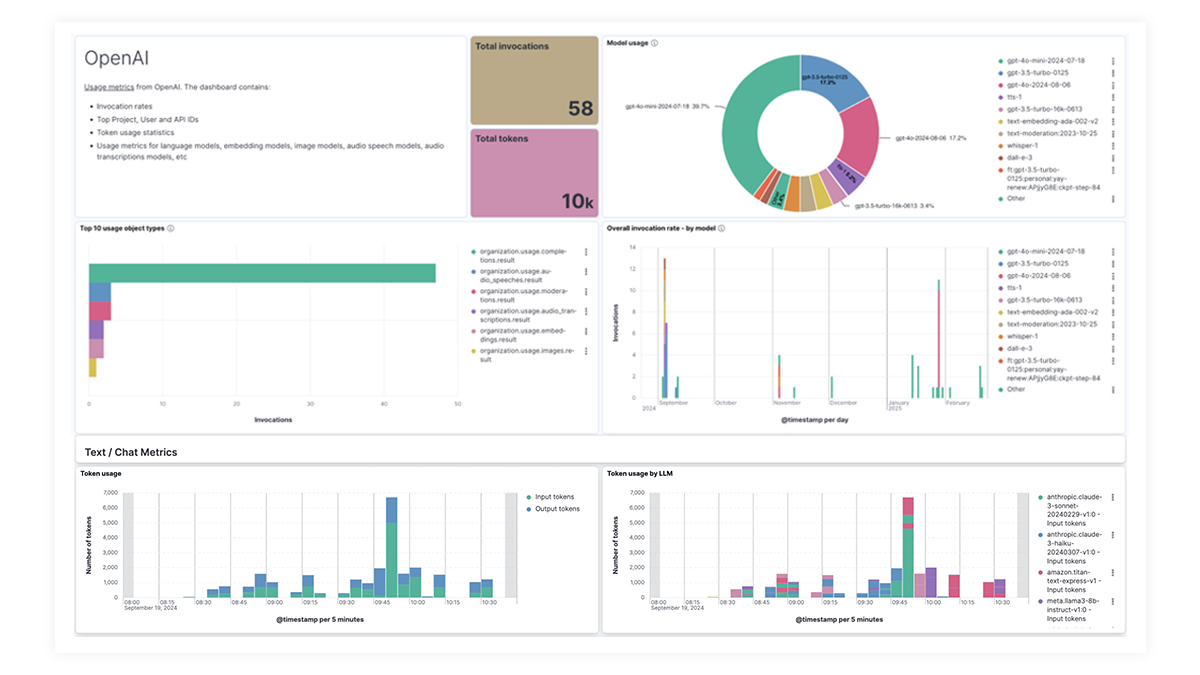
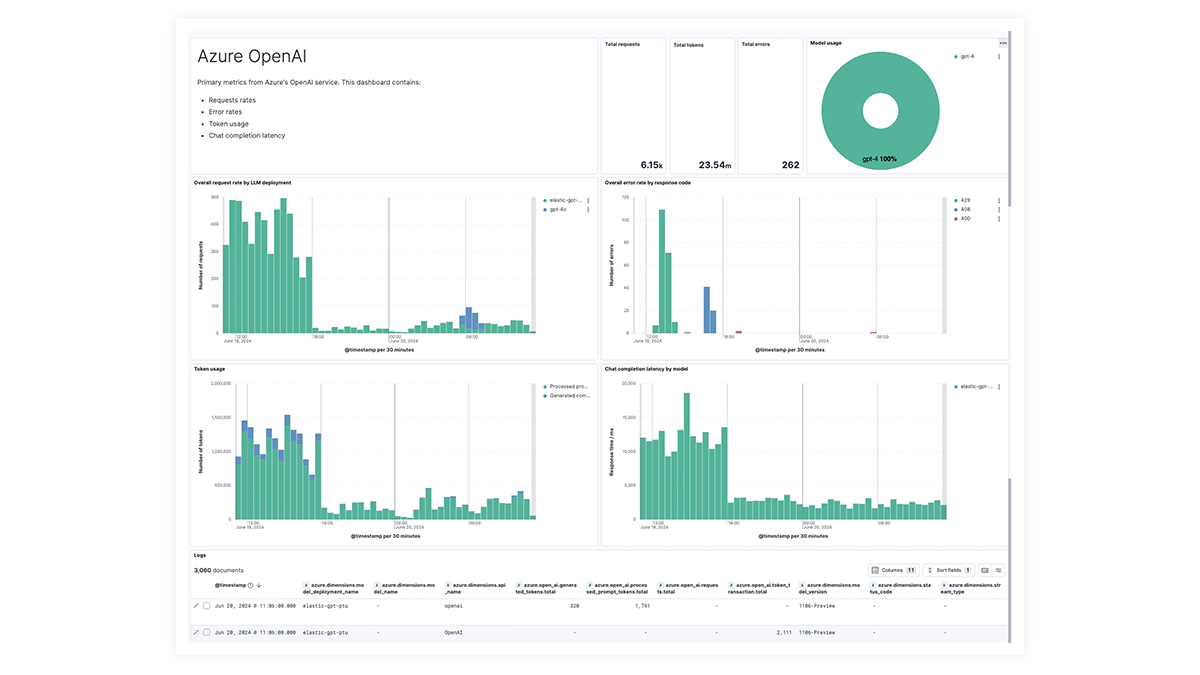
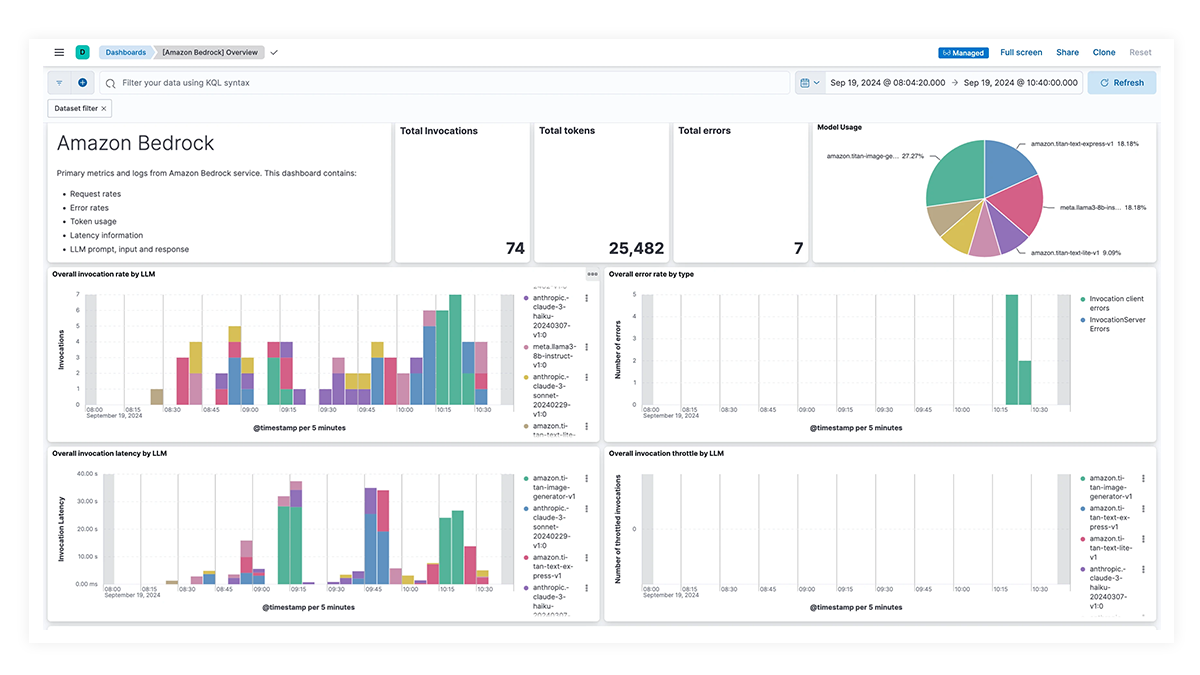
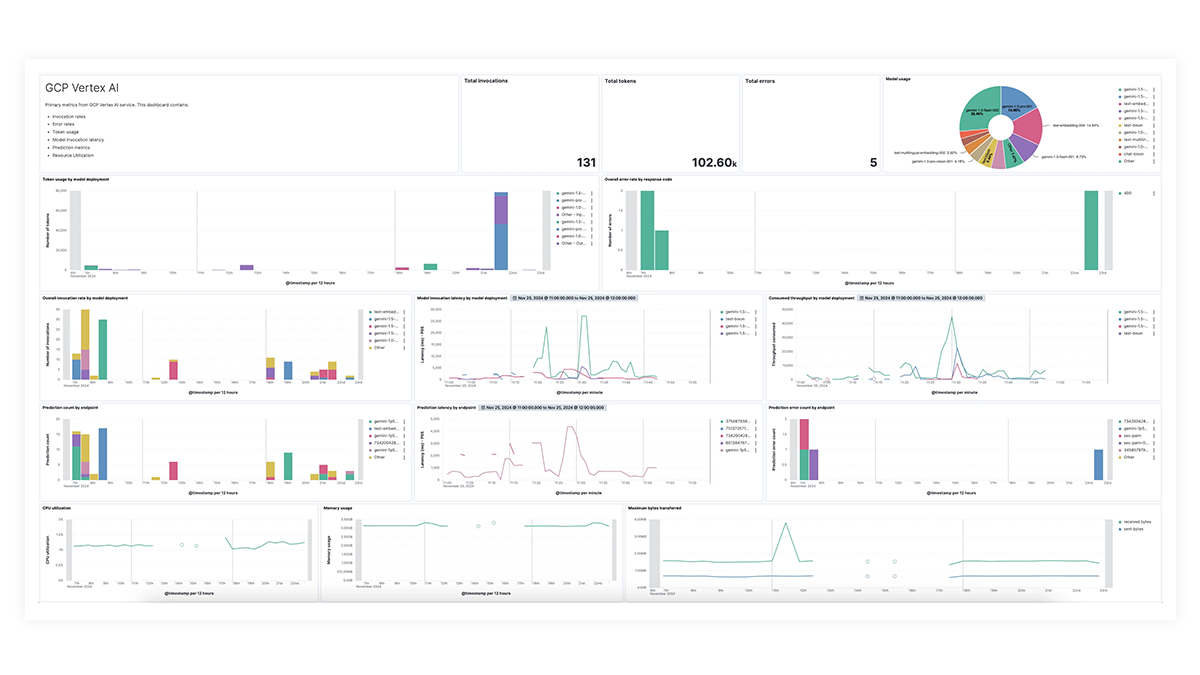
Prebuilt dashboards for OpenAI, AWS Bedrock, Azure OpenAI, and Google Vertex AI offer comprehensive insights into invocation counts, error rates, latency, utilization metrics, and token usage, enabling SREs to identify and address performance bottlenecks, optimize resource utilization, and maintain system reliability.
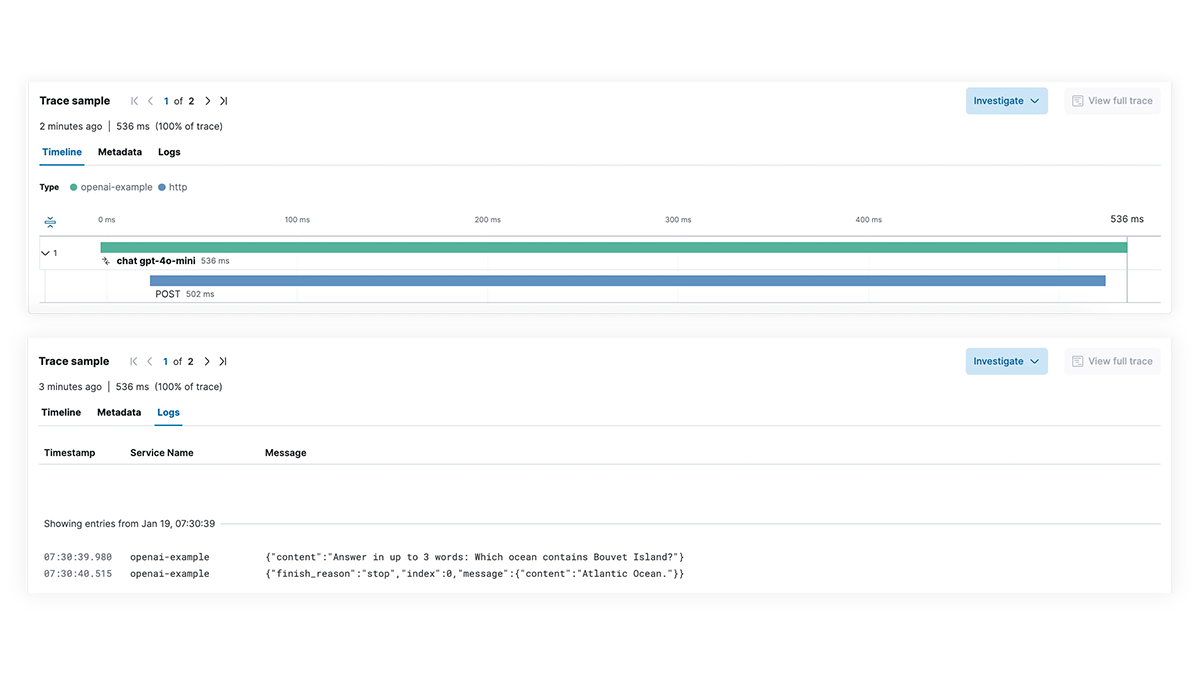
Slow performance? Pinpoint root causes
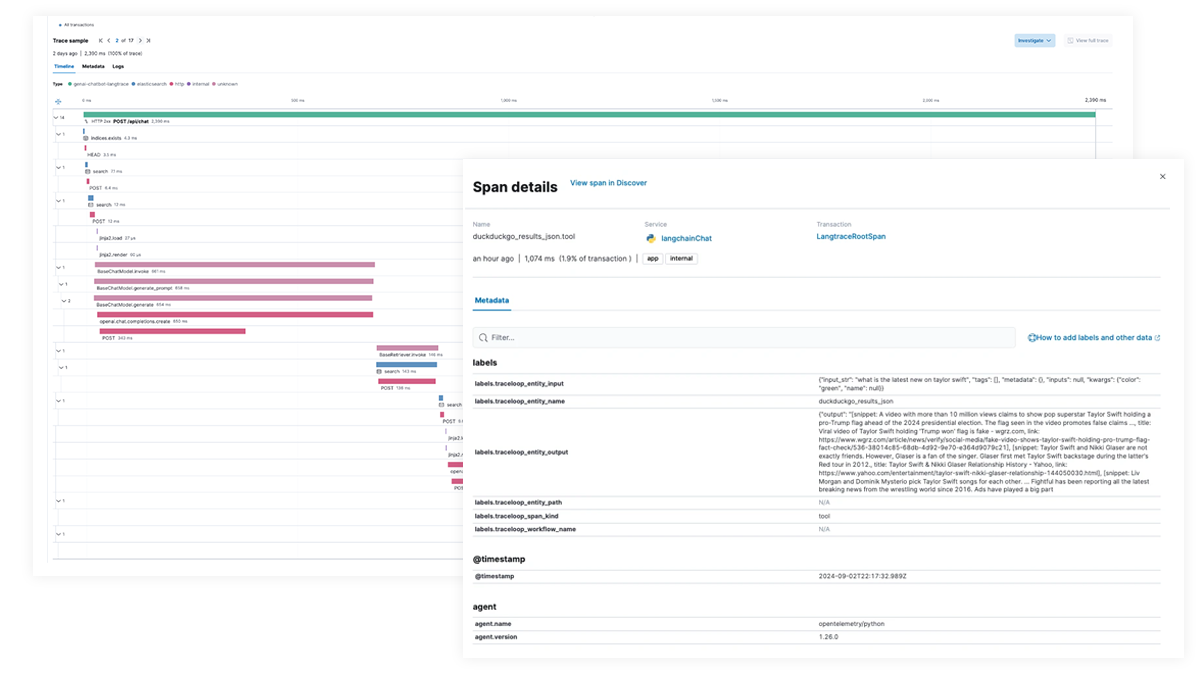
Get full visibility into each step of the LLM execution path for applications integrating generative AI capabilities. Enable deeper debugging with end-to-end tracing, service dependency mapping, and visibility into LangChain requests, failed LLM calls, and external service interactions. Quickly troubleshoot failures and latency spikes to ensure optimal performance.
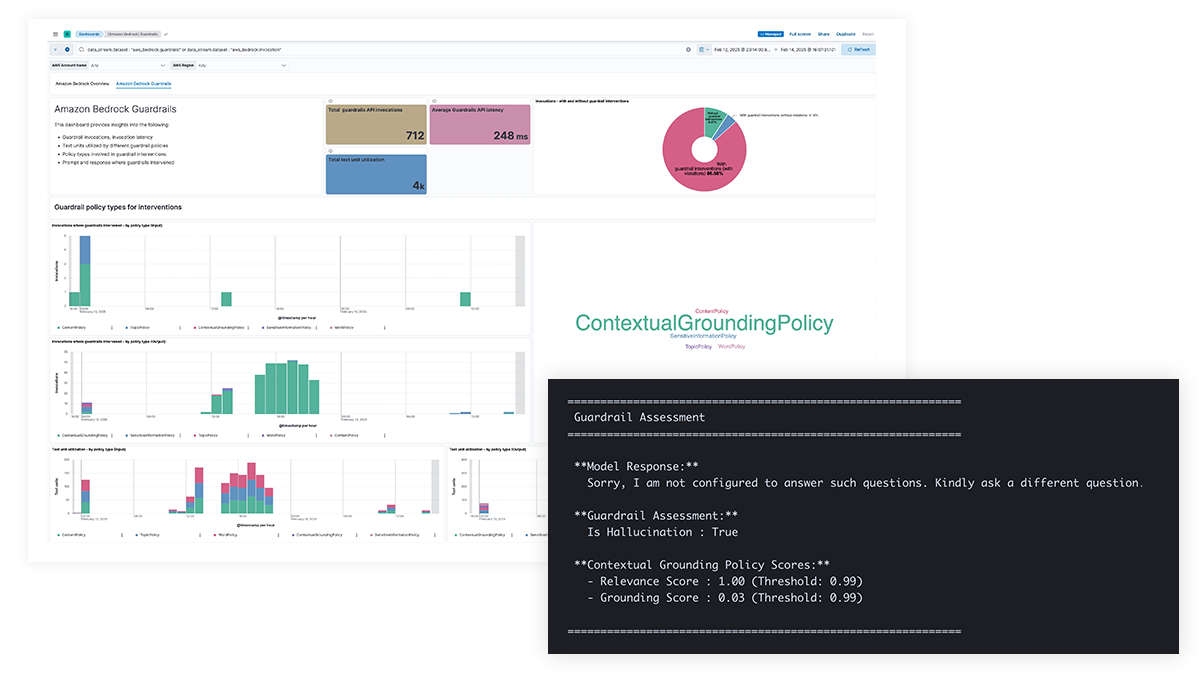
AI safety concerns? Get visibility into prompts and responses
Gain transparency into LLM prompts and responses to protect against data leaks of sensitive information, harmful or undesirable content, and ethical issues, as well as address factual errors, biases, and hallucinations. Support for Amazon Bedrock Guardrails and content filtering for Azure OpenAI enable policy-based interventions and provide contextual grounding to enhance model accuracy.
Trouble tracking costs? See usage breakdowns per model
Organizations need visibility into token usage, high cost queries and API calls, inefficient prompt structures, and other cost anomalies to optimize LLM spend. Elastic provides insights for multi-modal models, including text, video, and images, enabling teams to track and manage LLM costs effectively.

Get started with LLM observability
STEP 2: Instant dashboards — available out of the box in seconds
STEP 3: Create alerts — turn data into actions
Visibility for GenAI apps
Use Elastic to gain end-to-end insight into AI applications through third-party tracing libraries as well as out-of-the-box visibility into models hosted by all major LLM services.


LLM observability dashboard gallery
The OpenAI integration for Elastic Observability includes prebuilt dashboards and metrics so you can effectively track and monitor OpenAI model usage, including GPT-4o and DALL·E.
End-to-end tracing with EDOT and third-party libraries
Use Elastic APM to analyze and debug LangChain apps with OpenTelemetry. This can be supported with EDOT (Java, Python, Node.js) or third-party tracing libraries like LangTrace, OpenLIT, or OpenLLMetry.
Try the Elastic chatbot RAG app yourself! This sample app combines elasticsearch, LangChain, and various LLMs to power a chatbot with ELSER and your private data.
Go beyond LLM observability

APM

Digital experience monitoring

Log analytics

Infrastructure monitoring

AI Assistant

Tools consolidation

