Tutorial
Monitor OpenShift clusters with Metricbeat and Elasticsearch
Set up Metricbeat to monitor an OpenShift cluster and visualize metrics in Elasticsearch and Kibana.
On this page
Monitoring the performance and health of your applications and infrastructure is crucial for maintaining a reliable and efficient environment. Metricbeat, a lightweight shipper for metrics, can collect and send metrics to Elasticsearch for indexing and visualization in Kibana. This tutorial guides you through setting up Metricbeat to monitor your OpenShift cluster and send the data to Elasticsearch.
Prerequisites
Before you begin, ensure you have the following:
- OpenShift Cluster: A running OpenShift cluster where you have administrative access.
- Elasticsearch and Kibana: A running Elasticsearch cluster and a Kibana instance accessible from your OpenShift cluster. This can be hosted on-premises or in a cloud environment.
- kubectl and oc tools: Command-line tools installed and configured to interact with your OpenShift cluster.
Install Kube state metrics
Kube state metrics is a service that communicates with the OpenShift API server to retrieve details about all the API objects such as deployments, pods, daemonsets, and statefulsets. The Kube state metrics service exposes all the metrics on the /metrics URI.
Create the necessary resources to run a metrics deployment and other required objects.
oc apply -f - <<EOF apiVersion: rbac.authorization.k8s.io/v1 kind: ClusterRoleBinding metadata: labels: app.kubernetes.io/component: exporter app.kubernetes.io/name: kube-state-metrics app.kubernetes.io/version: 2.3.0 name: kube-state-metrics roleRef: apiGroup: rbac.authorization.k8s.io kind: ClusterRole name: kube-state-metrics subjects: - kind: ServiceAccount name: kube-state-metrics namespace: kube-system --- apiVersion: rbac.authorization.k8s.io/v1 kind: ClusterRole metadata: labels: app.kubernetes.io/component: exporter app.kubernetes.io/name: kube-state-metrics app.kubernetes.io/version: 2.3.0 name: kube-state-metrics rules: - apiGroups: - "" resources: - configmaps - secrets - nodes - pods - services - resourcequotas - replicationcontrollers - limitranges - persistentvolumeclaims - persistentvolumes - namespaces - endpoints verbs: - list - watch - apiGroups: - apps resources: - statefulsets - daemonsets - deployments - replicasets verbs: - list - watch - apiGroups: - batch resources: - cronjobs - jobs verbs: - list - watch - apiGroups: - autoscaling resources: - horizontalpodautoscalers verbs: - list - watch - apiGroups: - authentication.k8s.io resources: - tokenreviews verbs: - create - apiGroups: - authorization.k8s.io resources: - subjectaccessreviews verbs: - create - apiGroups: - policy resources: - poddisruptionbudgets verbs: - list - watch - apiGroups: - certificates.k8s.io resources: - certificatesigningrequests verbs: - list - watch - apiGroups: - storage.k8s.io resources: - storageclasses - volumeattachments verbs: - list - watch - apiGroups: - admissionregistration.k8s.io resources: - mutatingwebhookconfigurations - validatingwebhookconfigurations verbs: - list - watch - apiGroups: - networking.k8s.io resources: - networkpolicies - ingresses verbs: - list - watch - apiGroups: - coordination.k8s.io resources: - leases verbs: - list - watch --- apiVersion: apps/v1 kind: Deployment metadata: labels: app.kubernetes.io/component: exporter app.kubernetes.io/name: kube-state-metrics app.kubernetes.io/version: 2.3.0 name: kube-state-metrics namespace: kube-system spec: replicas: 1 selector: matchLabels: app.kubernetes.io/name: kube-state-metrics template: metadata: labels: app.kubernetes.io/component: exporter app.kubernetes.io/name: kube-state-metrics app.kubernetes.io/version: 2.3.0 spec: automountServiceAccountToken: true containers: - image: k8s.gcr.io/kube-state-metrics/kube-state-metrics:v2.3.0 livenessProbe: httpGet: path: /healthz port: 8080 initialDelaySeconds: 5 timeoutSeconds: 5 name: kube-state-metrics ports: - containerPort: 8080 name: http-metrics - containerPort: 8081 name: telemetry readinessProbe: httpGet: path: / port: 8081 initialDelaySeconds: 5 timeoutSeconds: 5 securityContext: allowPrivilegeEscalation: false readOnlyRootFilesystem: true runAsUser: 65534 nodeSelector: kubernetes.io/os: linux serviceAccountName: kube-state-metrics --- apiVersion: v1 automountServiceAccountToken: false kind: ServiceAccount metadata: labels: app.kubernetes.io/component: exporter app.kubernetes.io/name: kube-state-metrics app.kubernetes.io/version: 2.3.0 name: kube-state-metrics namespace: kube-system --- apiVersion: v1 kind: Service metadata: labels: app.kubernetes.io/component: exporter app.kubernetes.io/name: kube-state-metrics app.kubernetes.io/version: 2.3.0 name: kube-state-metrics namespace: kube-system spec: clusterIP: None ports: - name: http-metrics port: 8080 targetPort: http-metrics - name: telemetry port: 8081 targetPort: telemetry selector: app.kubernetes.io/name: kube-state-metrics EOFVerify that the kube-state-metrics pod is up and running.
oc get po -n kube-system -o wide | grep -i kube-state-metrics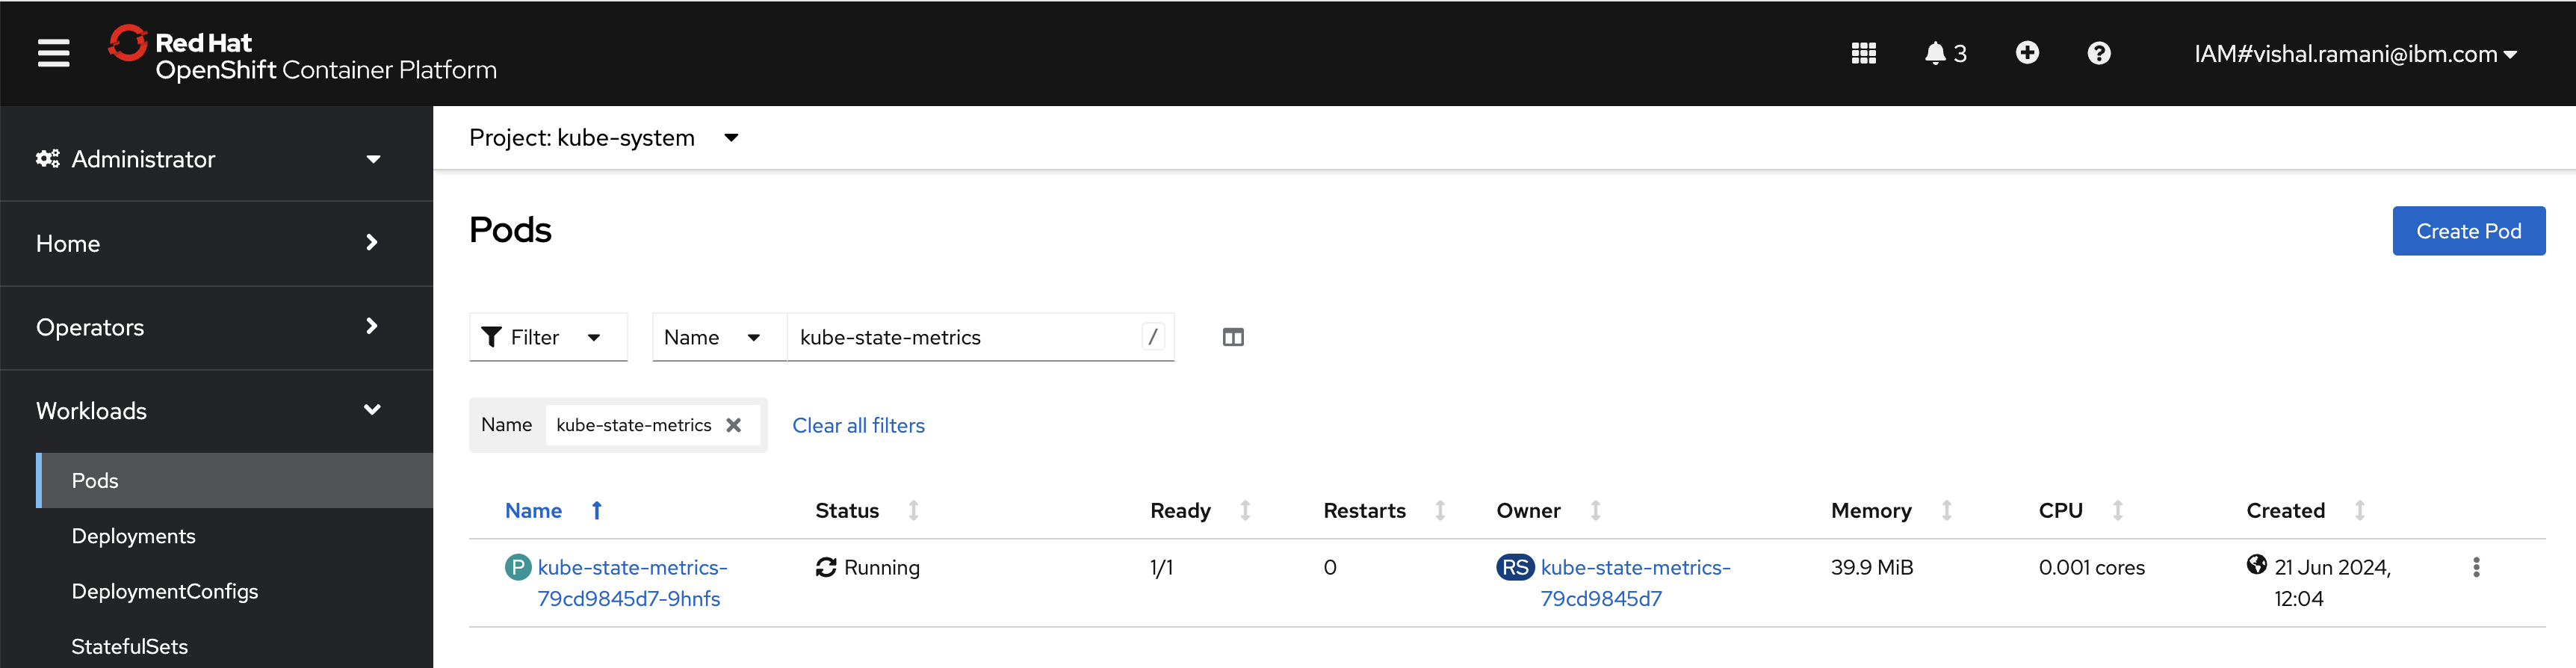
Install Metricbeat
Metricbeat will call the /metrics API and collect data every 10 seconds from the nodes’ processes. This data is sent to the indexes metricbeat-%{[agent.version]}. Kibana will read data from these indexes and prepare a dashboard visualization in the Observability window.
Install the Metricbeat DaemonSet and other required objects to gather data from each OpenShift node. Update the secrets to include the Elasticsearch and Kibana URLs, usernames, passwords, and ports before applying the YAML files.
oc apply -f - <<EOF apiVersion: v1 kind: Secret metadata: name: metricbeat-secret namespace: kube-system data: KIBANA_HOST: aHR0cHM6Ly9rYi1zYW1wbGUta2ItaHR0cC5lbGFzdGljLnN2Yy5jbHVzdGVyLmxvY2Fs # https://kb-sample-kb-http.elastic.svc.cluster.local KIBANA_PORT: NTYwMQ== #default port 5601 KIBANA_USERNAME: <add kibana username in base64 encoded format> #default username elastic KIBANA_PASSWORD: <add kibana password in base64 encoded format> ELASTICSEARCH_HOST: aHR0cHM6Ly9lcy1zYW1wbGUtZXMtaHR0cC5lbGFzdGljLnN2Yy5jbHVzdGVyLmxvY2Fs # https://es-sample-es-http.elastic.svc.cluster.local ELASTICSEARCH_PORT: OTIwMA== # default port 9200 ELASTICSEARCH_USERNAME: <add elasticsearch username in base64 encoded format> #default username elastic ELASTICSEARCH_PASSWORD: <add elasticsearch password in base64 encoded format> --- apiVersion: v1 kind: ConfigMap metadata: name: metricbeat-daemonset-config namespace: kube-system labels: k8s-app: metricbeat data: metricbeat.yml: |- metricbeat.config.modules: # Mounted `metricbeat-daemonset-modules` configmap: path: ${path.config}/modules.d/*.yml # Reload module configs as they change: reload.enabled: false setup.dashboards.enabled: true metricbeat.autodiscover: providers: - type: kubernetes scope: cluster node: ${NODE_NAME} # In large Kubernetes clusters consider setting unique to false # to avoid using the leader election strategy and # instead run a dedicated Metricbeat instance using a Deployment in addition to the DaemonSet unique: true templates: - config: - module: kubernetes hosts: ["kube-state-metrics:8080"] period: 10s add_metadata: true metricsets: - state_node - state_deployment - state_daemonset - state_replicaset - state_pod - state_container - state_job - state_cronjob - state_resourcequota - state_statefulset - state_service # If `https` is used to access `kube-state-metrics`, uncomment following settings: # bearer_token_file: /var/run/secrets/kubernetes.io/serviceaccount/token # ssl.certificate_authorities: # - /var/run/secrets/kubernetes.io/serviceaccount/service-ca.crt - module: kubernetes metricsets: - apiserver hosts: ["https://${KUBERNETES_SERVICE_HOST}:${KUBERNETES_SERVICE_PORT}"] bearer_token_file: /var/run/secrets/kubernetes.io/serviceaccount/token ssl.certificate_authorities: - /var/run/secrets/kubernetes.io/serviceaccount/ca.crt period: 30s # Uncomment this to get k8s events: #- module: kubernetes # metricsets: # - event # To enable hints based autodiscover uncomment this: #- type: kubernetes # node: ${NODE_NAME} # hints.enabled: true processors: - add_cloud_metadata: cloud.id: ${ELASTIC_CLOUD_ID} cloud.auth: ${ELASTIC_CLOUD_AUTH} output.elasticsearch: hosts: ['${ELASTICSEARCH_HOST:elasticsearch}:${ELASTICSEARCH_PORT:9200}'] username: ${ELASTICSEARCH_USERNAME} password: ${ELASTICSEARCH_PASSWORD} ssl.verification_mode: "none" setup.kibana: host: "${KIBANA_HOST}" username: ${KIBANA_USERNAME} password: ${KIBANA_PASSWORD} ssl.verification_mode: "none" --- apiVersion: v1 kind: ConfigMap metadata: name: metricbeat-daemonset-modules namespace: kube-system labels: k8s-app: metricbeat data: system.yml: |- - module: system period: 10s metricsets: - cpu - load - memory - network - process - process_summary #- core #- diskio #- socket processes: ['.*'] process.include_top_n: by_cpu: 5 # include top 5 processes by CPU by_memory: 5 # include top 5 processes by memory - module: system period: 1m metricsets: - filesystem - fsstat processors: - drop_event.when.regexp: system.filesystem.mount_point: '^/(sys|cgroup|proc|dev|etc|host|lib|snap)($|/)' kubernetes.yml: |- - module: kubernetes metricsets: - node - system - pod - container - volume period: 10s host: ${NODE_NAME} hosts: ["https://${NODE_NAME}:10250"] bearer_token_file: /var/run/secrets/kubernetes.io/serviceaccount/token ssl.verification_mode: "none" # If there is a CA bundle that contains the issuer of the certificate used in the Kubelet API, # remove ssl.verification_mode entry and use the CA, for instance: ssl.certificate_authorities: - /var/run/secrets/kubernetes.io/serviceaccount/service-ca.crt # - module: kubernetes # metricsets: # - proxy # period: 10s # host: ${NODE_NAME} # # hosts: ["localhost:10249"] # # If using Red Hat OpenShift should be used this `hosts` setting instead: # hosts: ["localhost:29101"] --- # Deploy a Metricbeat instance per node for node metrics retrieval apiVersion: apps/v1 kind: DaemonSet metadata: name: metricbeat namespace: kube-system labels: k8s-app: metricbeat spec: selector: matchLabels: k8s-app: metricbeat template: metadata: labels: k8s-app: metricbeat spec: serviceAccountName: metricbeat terminationGracePeriodSeconds: 30 hostNetwork: true dnsPolicy: ClusterFirstWithHostNet containers: - name: metricbeat image: docker.elastic.co/beats/metricbeat:8.2.0 args: [ "-c", "/etc/metricbeat.yml", "-e", "-system.hostfs=/hostfs", ] env: - name: KIBANA_HOST valueFrom: secretKeyRef: name: metricbeat-secret key: KIBANA_HOST - name: KIBANA_PORT valueFrom: secretKeyRef: name: metricbeat-secret key: KIBANA_PORT - name: KIBANA_USERNAME valueFrom: secretKeyRef: name: metricbeat-secret key: KIBANA_USERNAME - name: KIBANA_PASSWORD valueFrom: secretKeyRef: name: metricbeat-secret key: KIBANA_PASSWORD - name: ELASTICSEARCH_HOST valueFrom: secretKeyRef: name: metricbeat-secret key: ELASTICSEARCH_HOST - name: ELASTICSEARCH_PORT valueFrom: secretKeyRef: name: metricbeat-secret key: ELASTICSEARCH_PORT - name: ELASTICSEARCH_USERNAME valueFrom: secretKeyRef: name: metricbeat-secret key: ELASTICSEARCH_USERNAME - name: ELASTICSEARCH_PASSWORD valueFrom: secretKeyRef: name: metricbeat-secret key: ELASTICSEARCH_PASSWORD - name: NODE_NAME valueFrom: fieldRef: fieldPath: spec.nodeName securityContext: runAsUser: 0 resources: limits: memory: 200Mi requests: cpu: 100m memory: 100Mi volumeMounts: - name: config mountPath: /etc/metricbeat.yml readOnly: true subPath: metricbeat.yml - name: data mountPath: /usr/share/metricbeat/data - name: modules mountPath: /usr/share/metricbeat/modules.d readOnly: true - name: proc mountPath: /hostfs/proc readOnly: true - name: cgroup mountPath: /hostfs/sys/fs/cgroup readOnly: true volumes: - name: proc hostPath: path: /proc - name: cgroup hostPath: path: /sys/fs/cgroup - name: config configMap: defaultMode: 0640 name: metricbeat-daemonset-config - name: modules configMap: defaultMode: 0640 name: metricbeat-daemonset-modules - name: data hostPath: # When metricbeat runs as non-root user, this directory needs to be writable by group (g+w) path: /var/lib/metricbeat-data type: DirectoryOrCreate --- apiVersion: rbac.authorization.k8s.io/v1 kind: ClusterRoleBinding metadata: name: metricbeat subjects: - kind: ServiceAccount name: metricbeat namespace: kube-system roleRef: kind: ClusterRole name: metricbeat apiGroup: rbac.authorization.k8s.io --- apiVersion: rbac.authorization.k8s.io/v1 kind: RoleBinding metadata: name: metricbeat namespace: kube-system subjects: - kind: ServiceAccount name: metricbeat namespace: kube-system roleRef: kind: Role name: metricbeat apiGroup: rbac.authorization.k8s.io --- apiVersion: rbac.authorization.k8s.io/v1 kind: RoleBinding metadata: name: metricbeat-kubeadm-config namespace: kube-system subjects: - kind: ServiceAccount name: metricbeat namespace: kube-system roleRef: kind: Role name: metricbeat-kubeadm-config apiGroup: rbac.authorization.k8s.io --- apiVersion: rbac.authorization.k8s.io/v1 kind: ClusterRole metadata: name: metricbeat labels: k8s-app: metricbeat rules: - apiGroups: [""] resources: - nodes - namespaces - events - pods - services verbs: ["get", "list", "watch"] # Enable this rule only if planing to use Kubernetes keystore #- apiGroups: [""] # resources: # - secrets # verbs: ["get"] - apiGroups: ["extensions"] resources: - replicasets verbs: ["get", "list", "watch"] - apiGroups: ["apps"] resources: - statefulsets - deployments - replicasets verbs: ["get", "list", "watch"] - apiGroups: ["batch"] resources: - jobs - cronjobs verbs: ["get", "list", "watch"] - apiGroups: - "" resources: - nodes/stats verbs: - get - nonResourceURLs: - "/metrics" verbs: - get --- apiVersion: rbac.authorization.k8s.io/v1 kind: Role metadata: name: metricbeat # should be the namespace where metricbeat is running namespace: kube-system labels: k8s-app: metricbeat rules: - apiGroups: - coordination.k8s.io resources: - leases verbs: ["get", "create", "update"] --- apiVersion: rbac.authorization.k8s.io/v1 kind: Role metadata: name: metricbeat-kubeadm-config namespace: kube-system labels: k8s-app: metricbeat rules: - apiGroups: [""] resources: - configmaps resourceNames: - kubeadm-config verbs: ["get"] --- apiVersion: v1 kind: ServiceAccount metadata: name: metricbeat namespace: kube-system labels: k8s-app: metricbeat --- EOFVerify that Metricbeat has started successfully.
oc logs -n kube-system -l k8s-app=metricbeat --all-containers=true | grep 'message":"Non-zero metrics in the last 30s'If you find a string similar to the following example, the Metricbeat agent is sending data to Elasticsearch.
{"log.level":"info","@timestamp":"2024-06-04T11:18:08.753Z","log.logger":"monitoring","log.origin":{"file.name":"log/log.go","file.line":184},"message":"Non-zero metrics in the last 30s","service.name":"metricbeat","monitoring":{"metrics":{"beat":{"cgroup":{"cpuacct":{"total":{"ns":962572304}},"memory":{"mem":{"usage":{"bytes":-126976}}}},"cpu":{"system":{"ticks":12060,"time":{"ms":360}},"total":{"ticks":30230,"time":{"ms":960},"value":0},"user":{"ticks":18170,"time":{"ms":600}}},"handles":{"limit":{"hard":1048576,"soft":1048576},"open":16},"info":{"ephemeral_id":"96aa05d8-3069-44e3-a633-e602209a7fc3","uptime":{"ms":993100},"version":"8.2.0"},"memstats":{"gc_next":39817168,"memory_alloc":22353808,"memory_total":3042905128,"rss":206553088},"runtime":{"goroutines":210}},"libbeat":{"config":{"module":{"running":3}},"output":{"events":{"acked":1023,"active":0,"batches":21,"total":1023},"read":{"bytes":229485},"write":{"bytes":1940266}},"pipeline":{"clients":13,"events":{"active":0,"published":1023,"total":1023},"queue":{"acked":1023}}},"metricbeat":{"kubernetes":{"container":{"events":213,"success":213},"node":{"events":3,"success":3},"pod":{"events":141,"success":141},"system":{"events":9,"success":9},"volume":{"events":525,"success":525}},"system":{"cpu":{"events":3,"success":3},"load":{"events":3,"success":3},"memory":{"events":3,"success":3},"network":{"events":120,"success":120},"process_summary":{"events":3,"success":3}}},"system":{"load":{"1":0.39,"15":2.64,"5":0.81,"norm":{"1":0.0122,"15":0.0825,"5":0.0253}}}},"ecs.version":"1.6.0"}}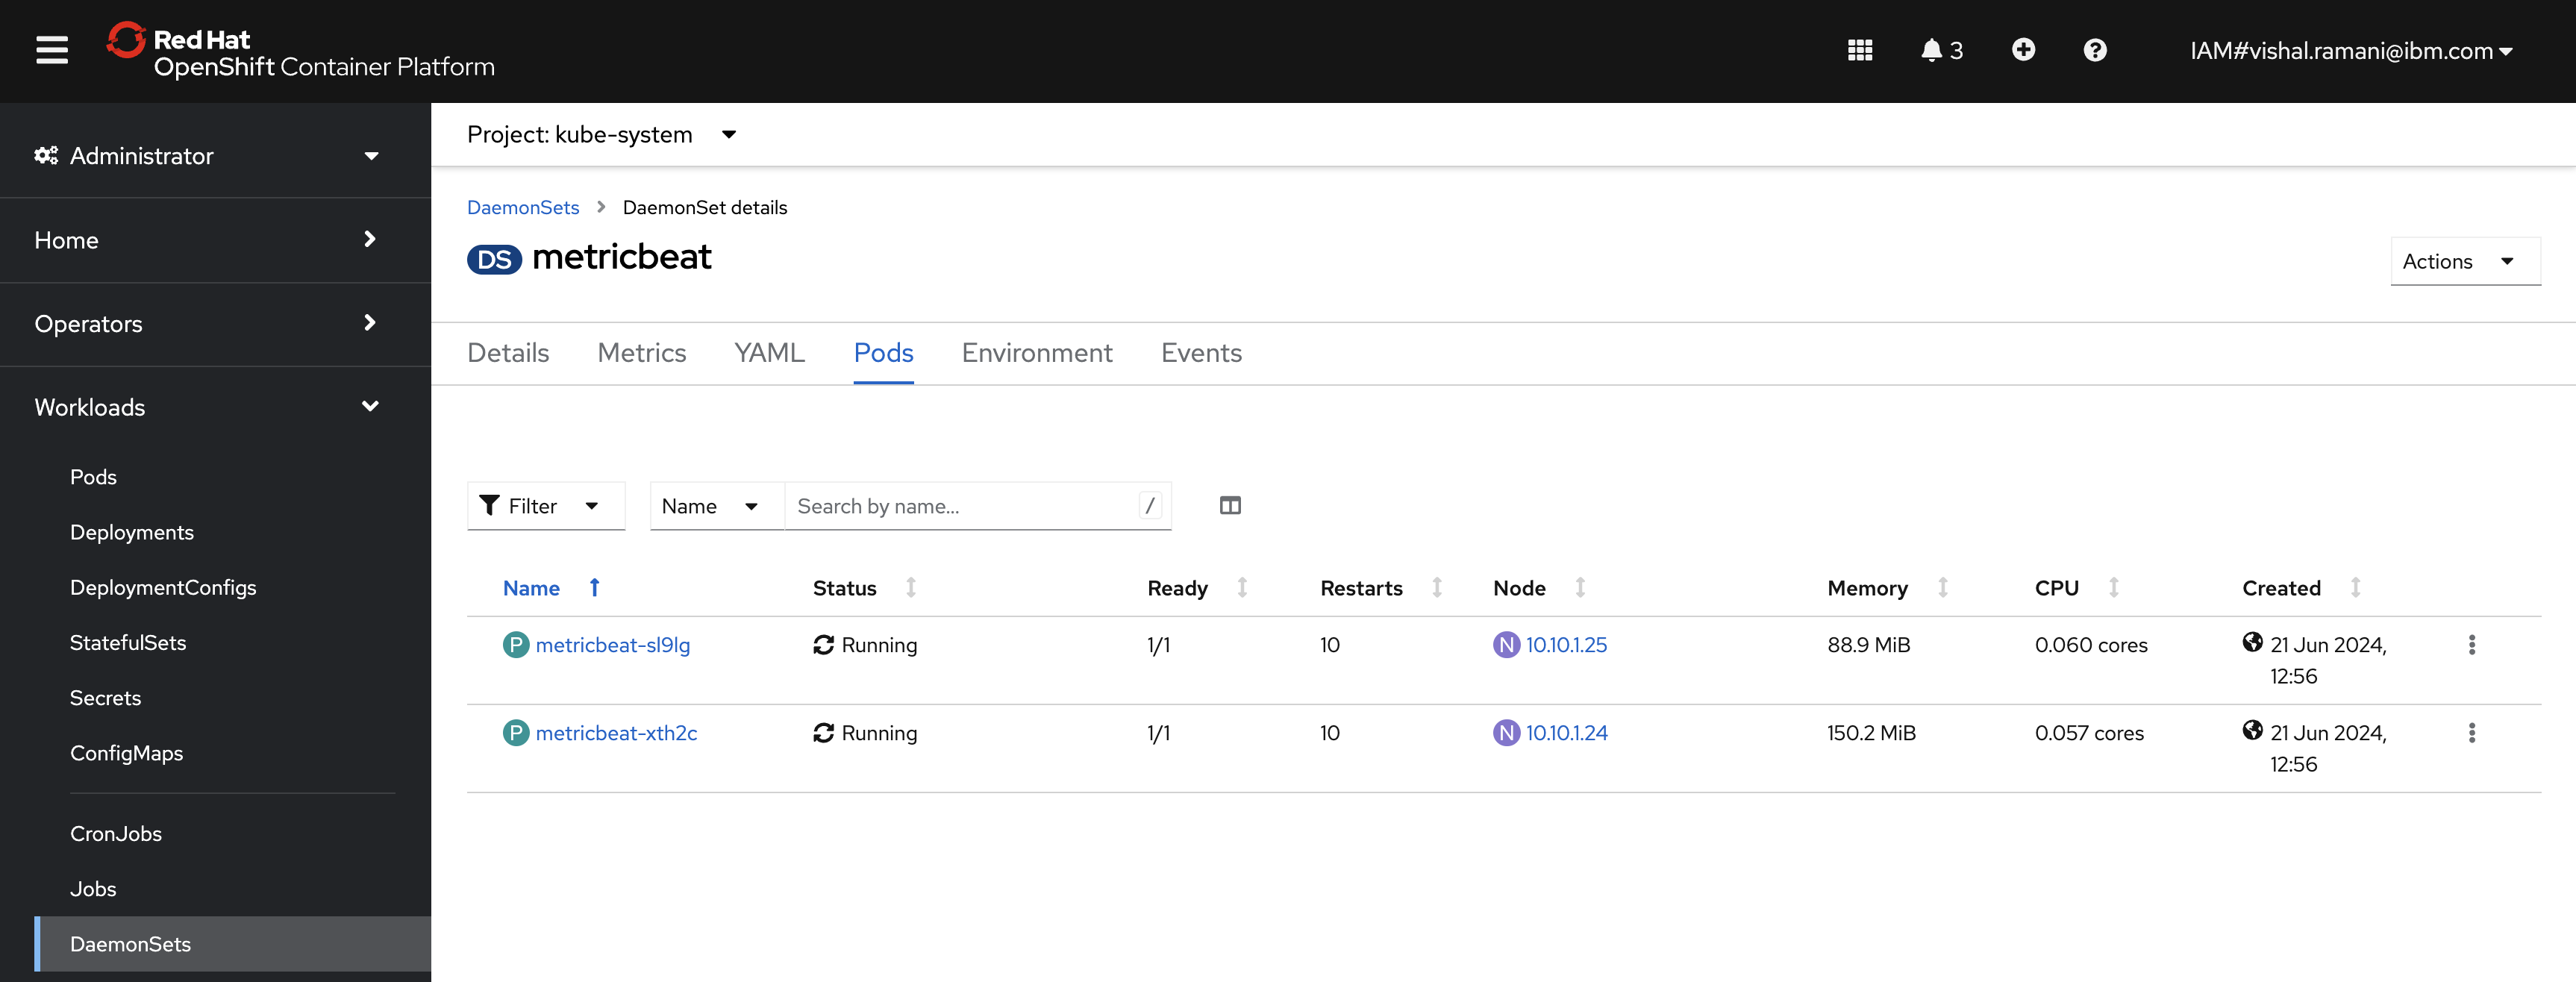
Visualize metrics in Elasticsearch
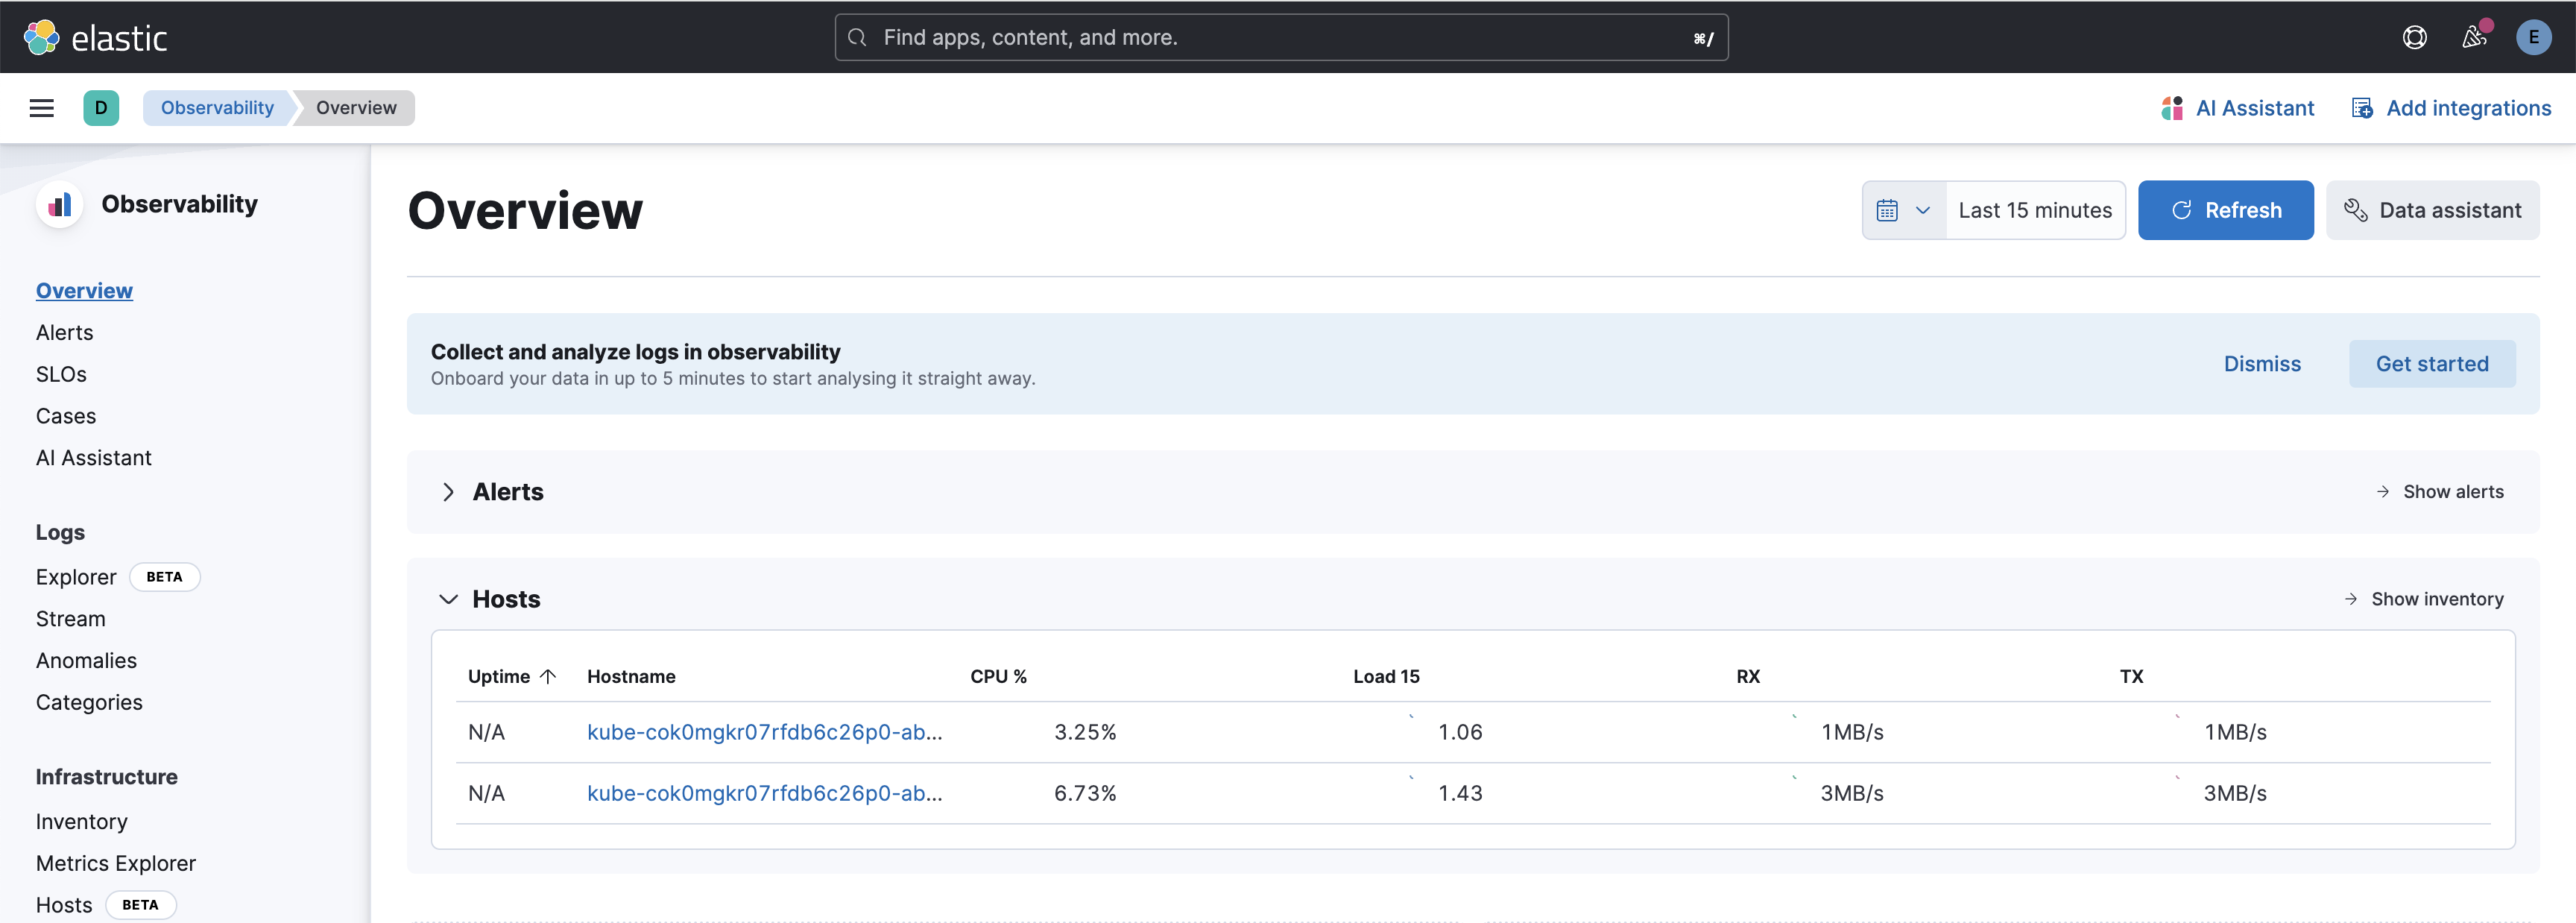
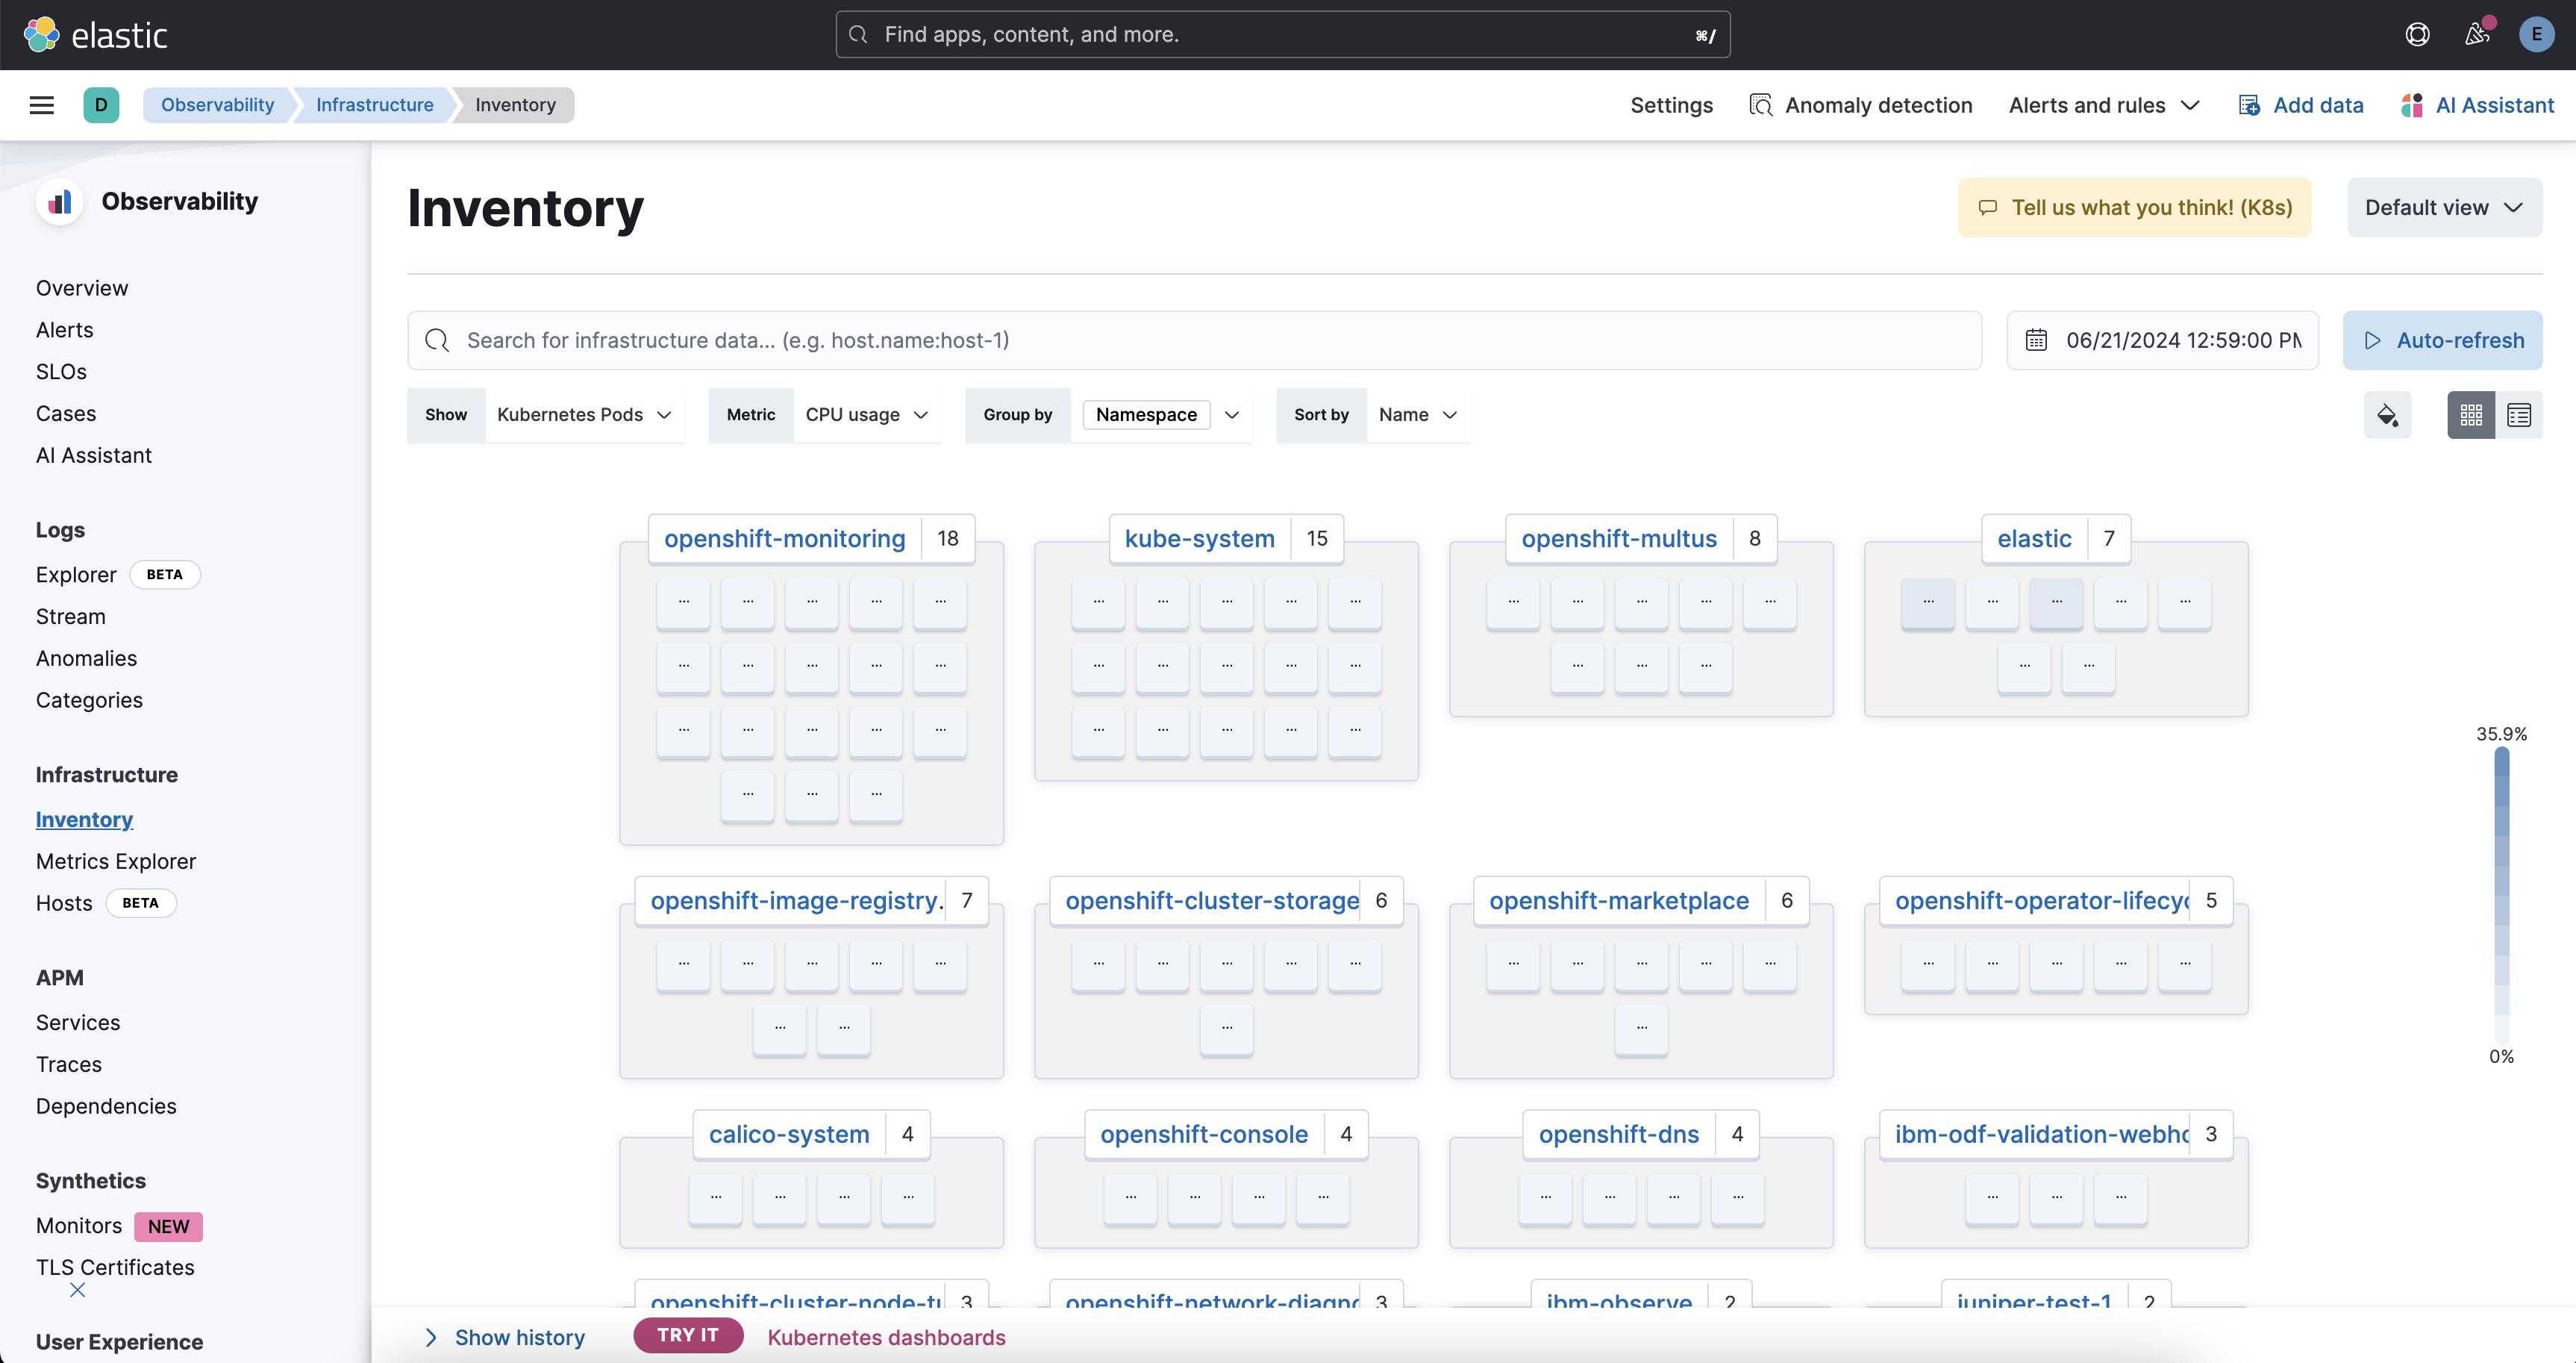
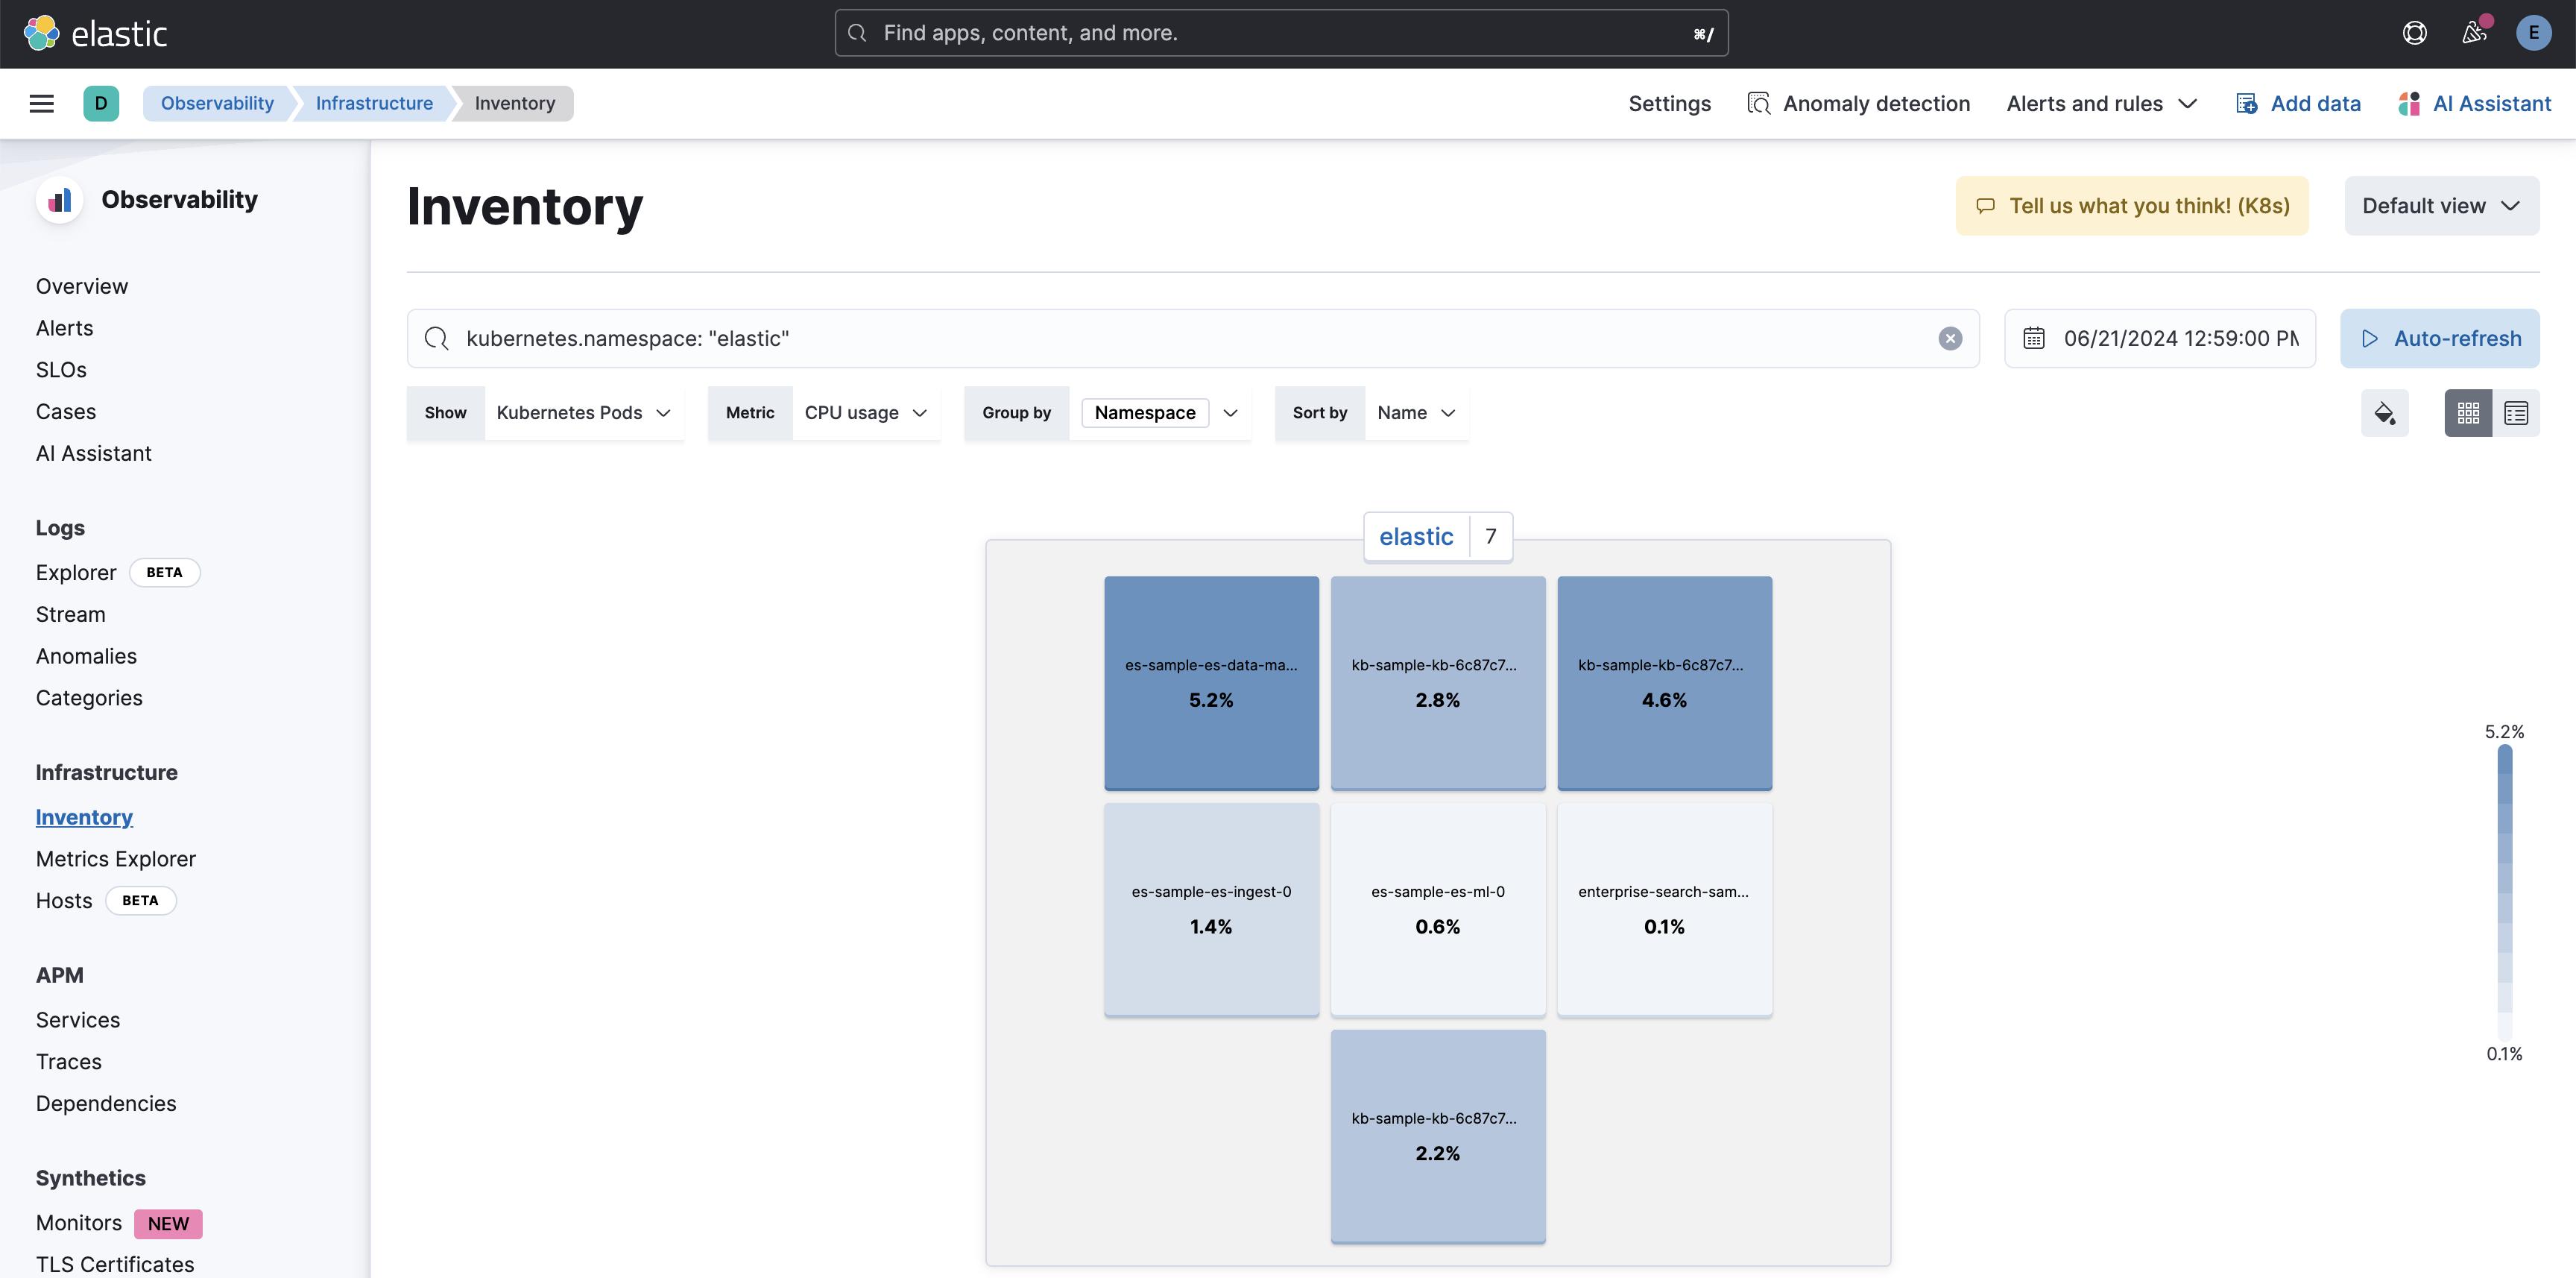
Finally, you can visualize all the infrastructure metrics in the Elasticsearch Observability menu.
Inventory: Inventory observability in Elasticsearch involves monitoring and analyzing the state and performance of various components within your Elasticsearch cluster. This includes tracking metrics such as pod health, node health, and resource utilization to ensure efficient operation and quick identification of issues. By leveraging observability tools, you can gain real-time insights and maintain the optimal performance of your Elasticsearch environment.
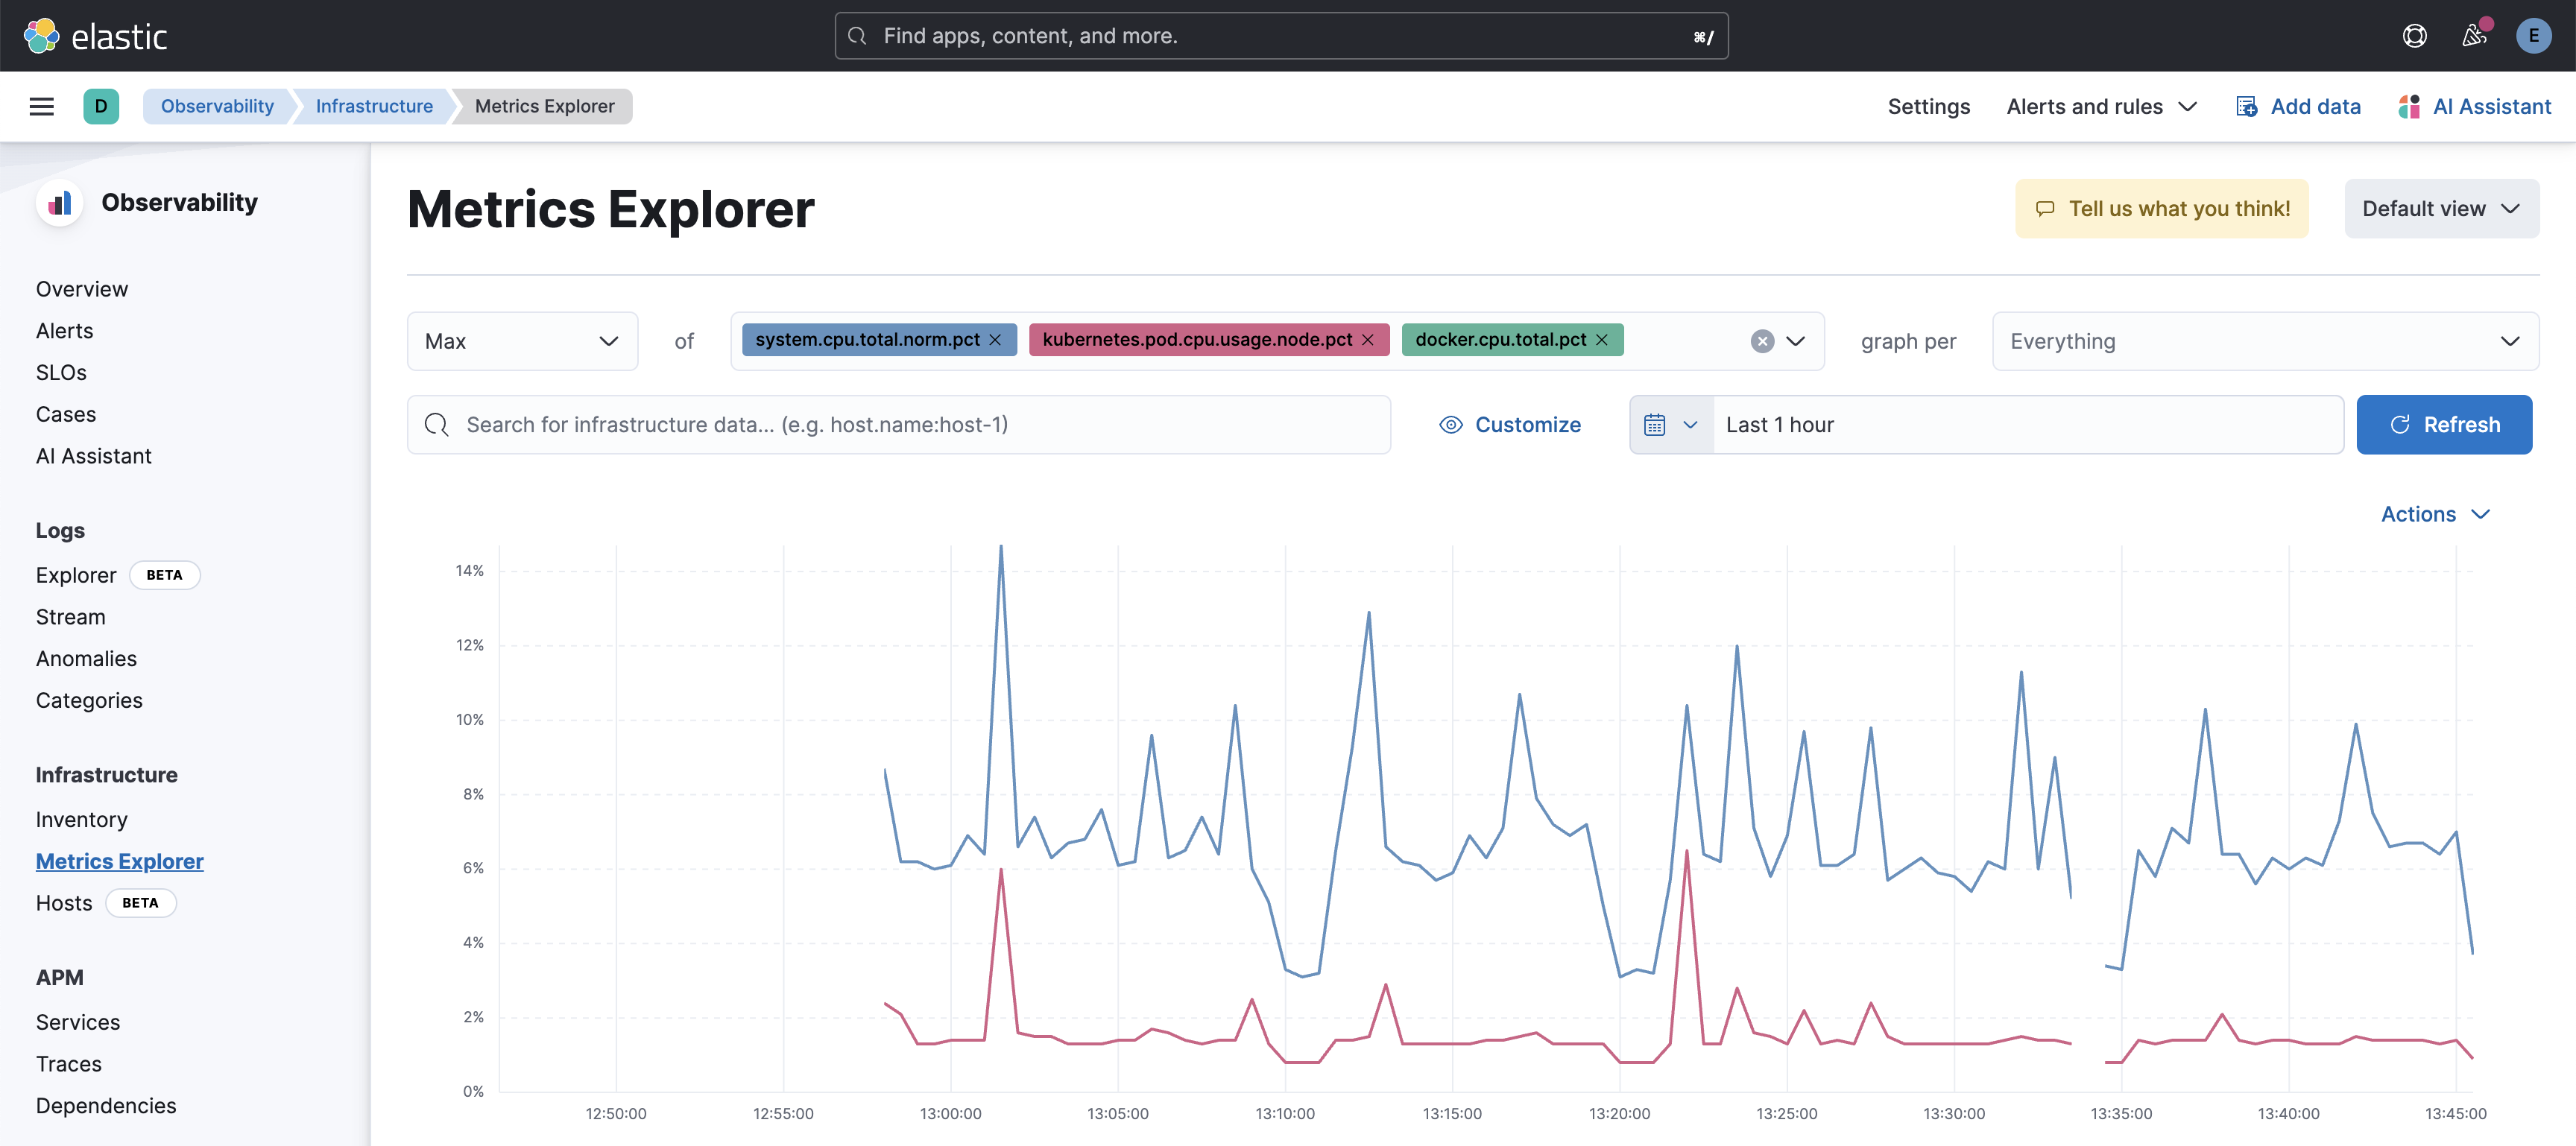
Metrics Explorer: Metrics Explorer in Elasticsearch is a powerful tool for visualizing and analyzing time-series data. It allows users to explore and monitor metrics from various data sources, providing insights through visualizations like line charts, bar charts, and more. This enables quick identification of trends, anomalies, and performance issues.
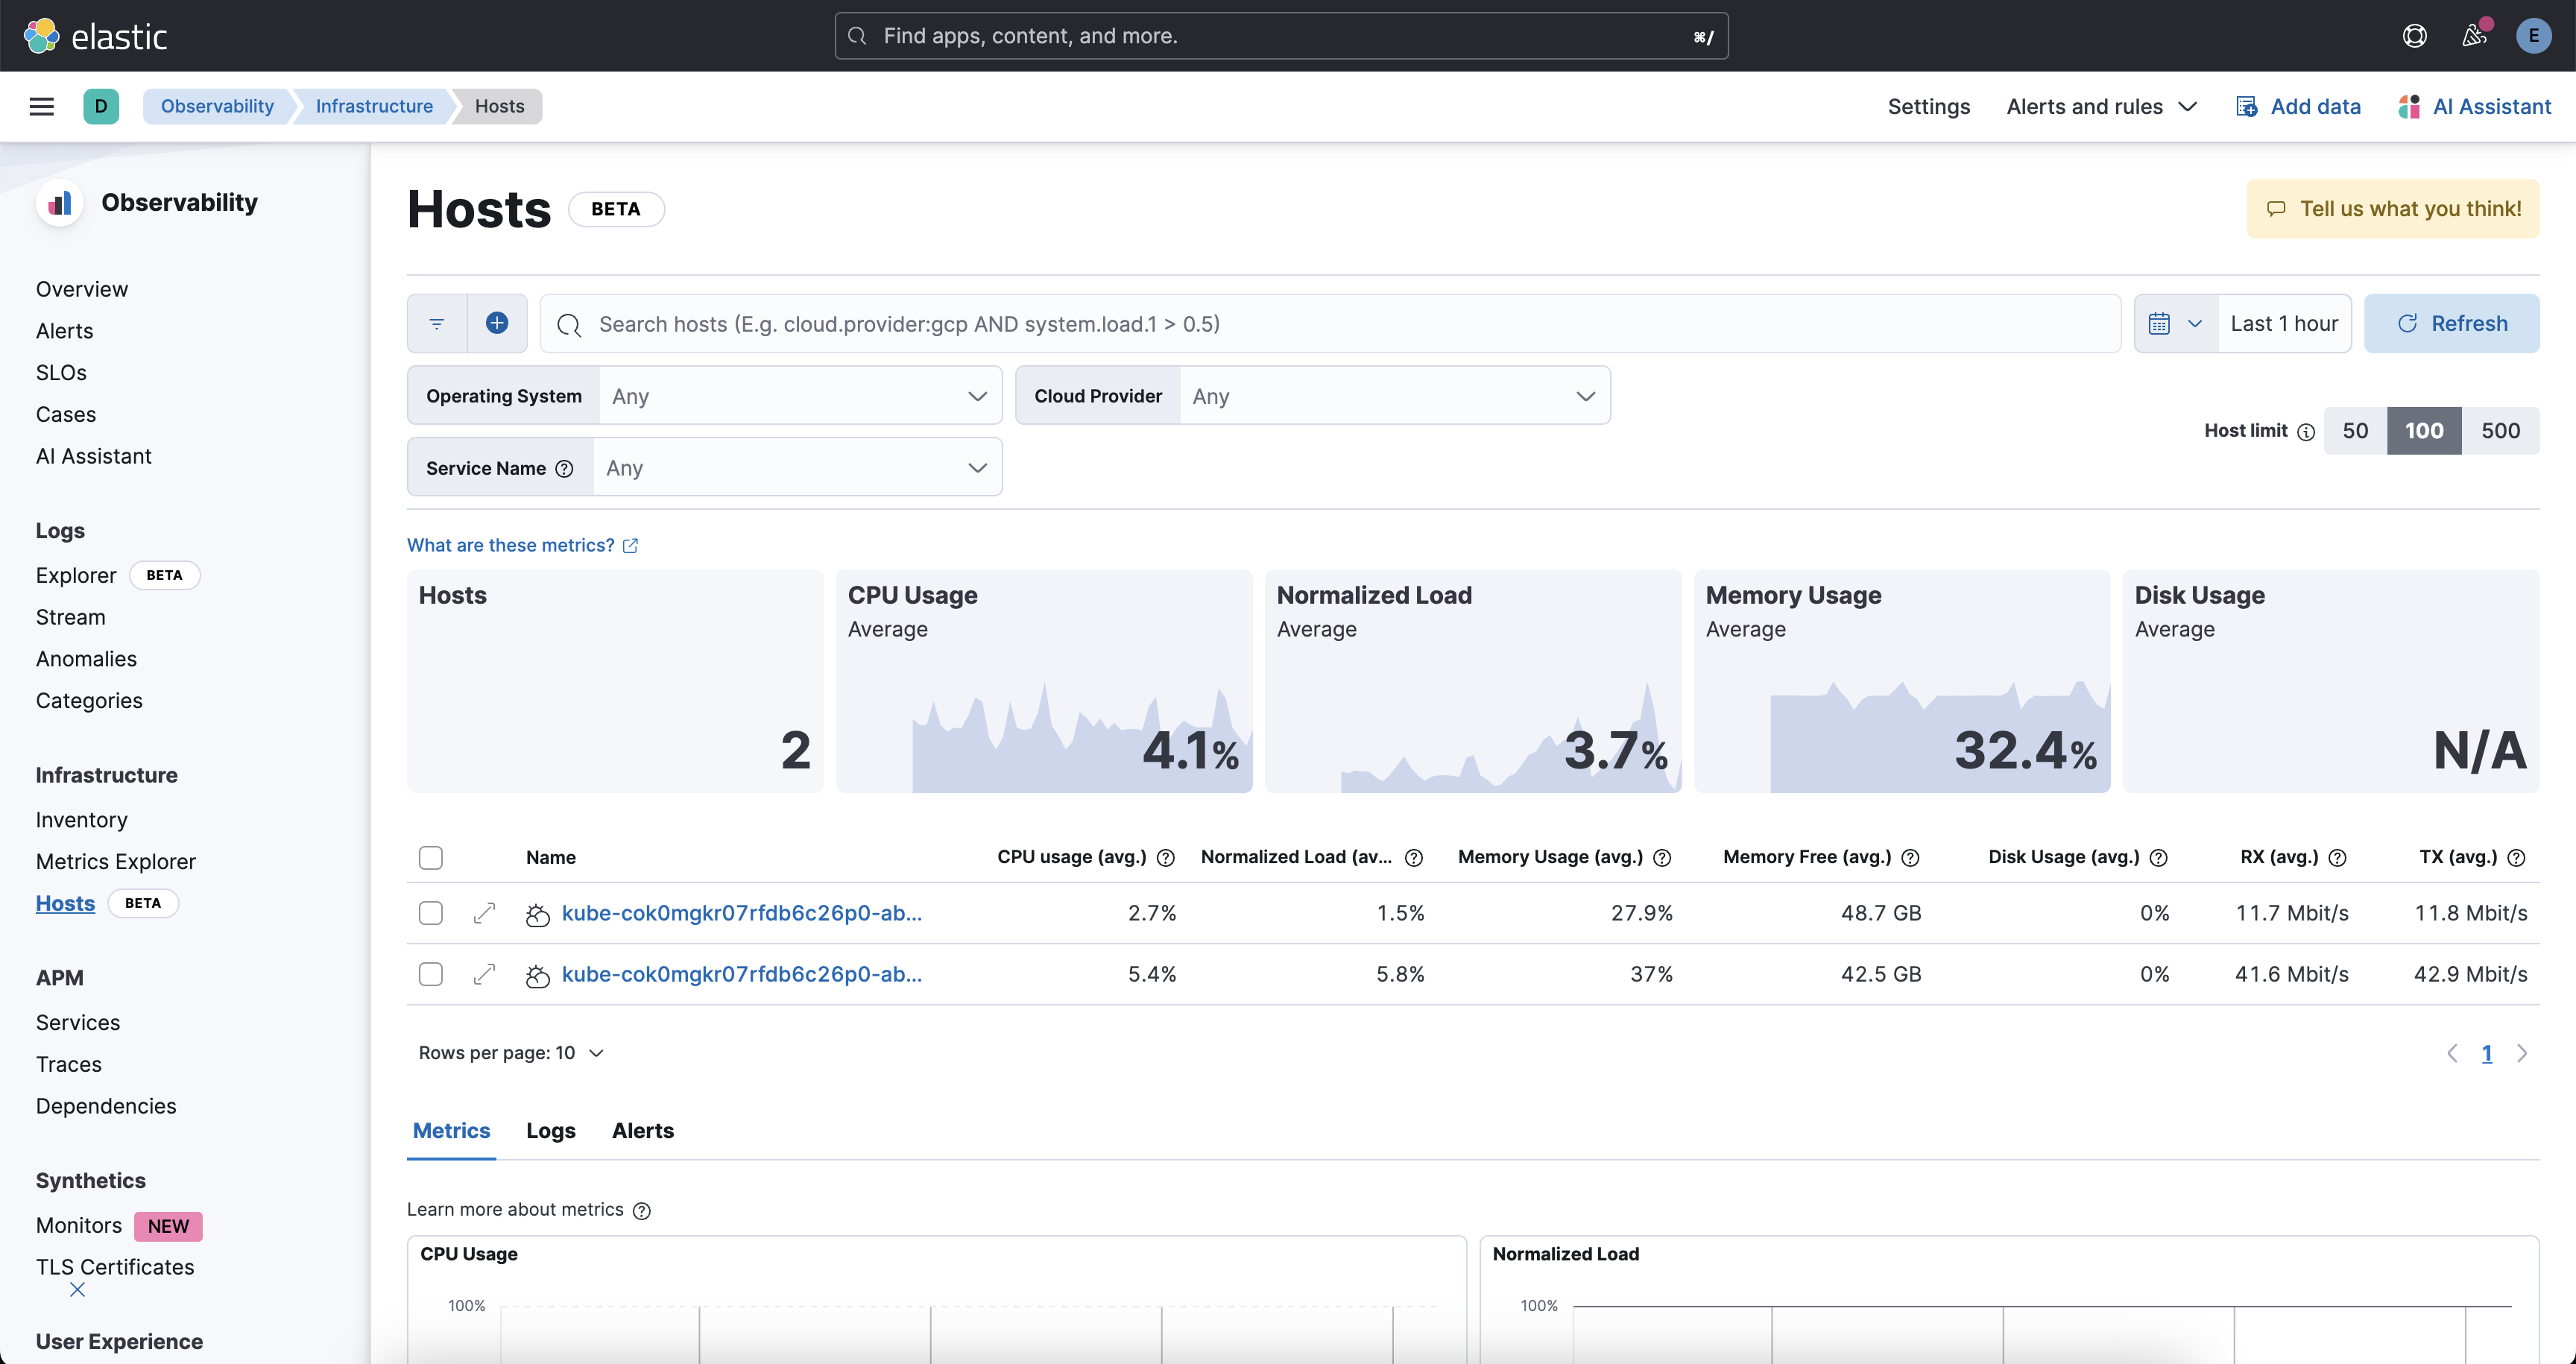
Hosts: Host observability in Elasticsearch involves collecting, indexing, and analyzing logs, metrics, and traces from your infrastructure and applications. This enables real-time monitoring, troubleshooting, and insights into system performance and health.
Conclusion
Setting up Metricbeat monitoring in Elasticsearch on an OpenShift cluster provides a robust solution for collecting, visualizing, and analyzing infrastructure metrics. By following the steps outlined in this tutorial, you can efficiently deploy Kube state metrics and Metricbeat to gather comprehensive data from your OpenShift environment. This setup enables real-time monitoring and observability, allowing you to track the health and performance of your cluster components through Elasticsearch and Kibana dashboards.
The integration of Metricbeat with Elasticsearch and Kibana offers powerful insights into the state of your infrastructure, enhancing your ability to identify and resolve issues promptly. With features like Inventory, Metrics Explorer, and Hosts observability, you gain a holistic view of your system’s performance and resource utilization. This comprehensive monitoring setup helps maintain the optimal performance of your OpenShift cluster and supports proactive management and troubleshooting, ensuring a reliable and efficient infrastructure.
By leveraging the capabilities of Metricbeat and Elasticsearch, you can transform raw data into actionable insights, ultimately driving better decision-making and operational excellence in your Kubernetes and OpenShift environments.