Article
Introduction to IBM Watson Studio
Learn the basics of IBM Watson Studio and machine learning services
On this page
Data science methodology
IBM has defined a lightweight IBM Cloud Garage Method that includes a process model to map individual technology components to the reference architecture. This method does not include any requirement engineering or design thinking tasks. Because it can be hard to initially define the architecture of a project, this method supports architectural changes during the process model.
Each stage plays a vital role in the context of the overall methodology. At a certain level of abstraction, it can be seen as a refinement of the workflow outlined by the CRISP-DM method for data mining.
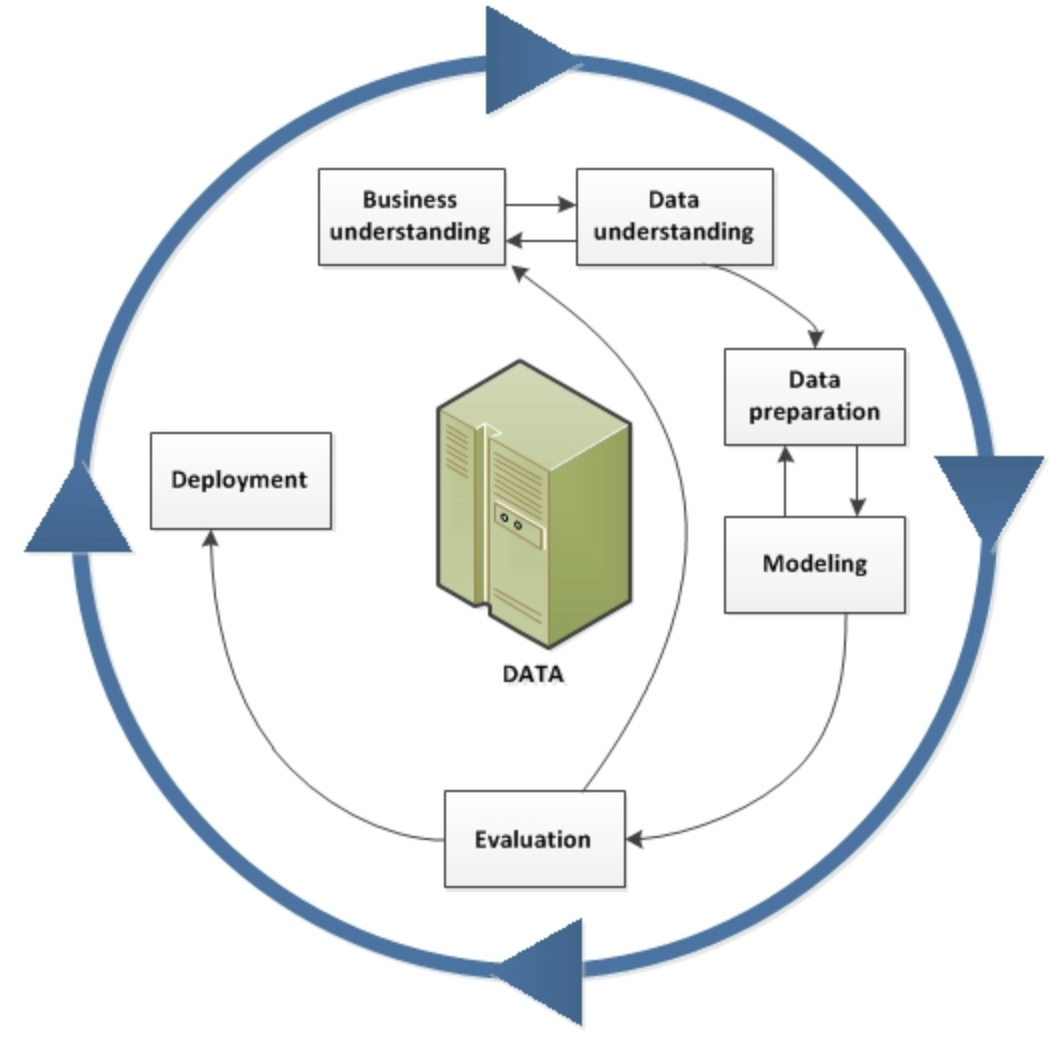
According to both methodologies, every project starts with Business understanding, where the problem and objectives are defined. This is followed in the IBM Data Science Method by the Analytical approach phase, where the data scientist can define the approach to solving the problem. The IBM Data Science Method then continues with three phases called Data requirements, Data collection, and Data understanding, which in CRISP-DM are presented by a single Data understanding phase.
After the data scientist has an understanding of the data and has sufficient data to get started, they move to the Data preparation phase. This phase is usually very time-consuming. A data scientist spends about 80% of their time in this phase, performing tasks such as data cleansing and feature engineering. The term "data wrangling" is often used in this context. During and after cleansing the data, the data scientist generally performs exploration, such as descriptive statistics to get an overall feel for the data, and clustering to look at the relationships and latent structure of the data. This process is often iterated several times until the data scientist is satisfied with their data set.
The model training stage is where machine learning is used in building a predictive model. The model is trained and then evaluated by statistical measures such as prediction accuracy, sensitivity, and specificity. After the model is deemed sufficient, it is deployed and used for scoring on unseen data. The IBM Data Science Methodology adds an additional Feedback stage for obtaining feedback from using the model, which is then used to improve the model. Both methods are highly iterative by nature.
IBM Watson Studio
IBM Watson Studio gives you the environment and tools to solve business problems by collaboratively working with data. You can choose the tools needed to analyze and visualize data; to cleanse and shape the data; to ingest streaming data; or to create, train, and deploy machine learning models.
With IBM Watson Studio, you can:
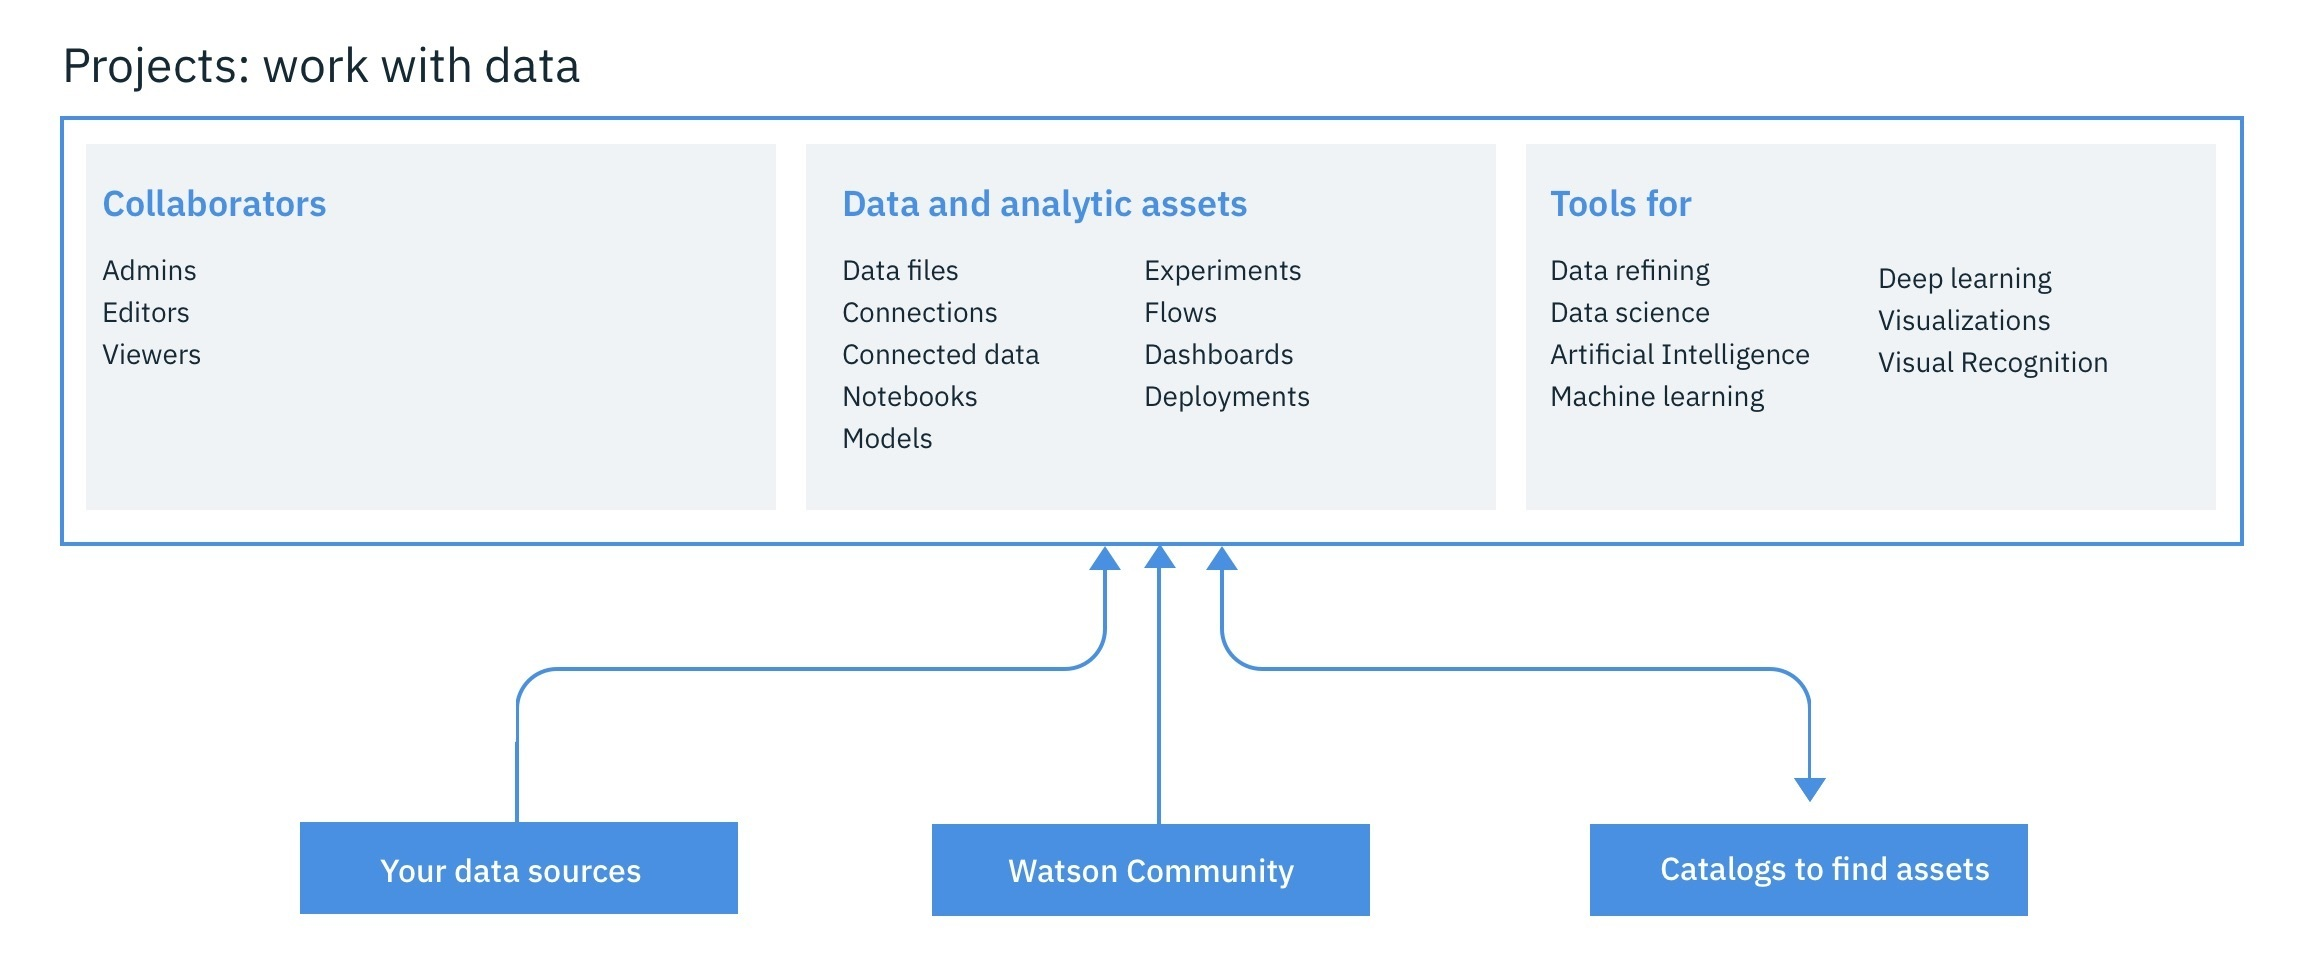
Create projects to organize the resources (such as data connections, data assets, collaborators, and notebooks) to achieve an analytics goal.
Access data from connections to your cloud or on-premises data sources.
Upload files to the project’s object storage.
Create and maintain data catalogs to discover, index, and share data.
Refine data by cleansing and shaping the data to prepare it for analysis.
Perform data science tasks by creating Jupyter Notebooks for Python or Scala to run code that processes data and then view the results inline. Alternavitely, you can use RStudio for R.
Create, test, and deploy machine learning and deep learning models.
Visualize your data.
Technically, IBM Watson Studio is based on a variety of open source technologies and IBM products, as shown in the following figure.
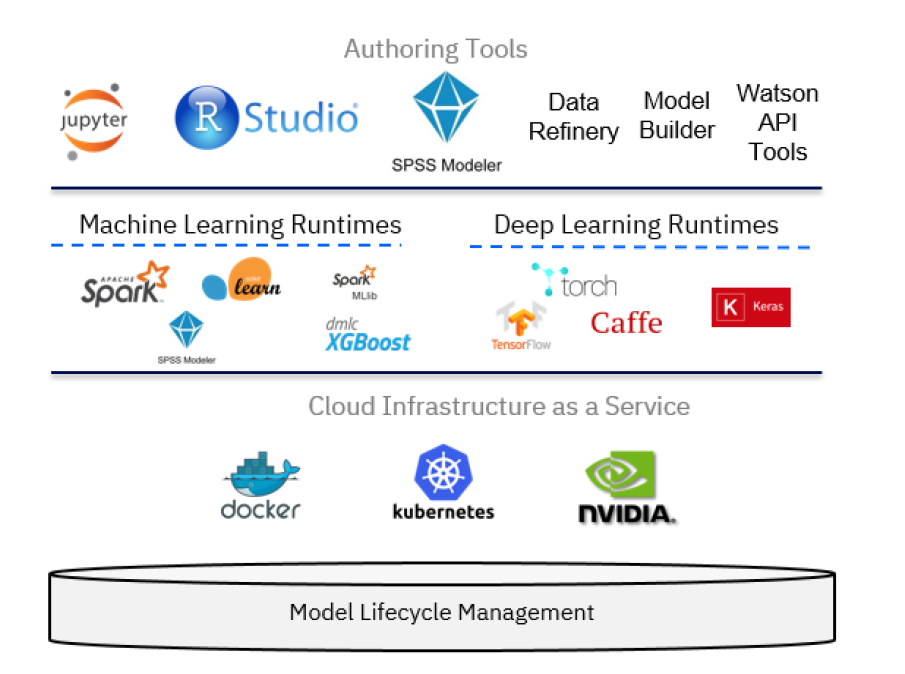
In the context of data science, IBM Watson Studio can be viewed as an integrated, multirole collaboration platform that supports the developer, data engineer, business analyst, and the data scientist in the process of solving a data science problem. For the developer role, other components of the IBM Cloud platform might be relevant as well in building applications that use machine learning services. However, the data scientist can build machine learning models using a variety of tools, ranging from:
- AutoAI Model Builder: A graphical tool requiring no programming skills
- SPSS Modeler Flows: Adopts a diagrammatic style
- RStudio and Jupyter Notebooks: Using a programmatic style
For additional background, take a look at an extensive list of "how-to" videos that are available for IBM Watson Studio.
IBM Watson Machine Learning service
A key component of IBM Watson Studio is the IBM Watson Machine Learning service and its set of REST APIs that can be called from any programming language to interact with a machine learning model. The focus of the IBM Watson Machine Learning service is deployment, but you can use IBM SPSS Modeler or IBM Watson Studio to author and work with models and pipelines. Both SPSS Modeler and IBM Watson Studio use Spark MLlib and Python scikit-learn and offer various modeling methods that are taken from machine learning, artificial intelligence, and statistics.
Use the following links to get more detailed information on Watson Machine Learning:
Summary
This article provided background information on the IBM Data Science Methodology, what role IBM Watson Studio can play, and a preview of what will be covered in this learning path.
One objective of this learning path is to show how IBM Watson Studio offers, in addition to Jupyter Notebooks for Python, Scala, or R, alternative ways of going through a similar process that might be faster and can be achieved without programming skills. In essence, these mechanisms are SPSS Modeler Flow, which allows a data scientist to create a model purely graphically by defining a flow, and the IBM AutoAI graphical tool inside IBM Watson Studio, which goes one step beyond SPSS by providing a semi-automatic approach to creation, evaluation, deployment, and testing of a machine learning model. At the same time, the learning path shows how IBM Watson Studio provides capabilities out of the box for profiling, visualizing, and transforming the data, again without any programming required.