

Search, analyze, and act with log analytics
Logs record everything and are the richest source of context. Open and OpenTelemetry‑native, Elastic cuts through the noise — turning messy, unstructured logs into operational answers.
From raw logs to real answers
Logs tell you what happened. Elastic helps you understand why.

Bring your data. We'll do the rest.
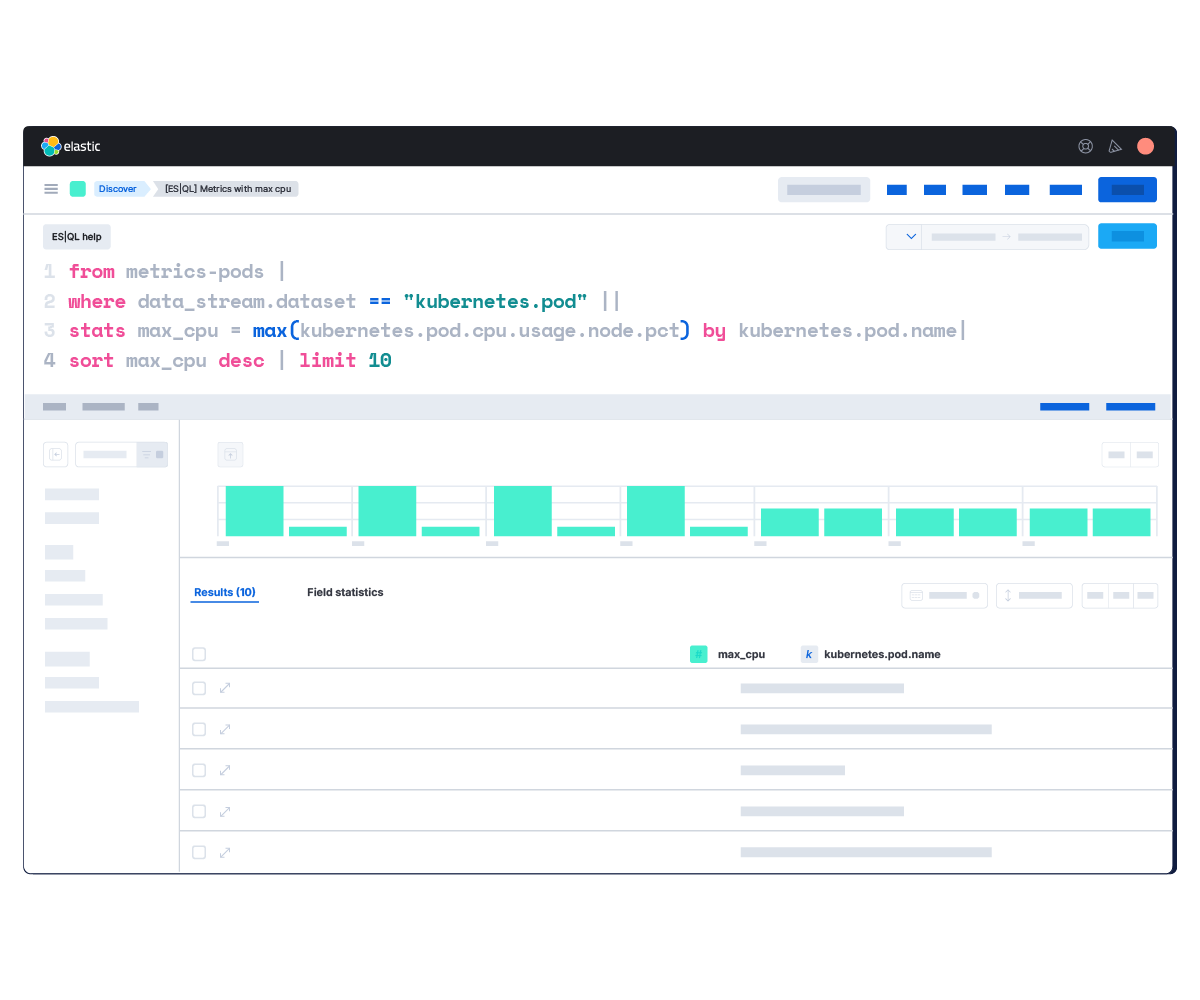
STEP 2: Query and analyze any data — structured or unstructured.
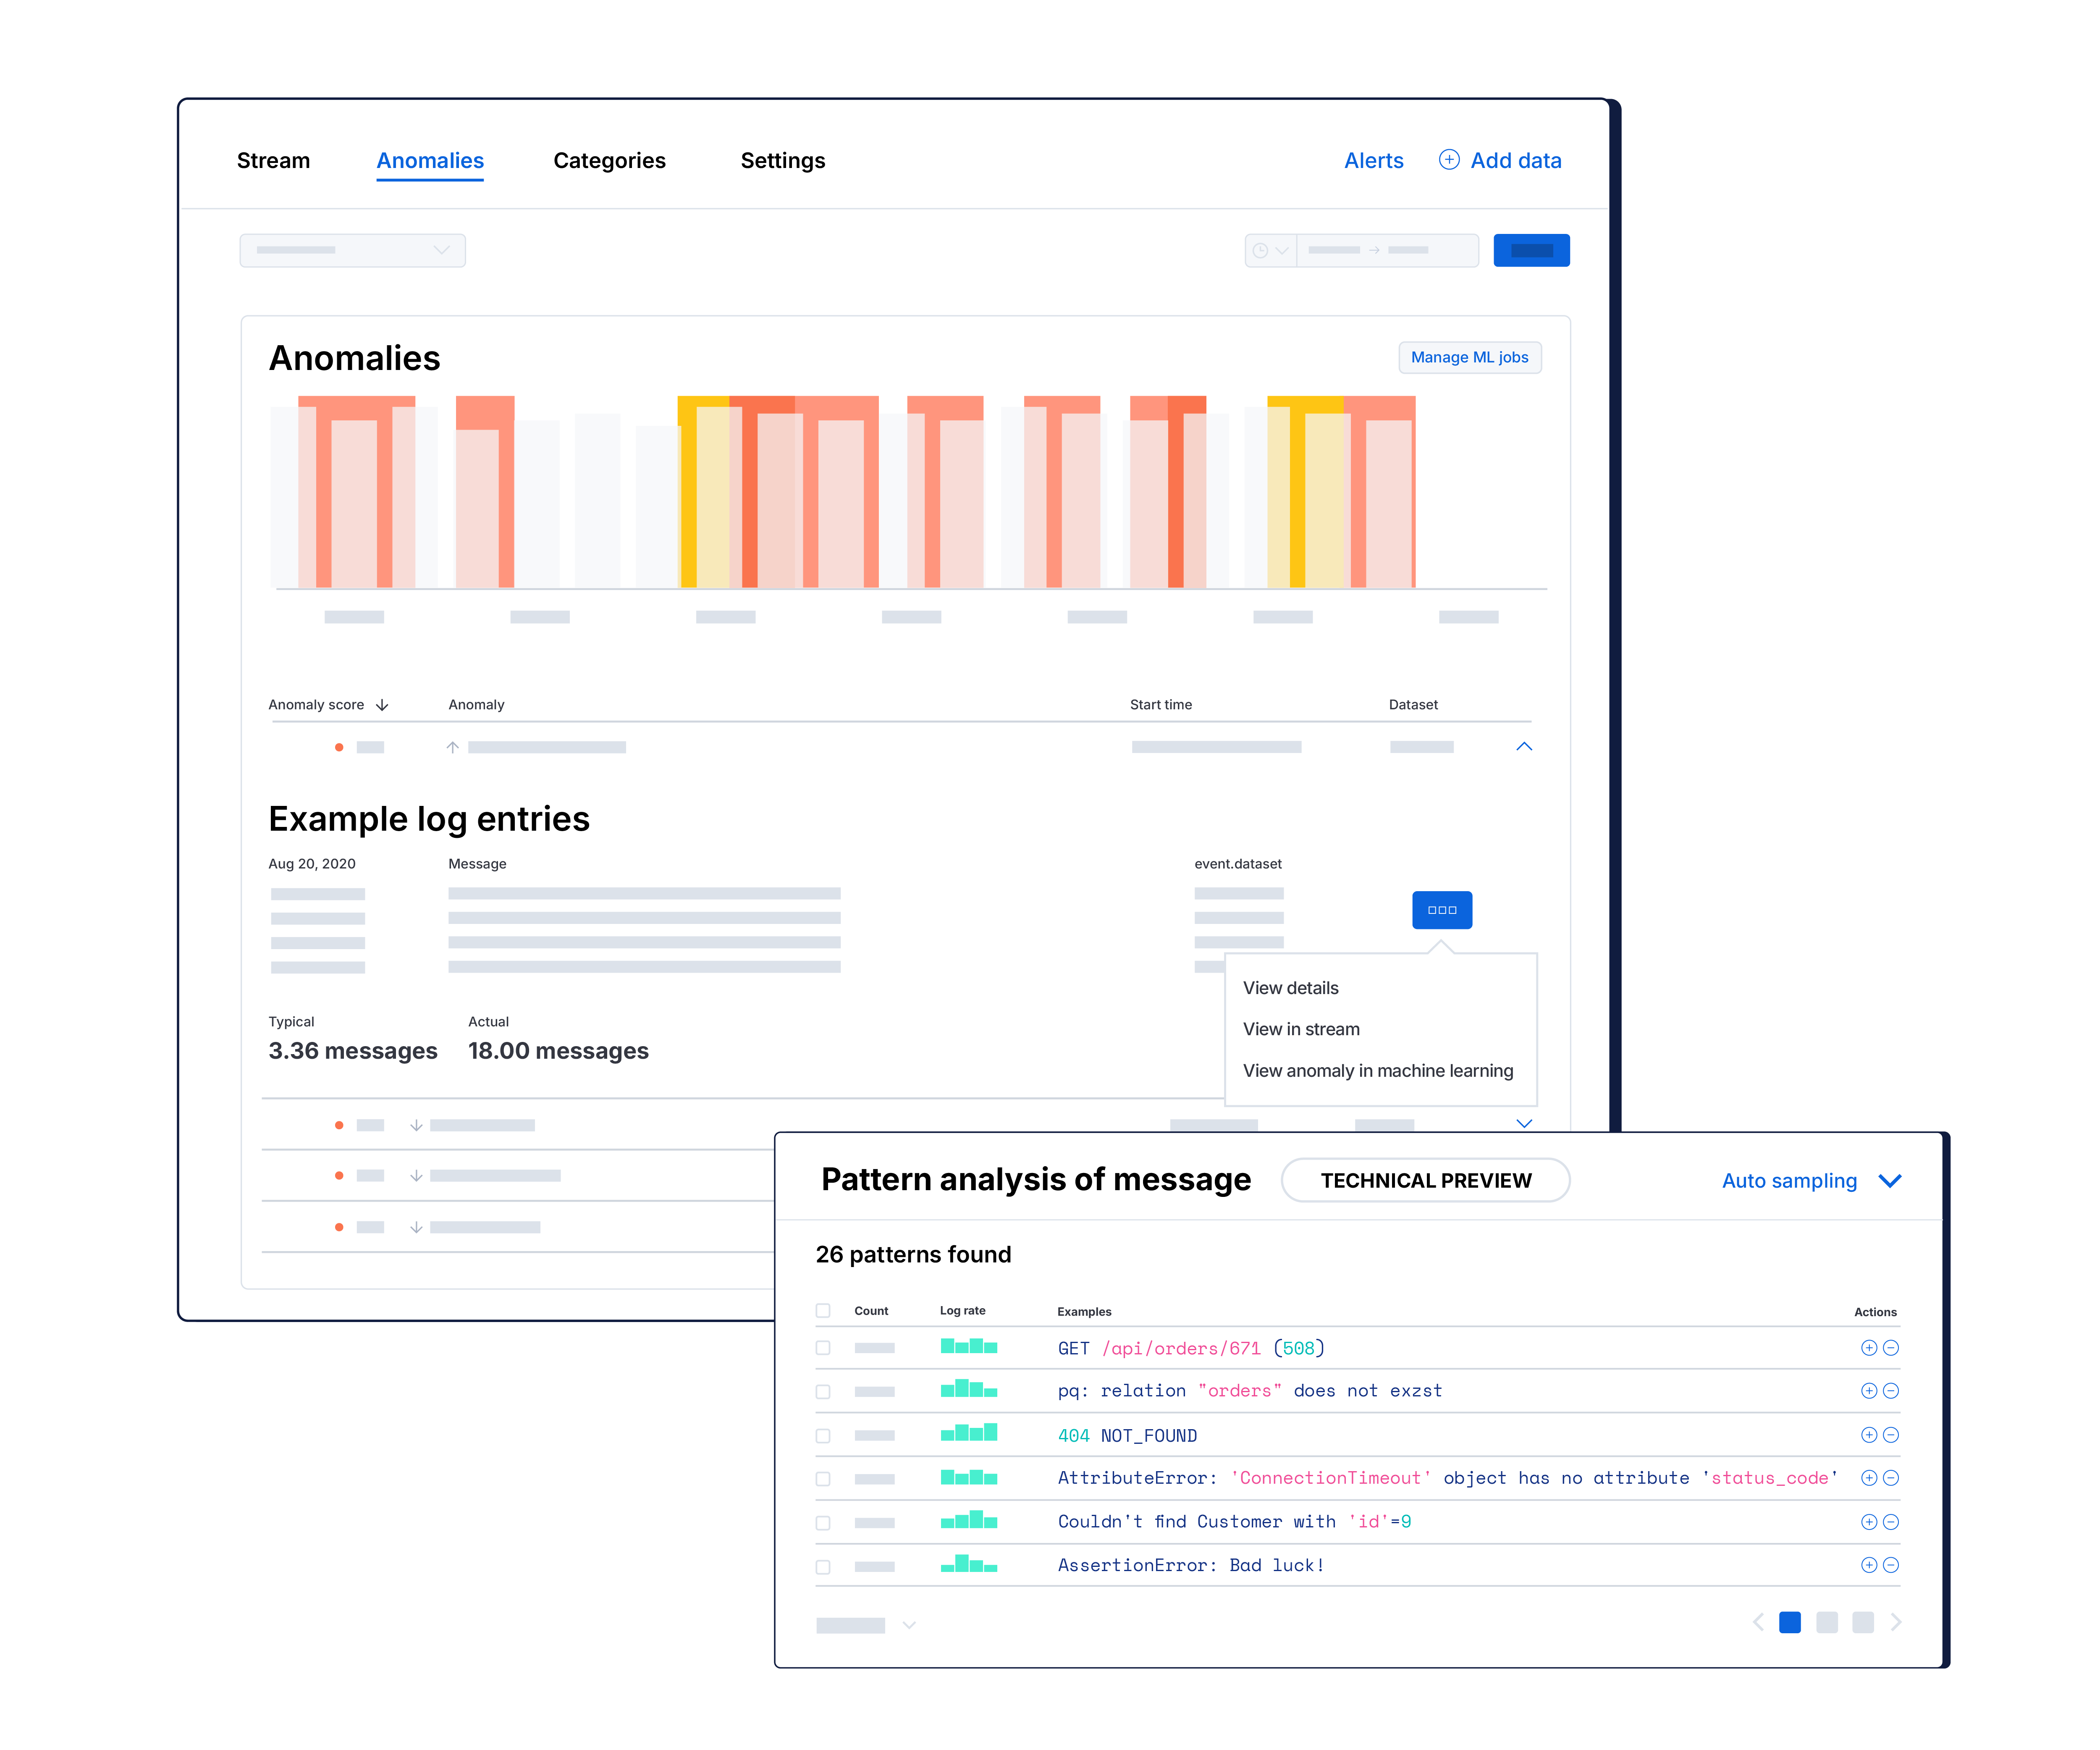
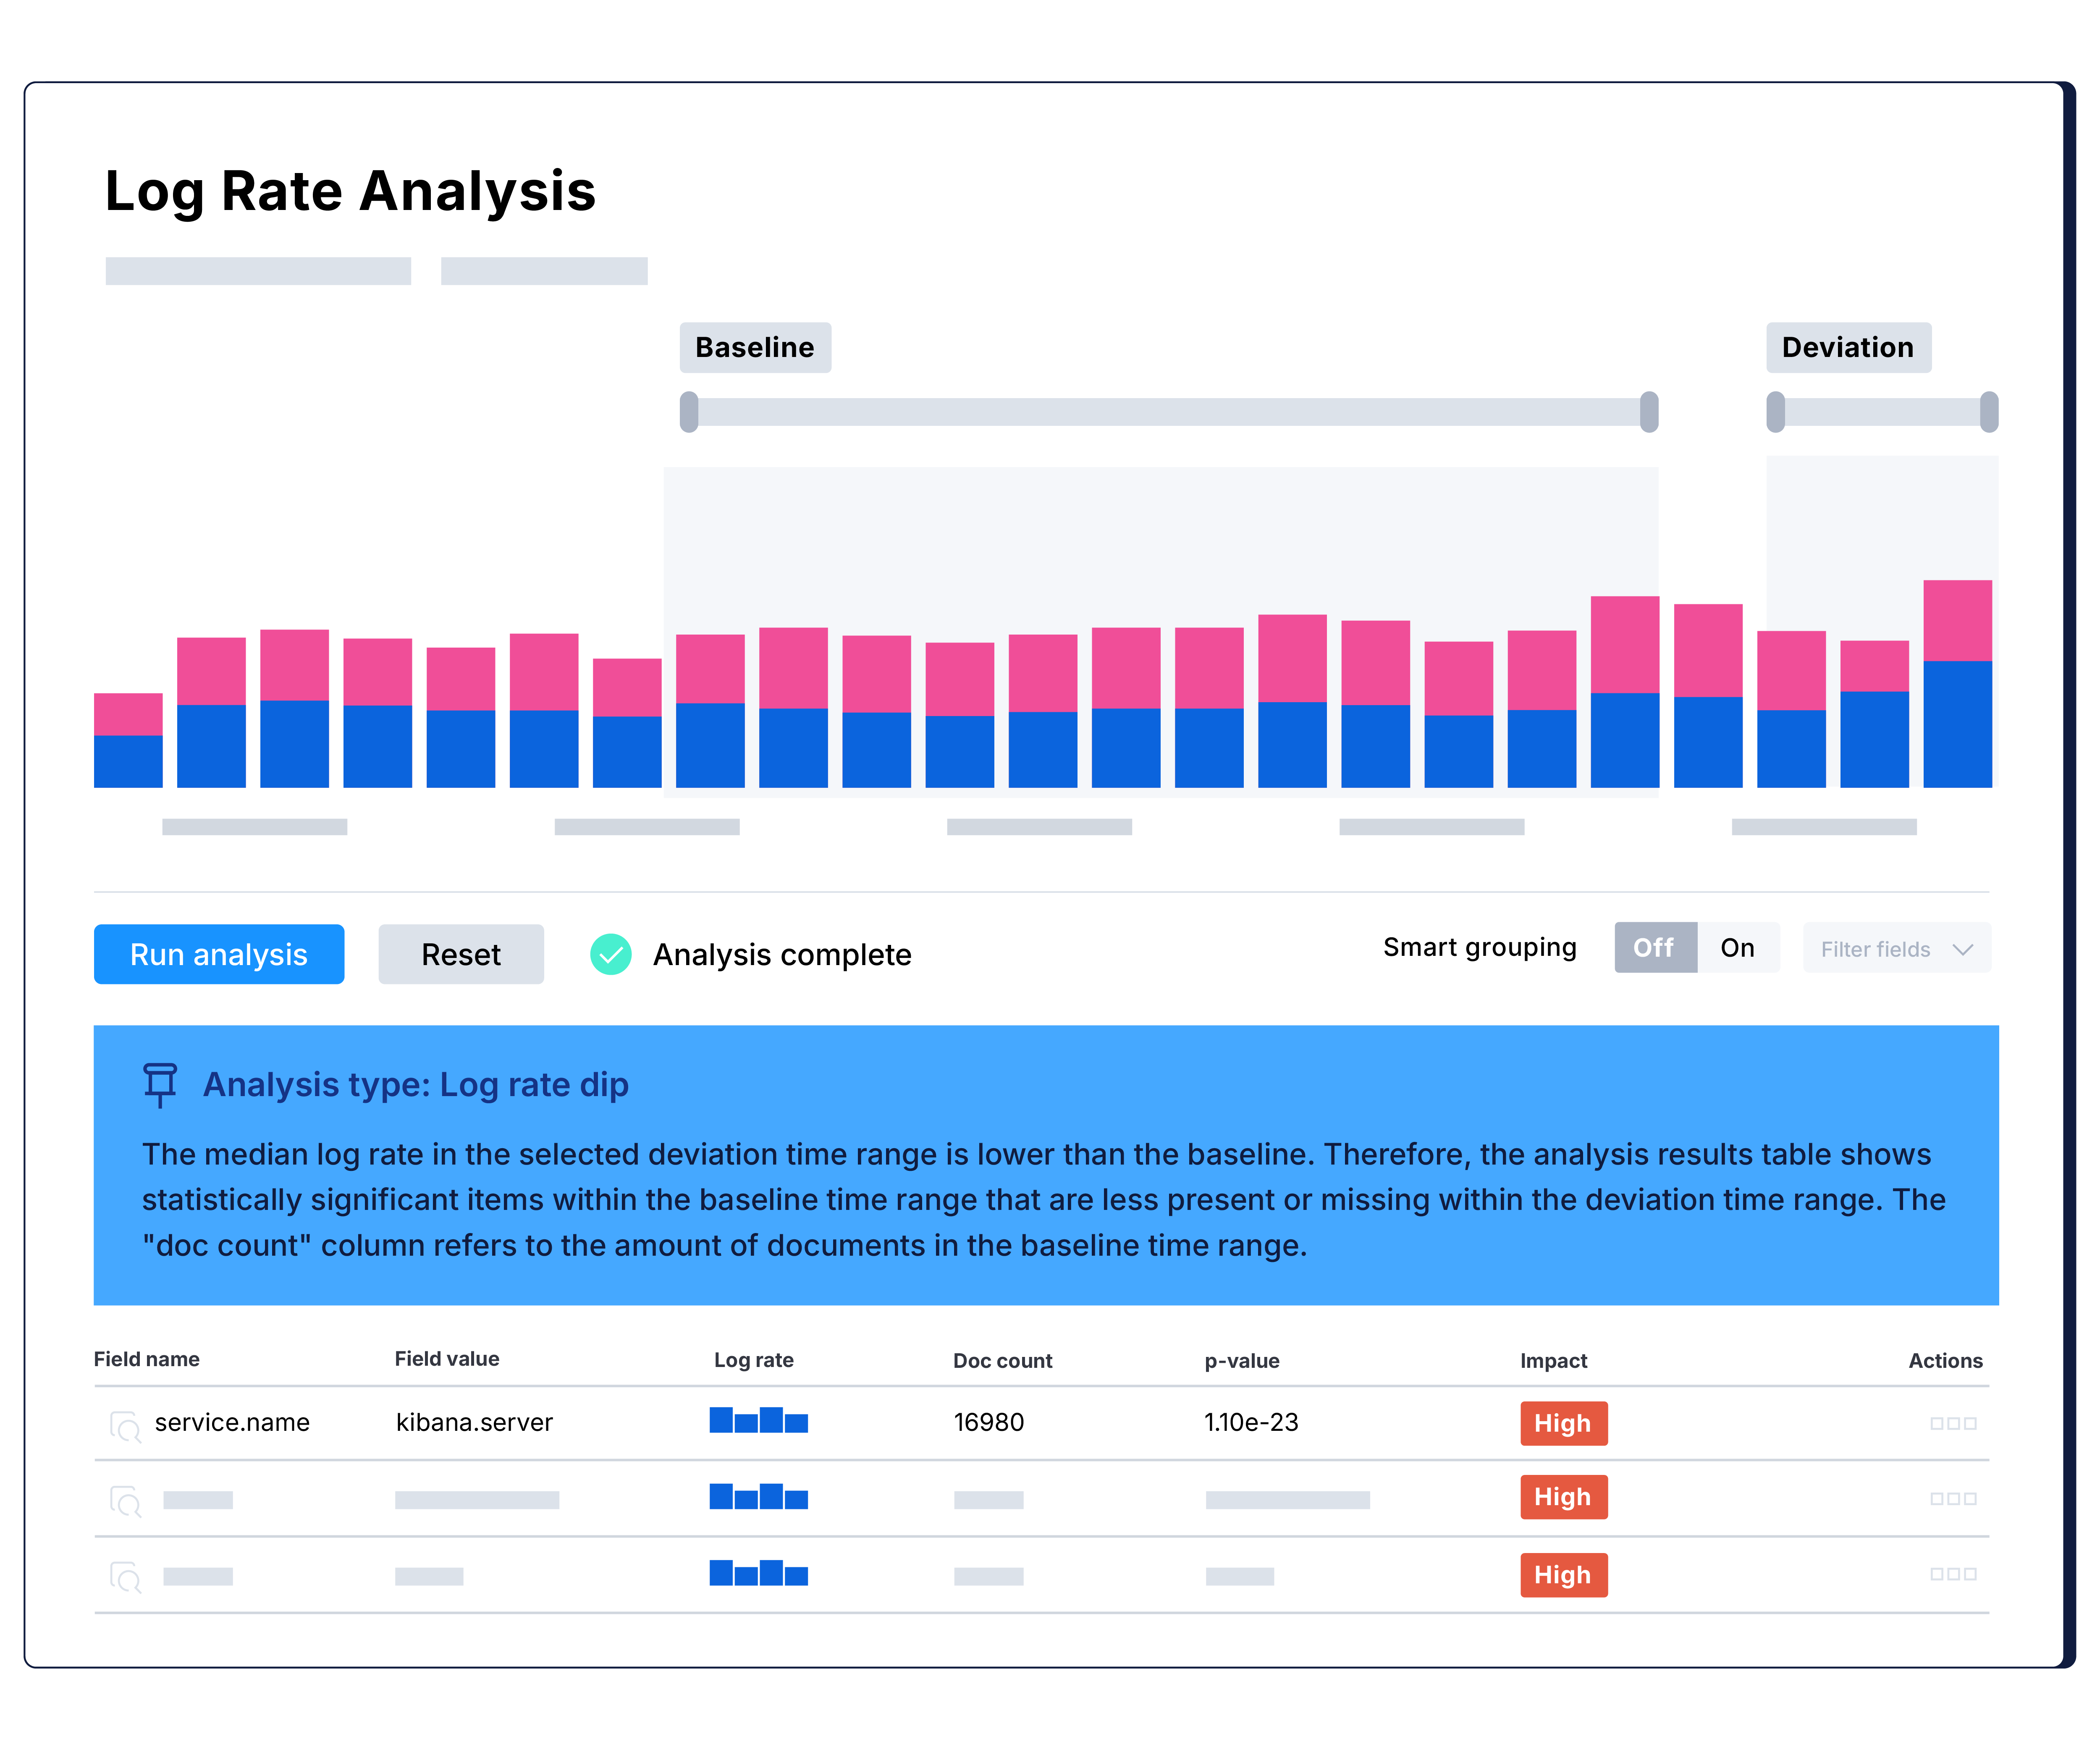
STEP 3: Detect anomalies — AI-assisted investigations quickly turn data into actions.
More data, more problems? Not anymore.
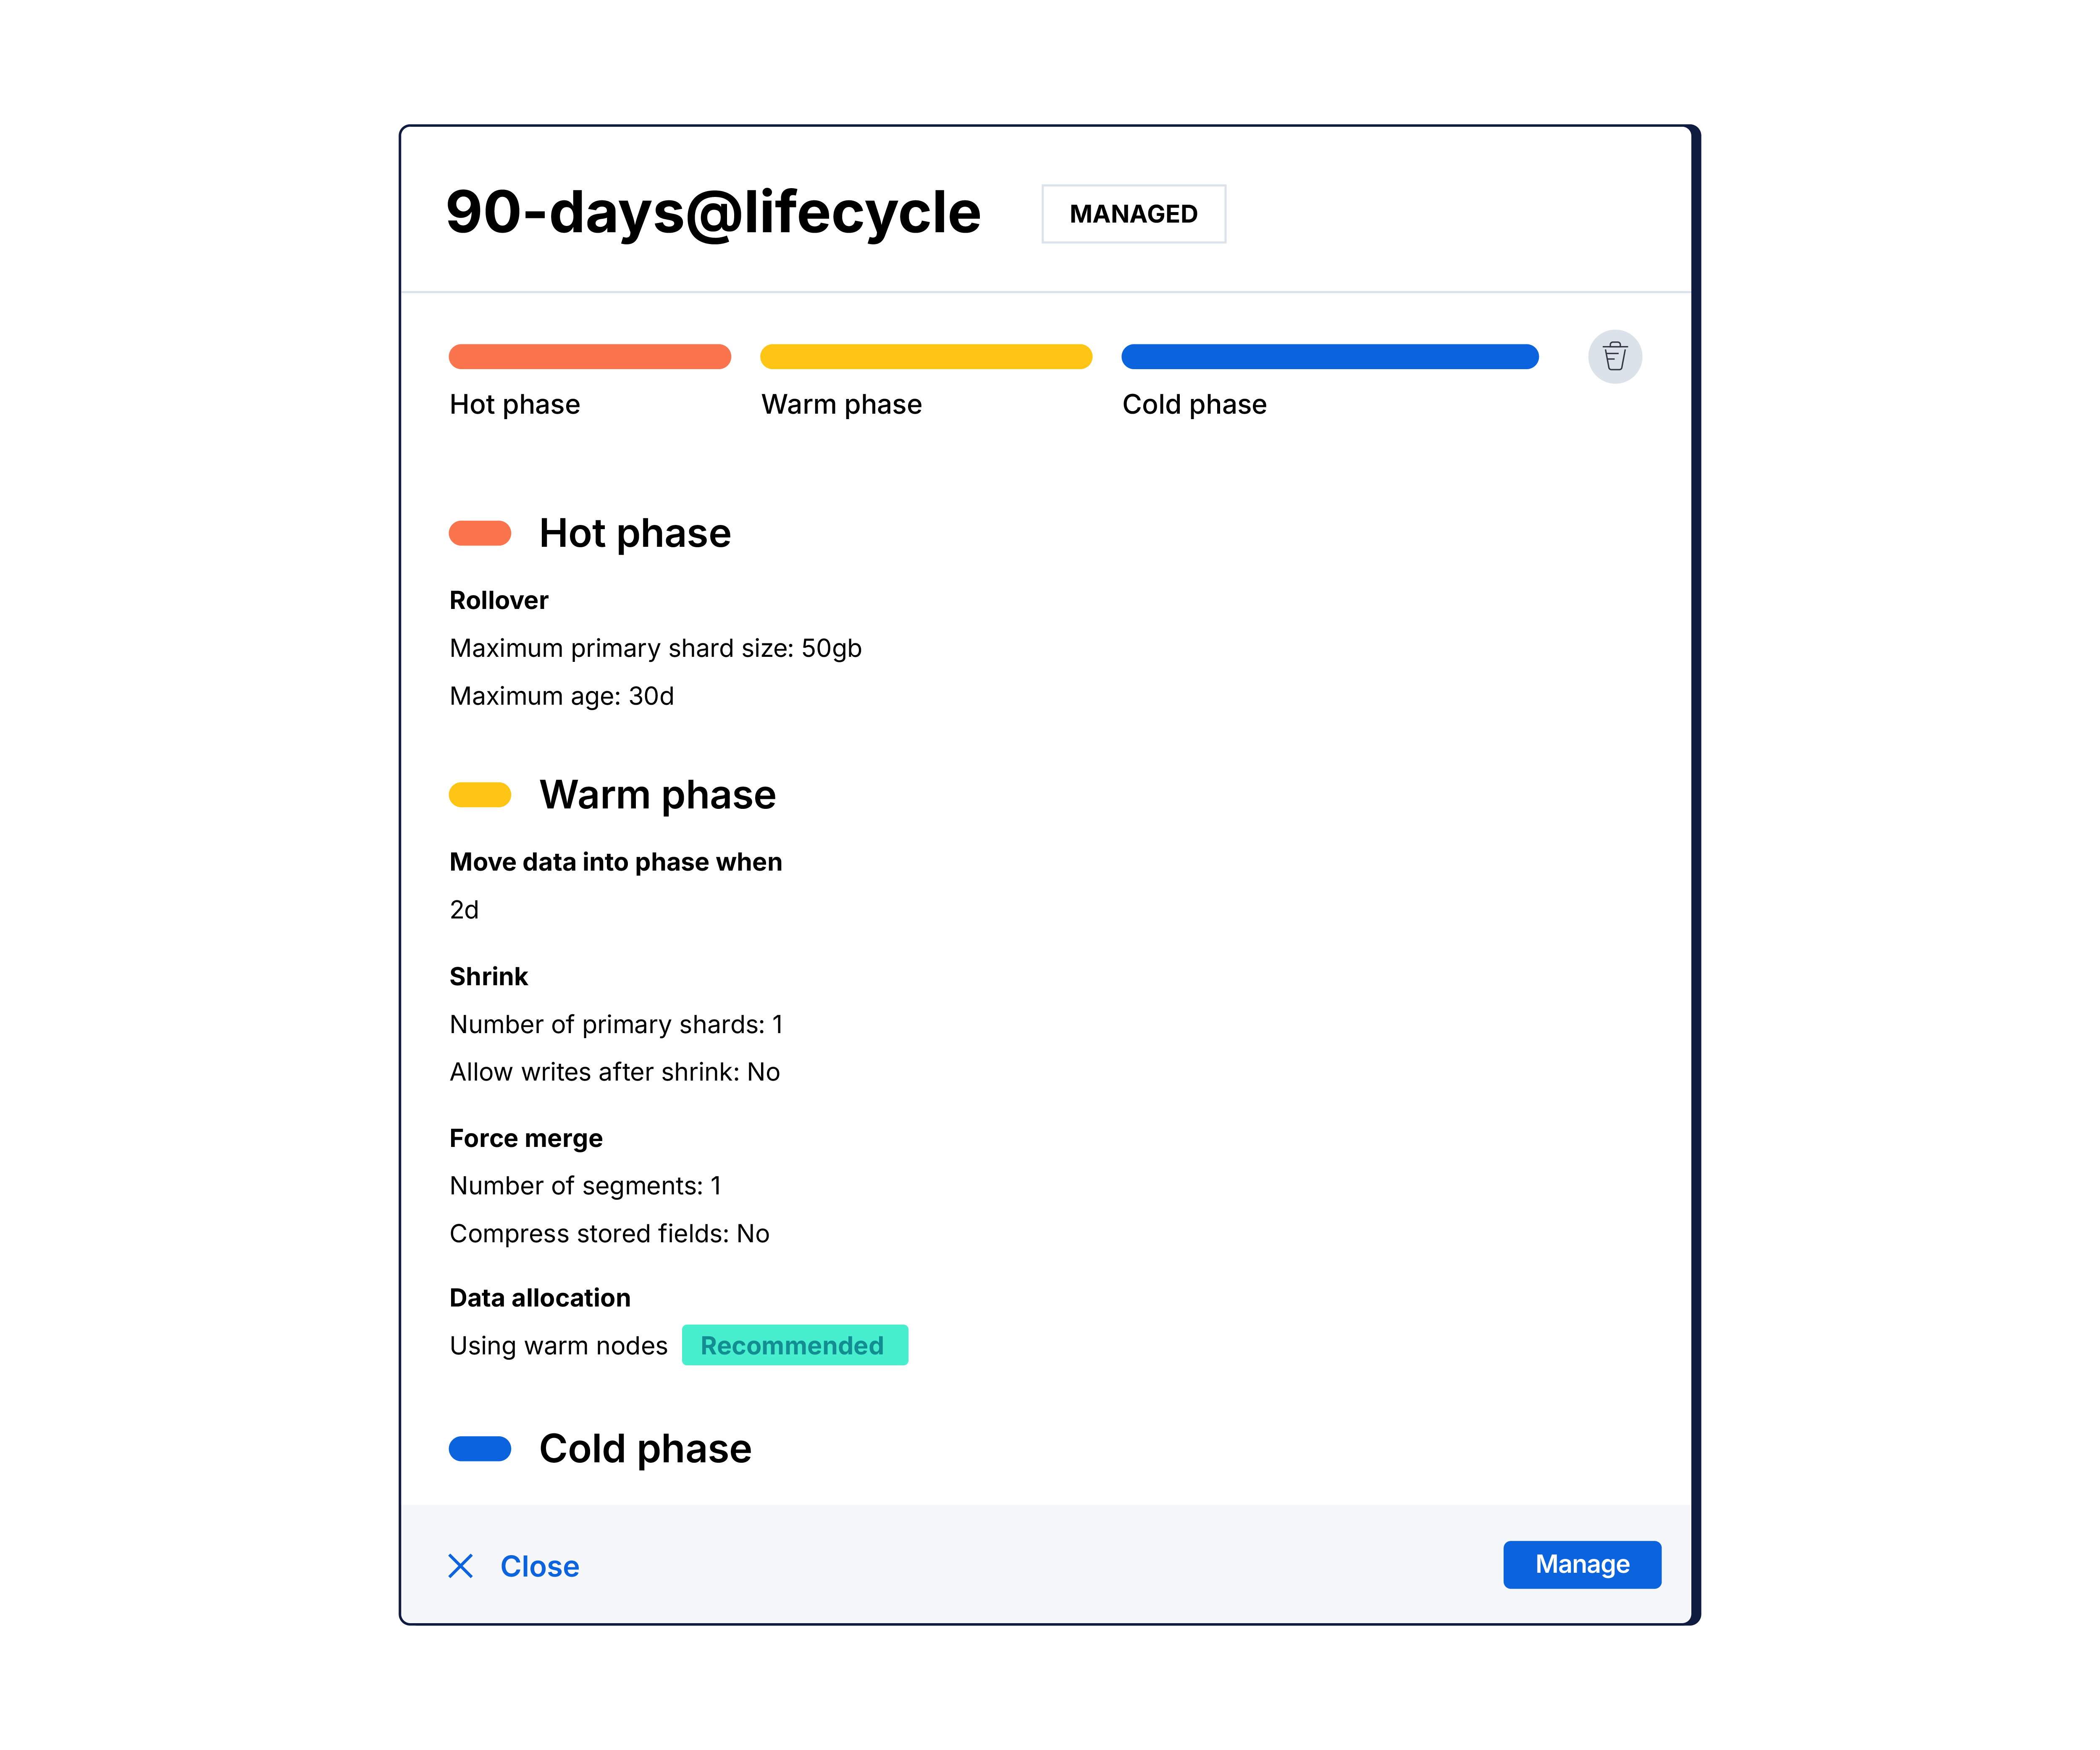
Most logging solutions weren't built for today's scale. Elastic is. Our architecture is designed to handle petabytes of logs with indexing, compression, and efficient data tiering — along with AI-driven analysis — so you have all the telemetry you need, without breaking the bank.


Billions of logs, one clear picture
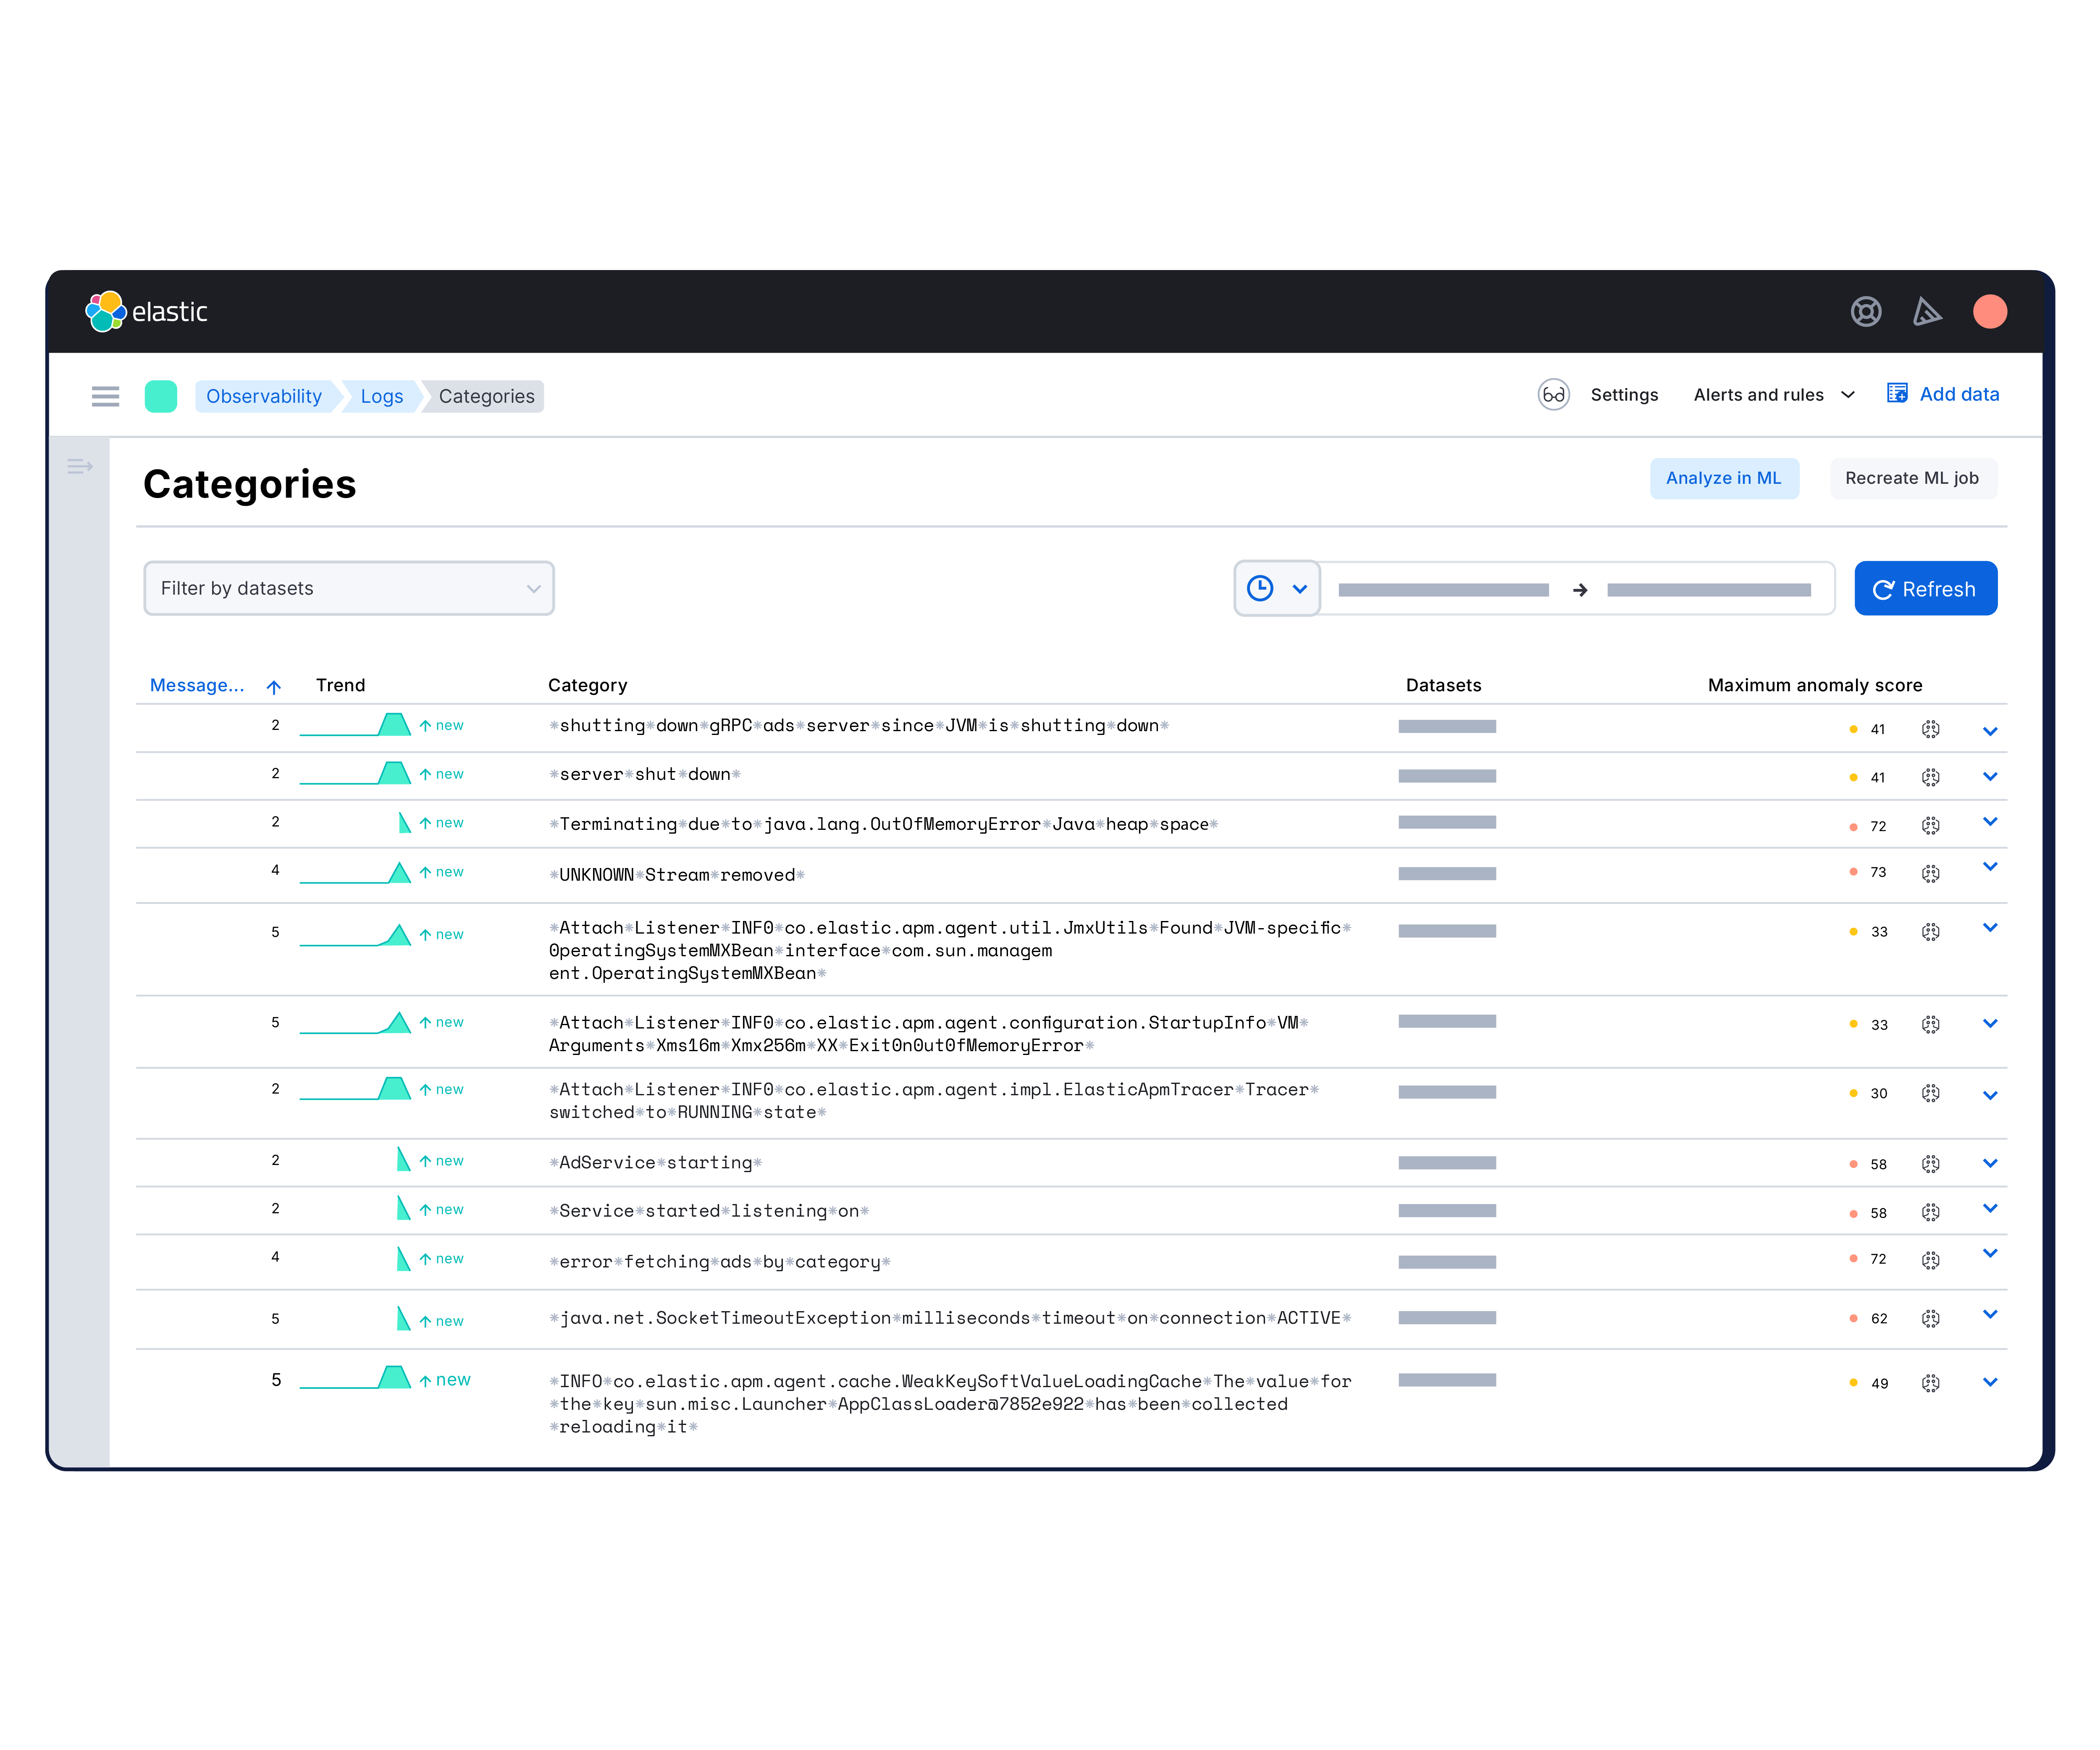
Elastic ingests logs from anywhere and automatically groups them into patterns, highlights anomalies, and pinpoints spikes — so you get answers, not overload.
Elastic automatically groups millions of similar log lines into categories for faster triage.


See why companies like yours choose Elastic Observability
Get log analytics at scale to turn messy logs into operational answers.
Customer spotlight

Comcast ingests 400 terabytes of data daily with Elastic to monitor services and accelerate root cause analysis ensuring a top-notch customer experience.
Customer spotlight

Discover reduced storage costs by 50% and improved data retrieval times by implementing a centralized logging platform with Elastic.
Customer spotlight

Informatica cut costs and reduced MTTR by migrating its entire logging workload to Elastic for 100+ applications and 300+ Kubernetes clusters.

