About cookies on this site Our websites require some cookies to function properly (required). In addition, other cookies may be used with your consent to analyze site usage, improve the user experience and for advertising. For more information, please review your options. By visiting our website, you agree to our processing of information as described in IBM’sprivacy statement. To provide a smooth navigation, your cookie preferences will be shared across the IBM web domains listed here.
Tutorial
Debugging messaging applications using OTel
Add OTel instrumentation to IBM MQ applications for problem determination
The generation of logs and analysis of logs is normal practice for developers. This process quickly becomes more complex in the world of cloud native applications, which can consist of numerous microservices, include multiple serverless operations, and allow some services to run asynchronously to optimise cost and machine resources. Identifying the cause of an issue becomes challenging.
OpenTelemetry (OTel) is a vendor-agnostic, open-source observability framework and toolkit that allows developers to instrument their applications, and then generate, collect, export, and inspect traces, metrics, and logs, which provides insights into how applications are performing and behaving.
In this tutorial you will run, collect, and interpret OTel instrumentation data from an application that will asynchronously send or get messages over MQI (C-based Message Queue Interface) to a queue manager. The application has an HTTP front end that triggers messaging, simulating an end-to-end distributed solution where messaging generated OTel data needs to be matched to HTTP generated OTel data, to determine cause and effect.
Tracing data will be sent from the application to an instance of Jaeger. Jaeger is an open-source distributed platform for tracing that facilitates the troubleshooting of distributed workflows. An instance of Prometheus will be used to handle metric data from the application. Prometheus is an open-source system that collects and stores metrics which can be queried.
In this tutorial you will be using instrumentation to troubleshoot a sample distributed workflow that makes use of asynchronous messaging using IBM MQ.
The following diagram shows the components that you will be deploying and how they interact with each other.
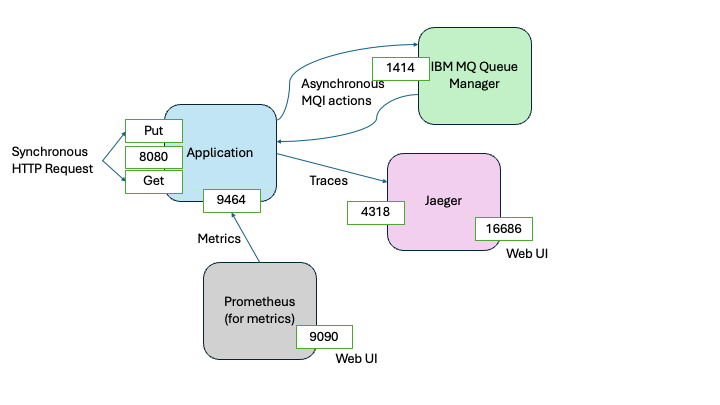
HTTP requests are used to trigger application actions that put and get messages on to a queue. The application is instrumented so that it is possible to trace the full journey of each message across the workflow, from the user or application that raised the request to the user or application that received the message.
In most cases, you will not be tracing the journey of every message, only those that have caused issues. To simulate this tracing, the application adds a watermark on a random set of messages during the put action. The presence of this watermark is detected and flagged during the get action.
Trace instrumentation is sent to Jaeger, on port 4318. Prometheus reads application generated metrics from the application on port 9464.
You will be able to use instrumentation to detect messages with the watermark and then trace their journey through the distributed workflow that makes up the sample application.
Sample application flow
The application can be run with or without instrumentation. We will see that in the tutorial steps, but the overall application flow is:
Putting messages on the queue
Synchronous steps
- The application listens for HTTP requests on port 8080.
- A request on
putis issued, with targeted queue manager and queue specified. - The request is verified, and if ok, a 200 HTTP response is returned.
Asynchronous steps
- A connection to the specified queue manager is made.
- The requested specified quantity of messages is put onto the queue. A small portion of the messages is marked with a watermark.
- The connection is closed.
Getting messages from the queue
Synchronous steps
- The application is listening for HTTP requests on port 8080.
- A request on
getis issued, with targeted queue manager and queue specified. - The request is verified, and if ok, a 200 HTTP response is returned.
Asynchronous steps
- A connection to the specified queue manager is made.
- The requested specified quantity of messages is gotten from the queue. If a message is marked as damaged an exception is raised. If there is an active trace, the exception is added to the trace and failed message metrics are updated.
- The connection is closed.
Tracing
- Periodically, the collected traces are sent to the active trace exporter.
Metrics
- Periodically, the application metrics are collected by the active metrics scrapper.
Understanding OTel in our sample application
Telemetry is an umbrella term for traces, metrics, and logs, which your application generates. OpenTelemetry (OTel) provides a standard way to generate and capture telemetry data so it can be sent to, or collected by, telemetry offerings, which in turn provide you a diagnostic tool. By examining telemetry data, you can gain insights into the inner health of your application. The creation of dashboards is a popular use case for OTel instrumentation.
Logs will tell you how each service is behaving. Metrics can be used to monitor the health of the distributed system. Traces allow you to see paths through the distributed system. Traces are made up of Spans. Spans represent events or operations generated in a nested parent child relationship that provides context.
Common libraries such as HTTP or the IBM MQ Client, can identify relationships that cross services, creating distributed traces. This is possible as many libraries are OTel ready. This instrumentation logic remains dormant unless a consuming application packages and switches on Open Telemetry.
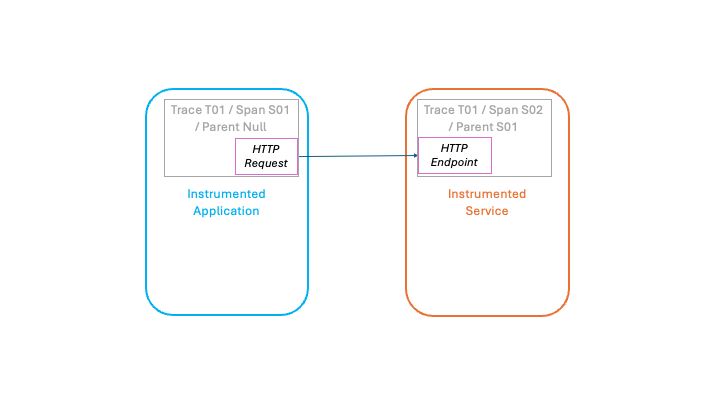
For example, the following diagram, shows how the Node.js HTTP feature will generate a new trace for each incoming HTTP call. If, however, the invoking application is also running instrumented, then it’s trace and current span ID are added to the HTTP call. The invoked HTTP service sees this and instead of creating a new trace it can continue the originating trace adding new nested spans, linking it back to the application that issued the HTTP call.
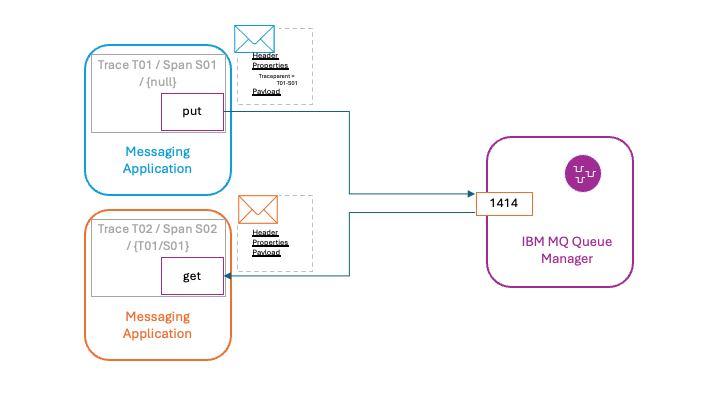
Asynchronous messaging adds additional complexity because not all applications within the system will be online when the message is being consumed. As shown in the following diagram, the IBM MQ Node.js client will add the current trace and span IDs as a traceparent message property to the message, allowing the trace provenance to be preserved within the message.
No changes are needed in your application logic to take advantage of this instrumentation. The only requirement is that the instrumentation initialization is performed to allow your code to be instrumented at runtime.
Optionally, your application can create extra spans or generate metrics to provide additional context.
Prerequisites
To complete this tutorial, you will need the following:
- Git CLI
- An IDE, such as VSCode
- Podman or Docker
- Podman compose or Docker compse
- If you are running on an Apple Silicon MacOS machine, then you will need to create an ARM64 compatible MQ container by following this blog
This tutorial uses Podman and Podman compose, but the commands can be substituted for Docker and Docker compose.
Steps
Step 1. Obtain the sample code
Because the github repository for our sample code contains several code samples, we will perform a partial checkout to avoid pulling unnecessary code.
In a command window or terminal clone with a --no-checkout option the mq-dev-patterns github repository.
git clone --no-checkout https://github.com/ibm-messaging/mq-dev-patterns>
Navigate to the mq-dev-patterns directory.
cd mq-dev-patterns
Request only the Otel sample.
git sparse-checkout set Node.js-OTel
Checkout the Otel sample.
git checkout
Navigate to the Otel sample directory.
cd Node.js-OTel
Step 2. Start the sample
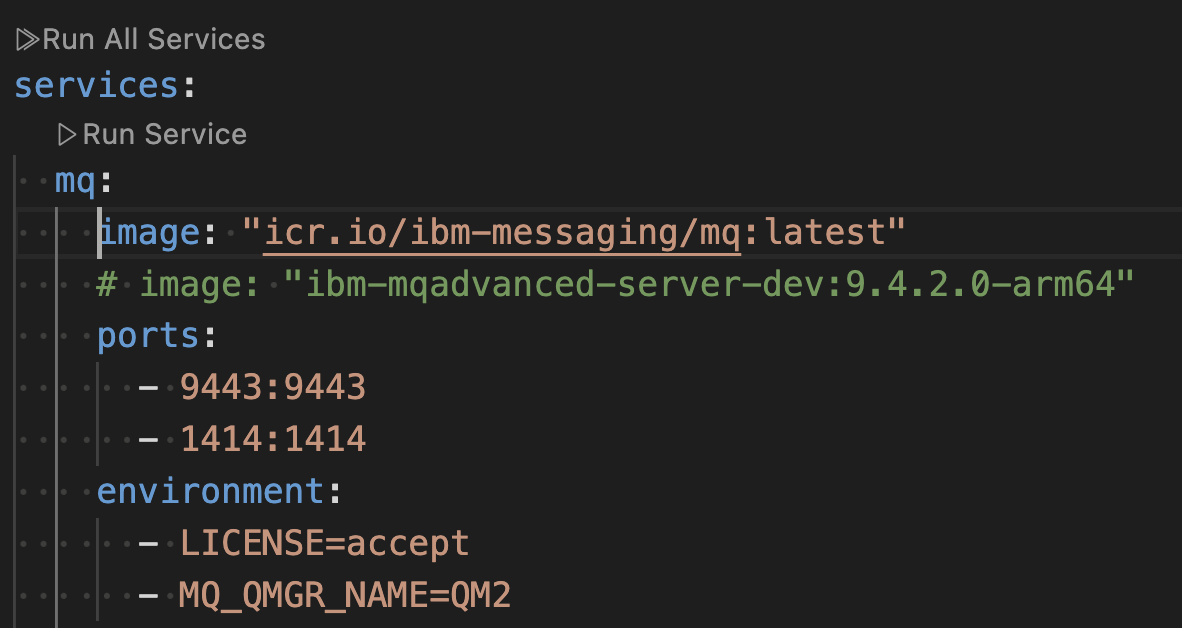
Open the file docker-compose.yaml in your IDE.
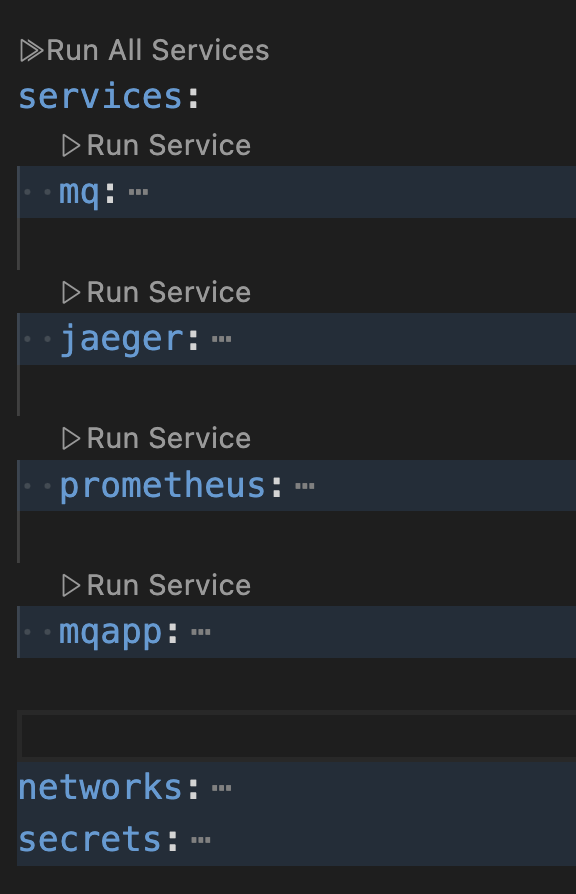
The sample consists of four interconnected containers.
If you are running on MacOS, then specify the MQ image to be the custom created Arm64 image that you created as a prerequisite.
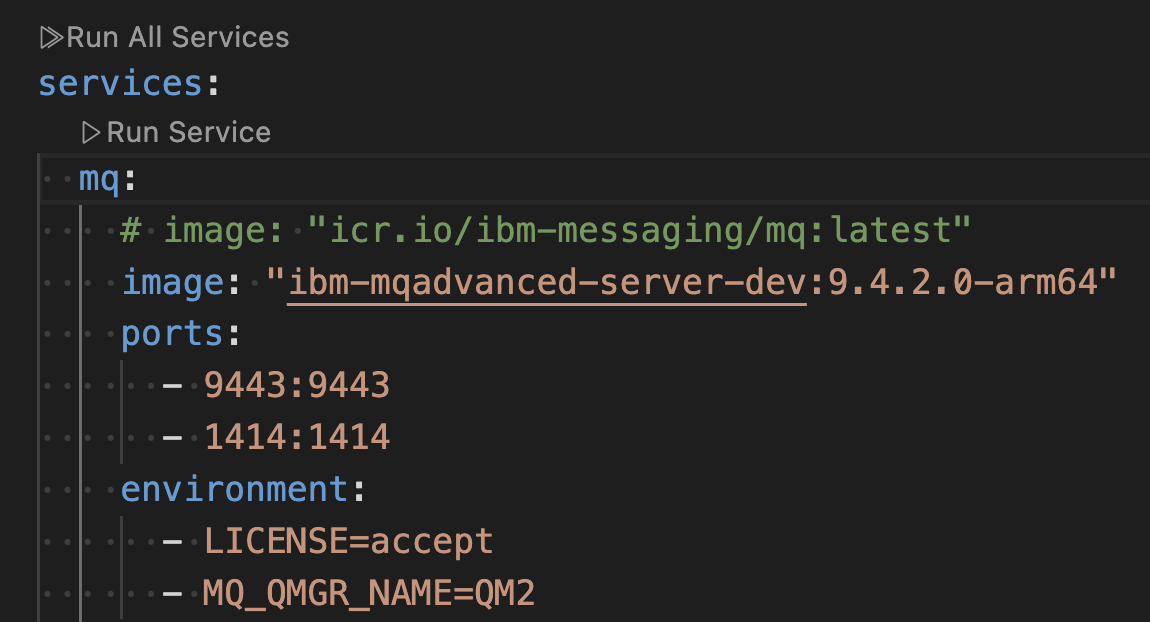
For x86-64 platforms, that is Windows and Linux, you can use the default ibm-messaging image.
In your command window, run the following podman compose command to build the containers.
podman compose build
Run the following command to start the containers.
podman compose up
Step 3. Exploring traces with Jaeger and metrics with Prometheus
The sample should be running, but you haven’t interacted with it yet. Even so, the OpenTelemetry SDK will have been initiated and the regular cycle of transmitting Otel data will have been started.
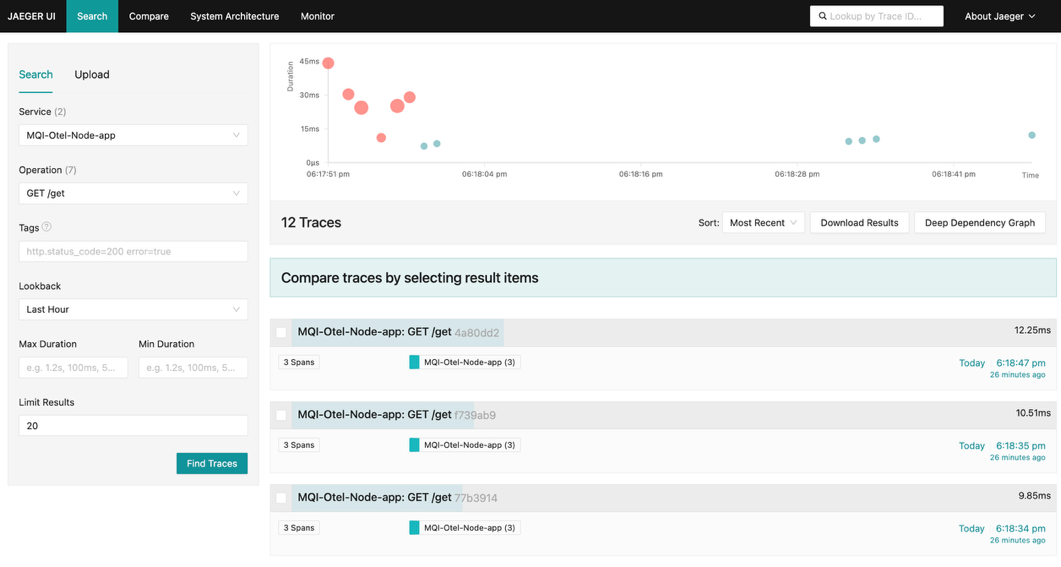
In a browser open the Jaeger UI on http://localhost:16686/.
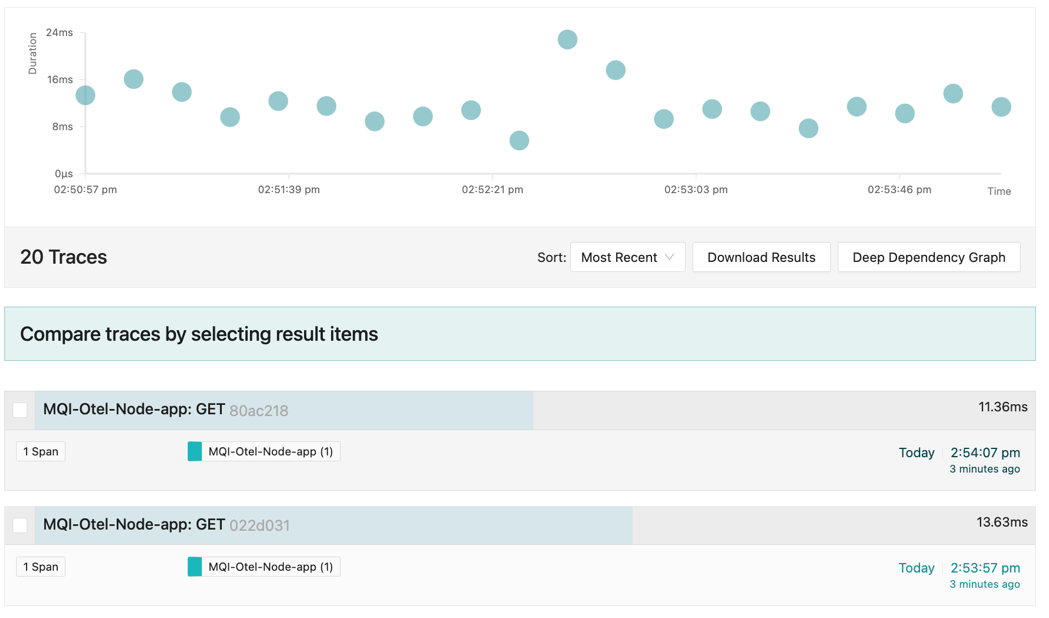
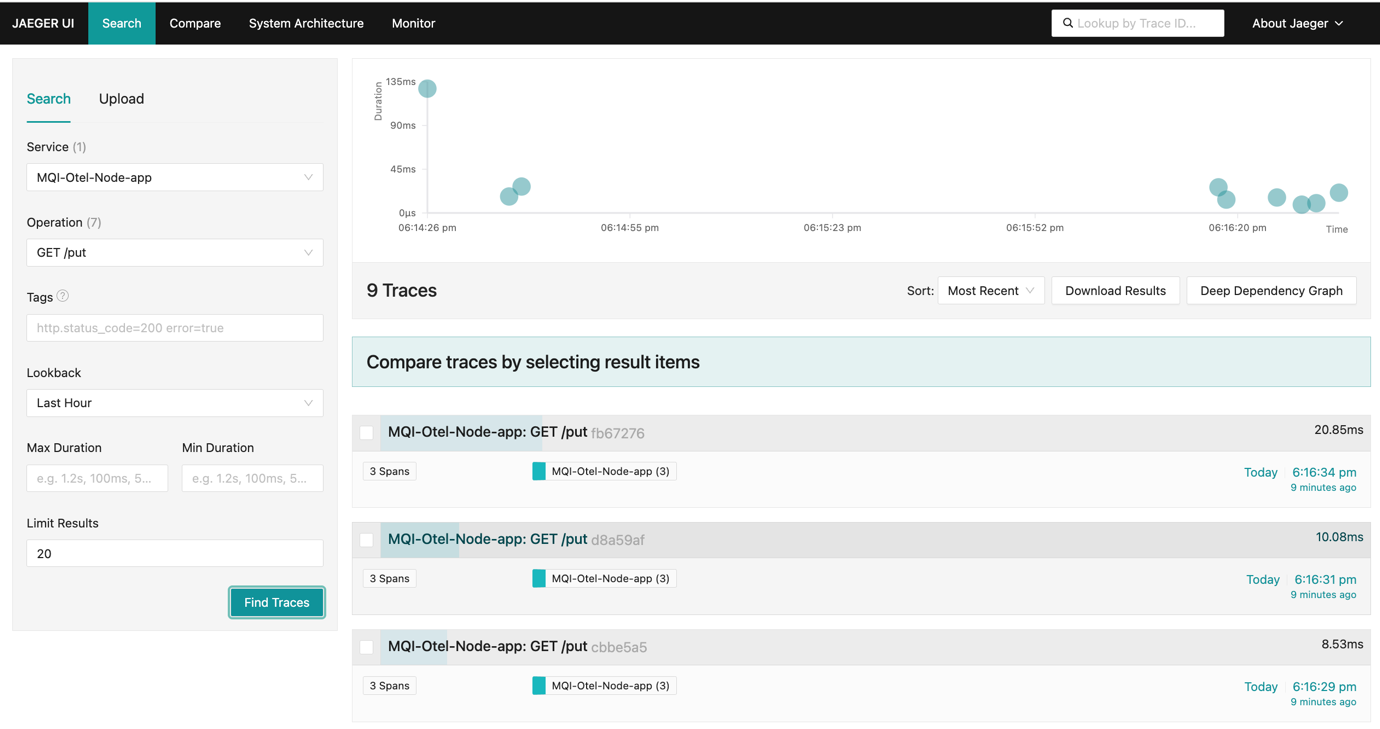
Search for all traces from the application service MQI-Otel-Node-app.
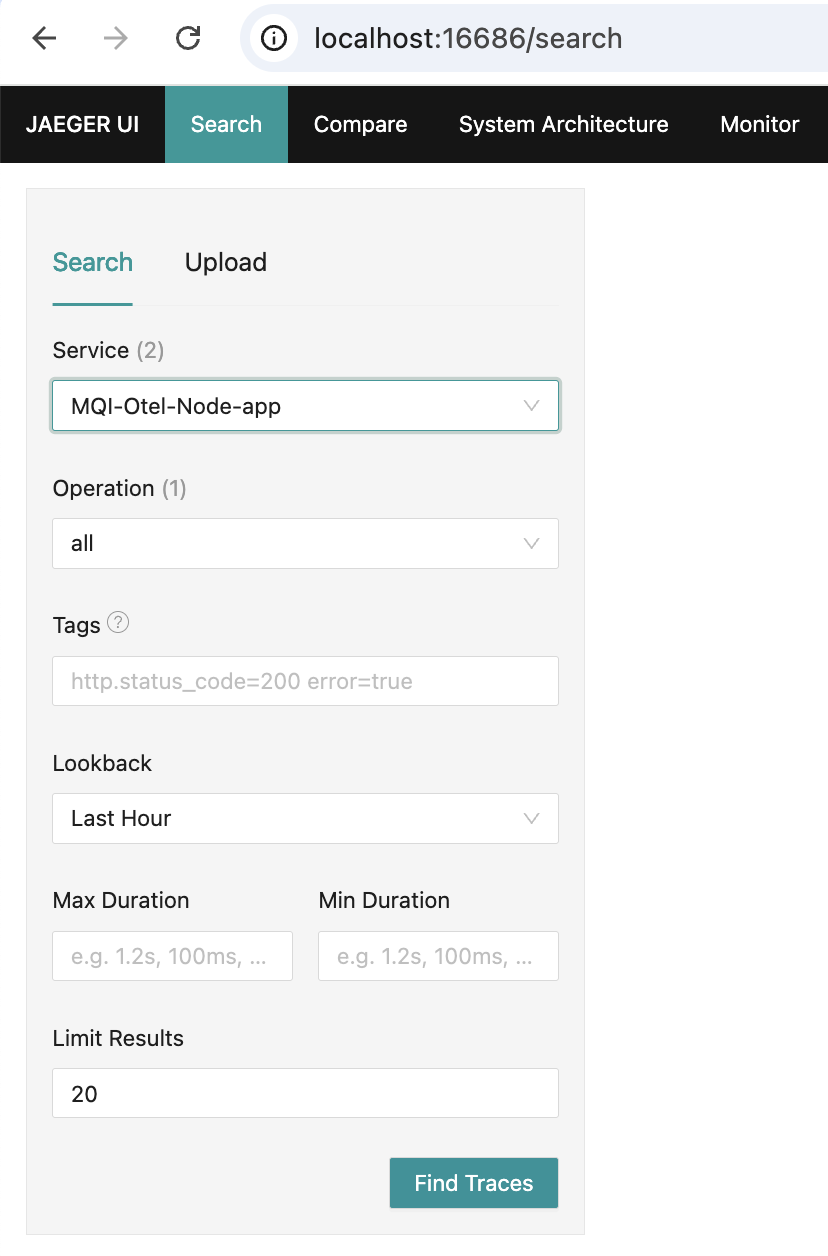
You should see several traces consisting of single spans.
Click and open any of the traces. Expand the tags.
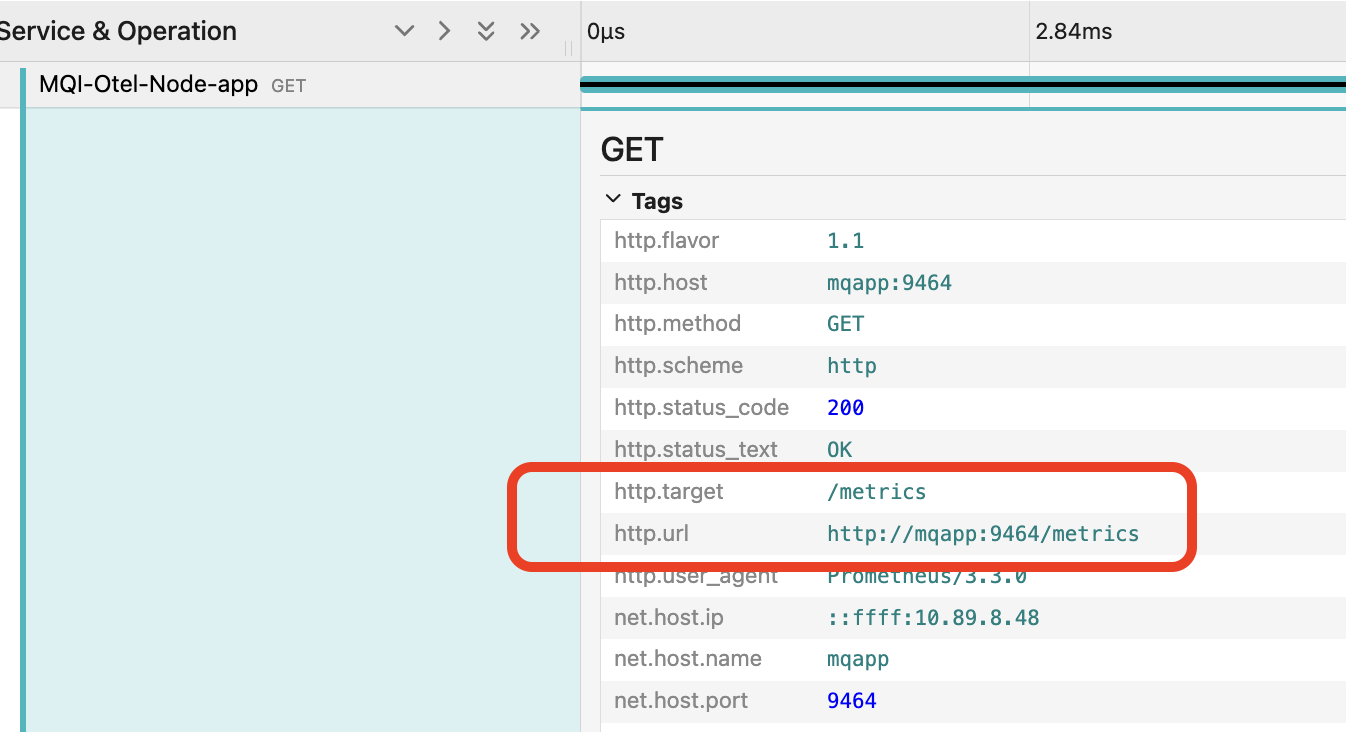
Note that the trace is for a GET call on http://mqapp:9464/metrics.
This is Prometheus collecting metrics from the application.
In a new browser page, open the Prometheus UI on http://localhost:9090/.
Click the three dots in the expression entry field.
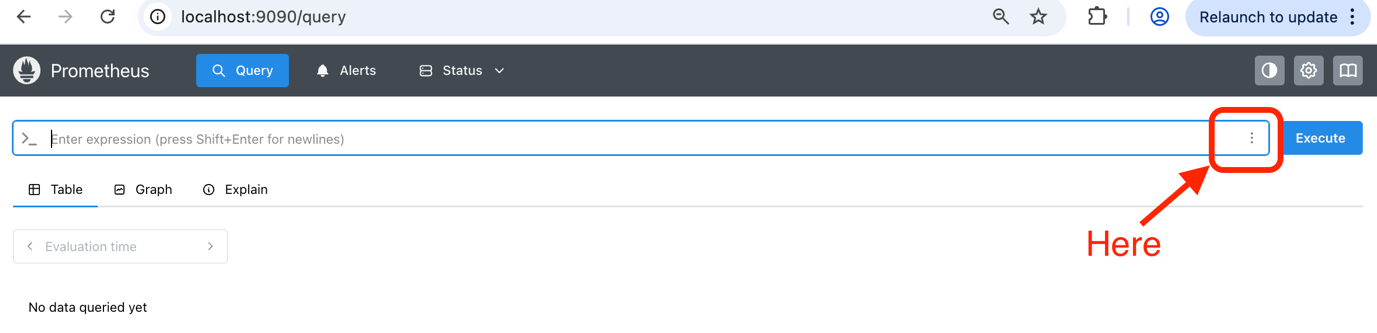
Select Explore metrics.
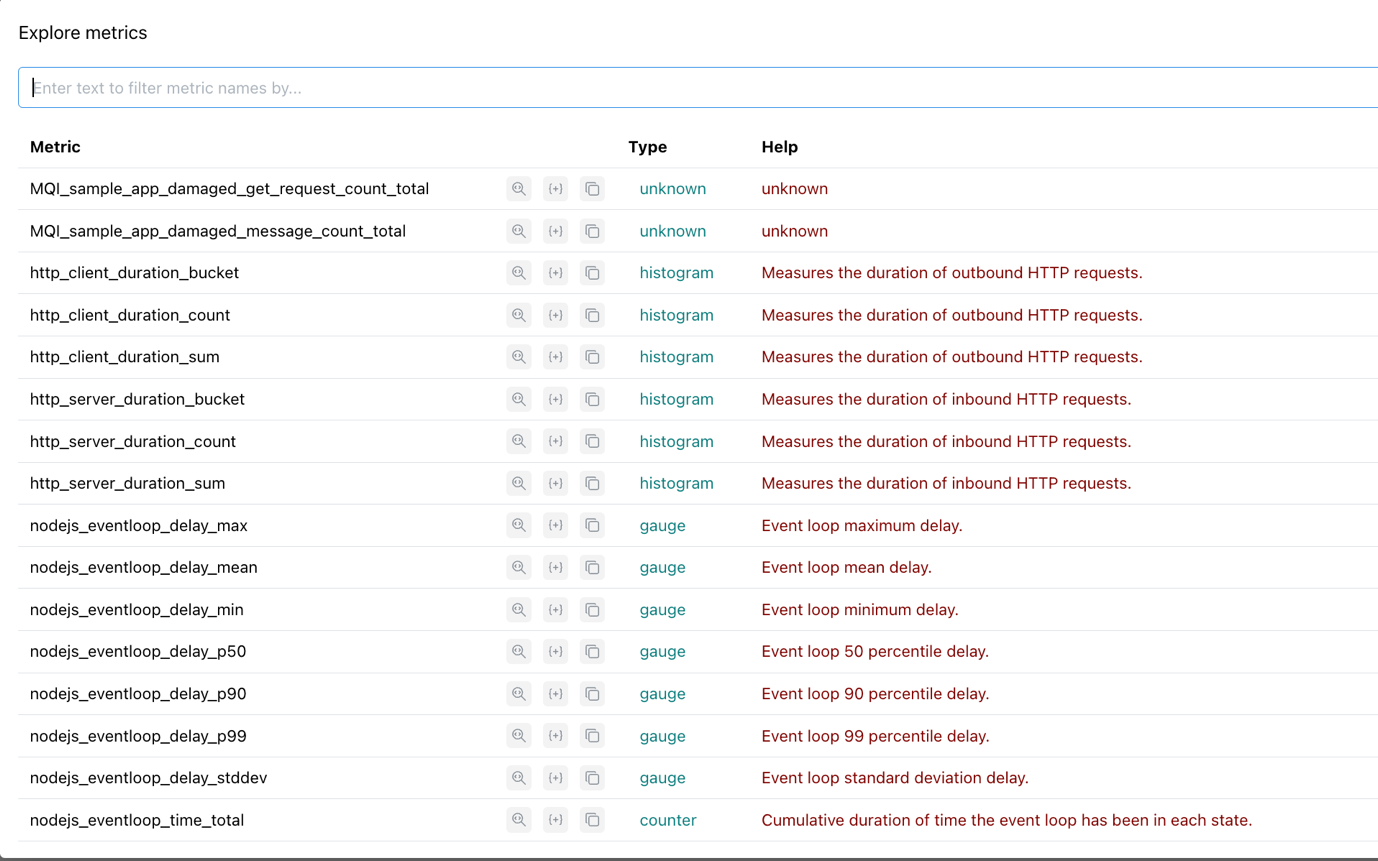
Notice the range of metrics that Prometheus is already collecting.
Step 4. OpenTelemetry SDK
In your IDE, open up the Node.js-Otel directory. From here, open the file package.json.
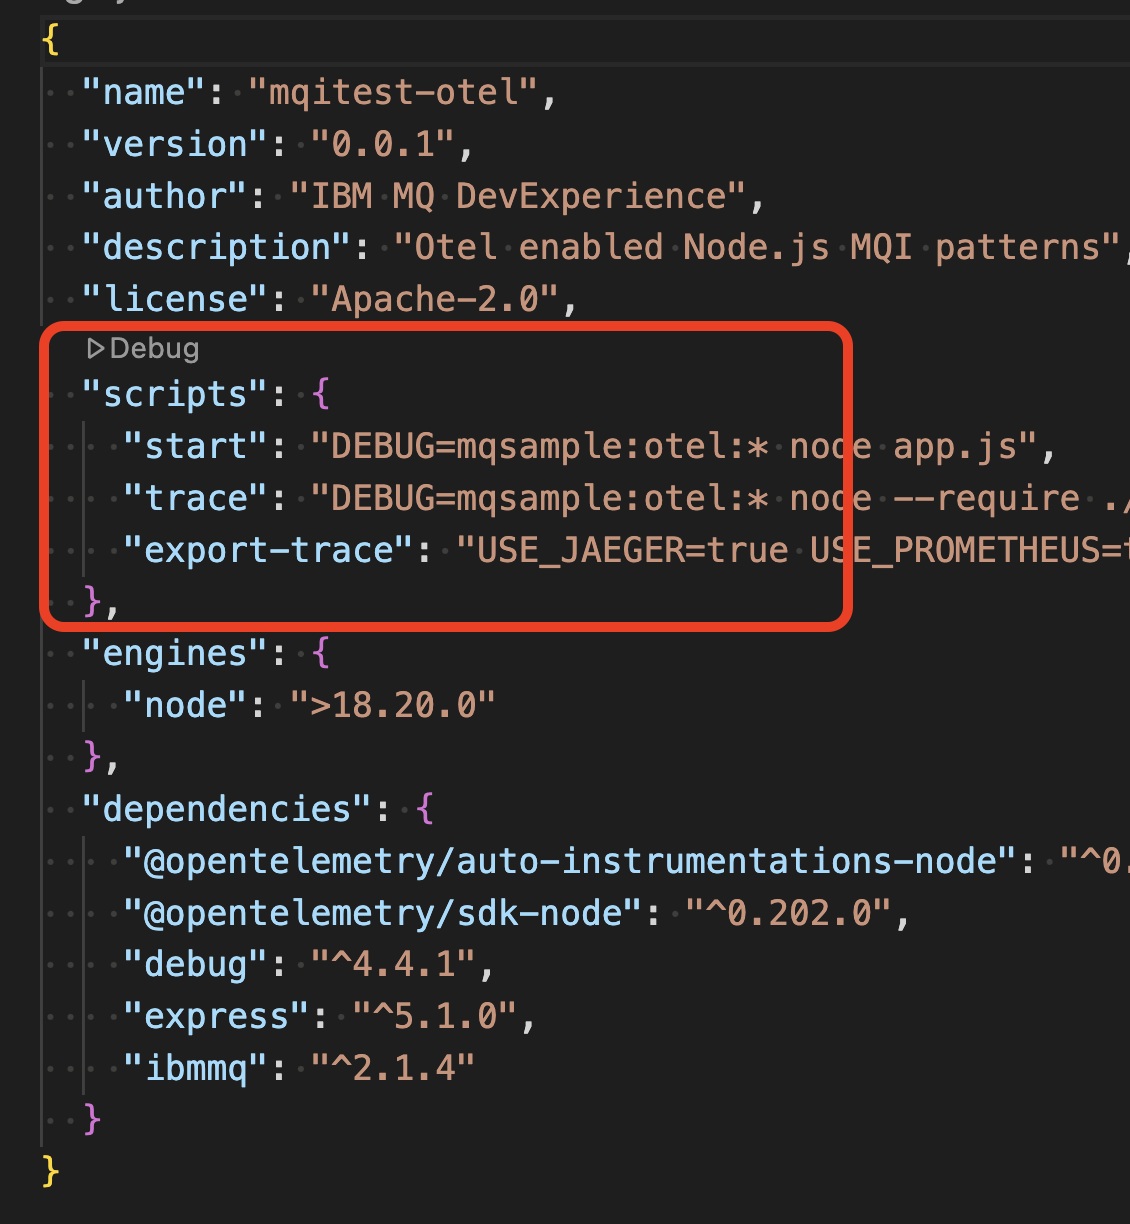
Note that there are 3 modes in which to start the application:
npm run start, which starts the application with no active instrumentation.npm run trace, which starts the application with instrumentation going to the console only.npm run export-trace, which starts the application with instrumentation going to Jaeger and Prometheus.
We started the application with npm run export-trace.
Notice that the trace and export-trace modes have a -require ./instrumentation/control.js before the application. This allows the instrumentation SDK to be initialized before anything in the application is started allowing everything that can be instrumented to be instrumented.
This allows you to add instrumentation to an application without modifying the application itself. If the underlying communication libraries, such as HTTP, messaging, or database, are instrumented, then adding instrumentation in this way allows you to create distributed traces and associated metrics.
You may, however, want to add some extra application context to the trace to allow issues to be more readily found, diagnosed and fixed.
Step 5. Application issued Spans
The application creates new child spans under two conditions.
For all message requests the code in
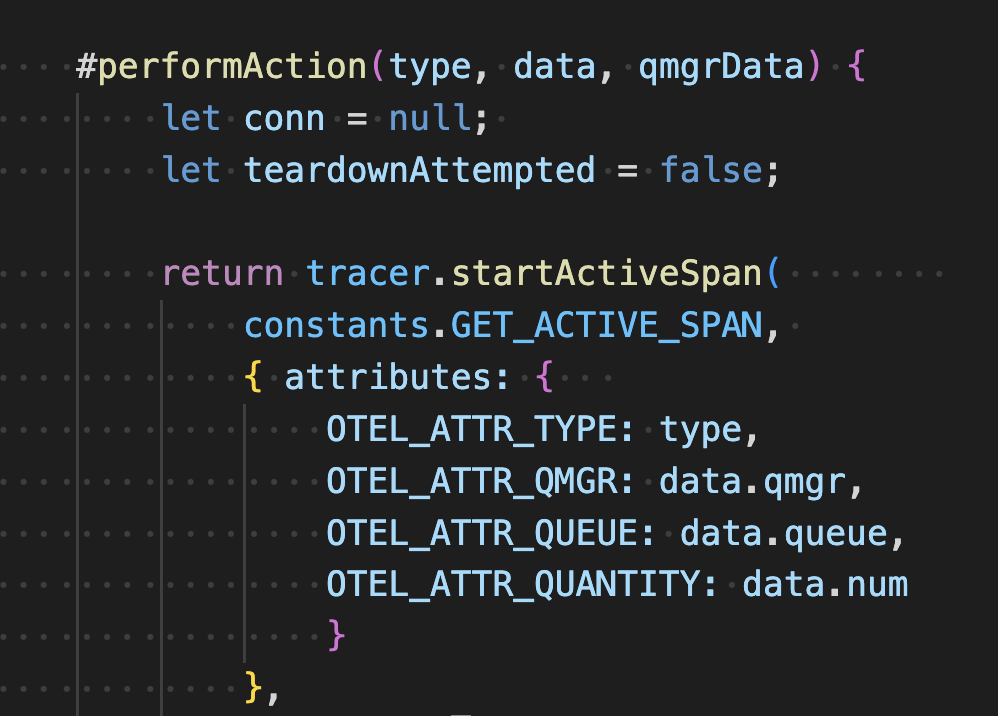
./queue-manager/qm-requests.jshas the private function#performActionwith the logic.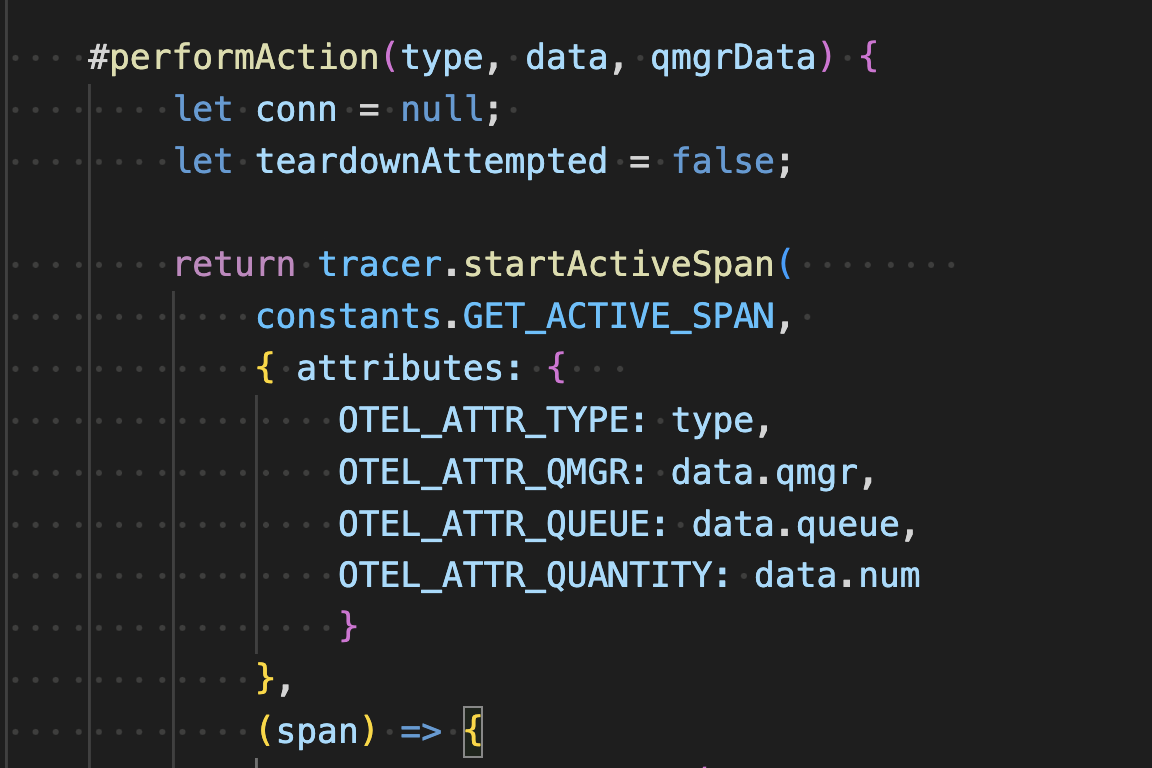
This starts a new span adding attributes that indicate the action type (put or get), the queue manager, queue and quantity of messages involved.
For get messages requests in ‘./processors/messages.js’ has the private function
#recordTrace.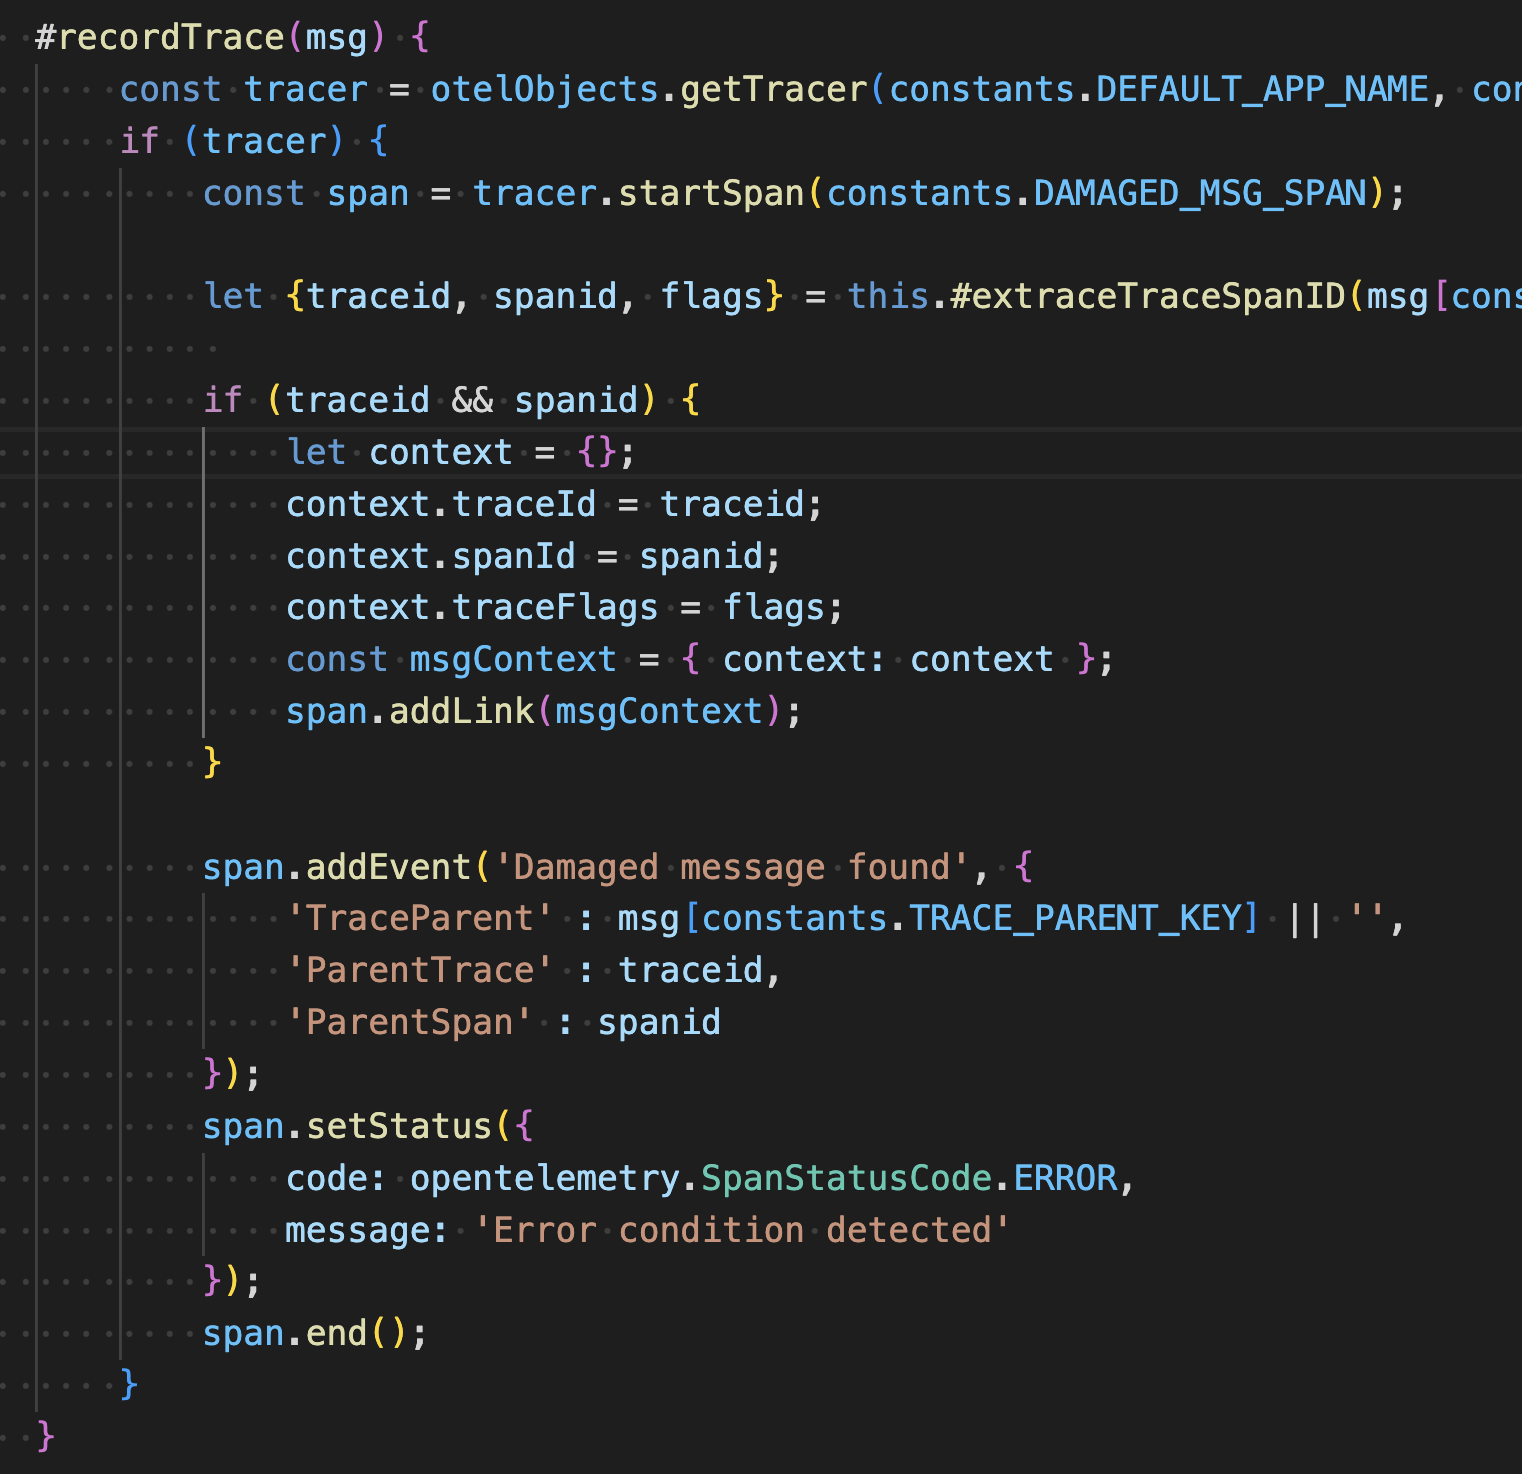
This creates an “ERROR” status span with a link to the trace and span under which the message was put onto the queue. The application does this for every message with our watermark.
The put message processing in
./queue-manager/connection.jsadds the watermark to a random selection of messages..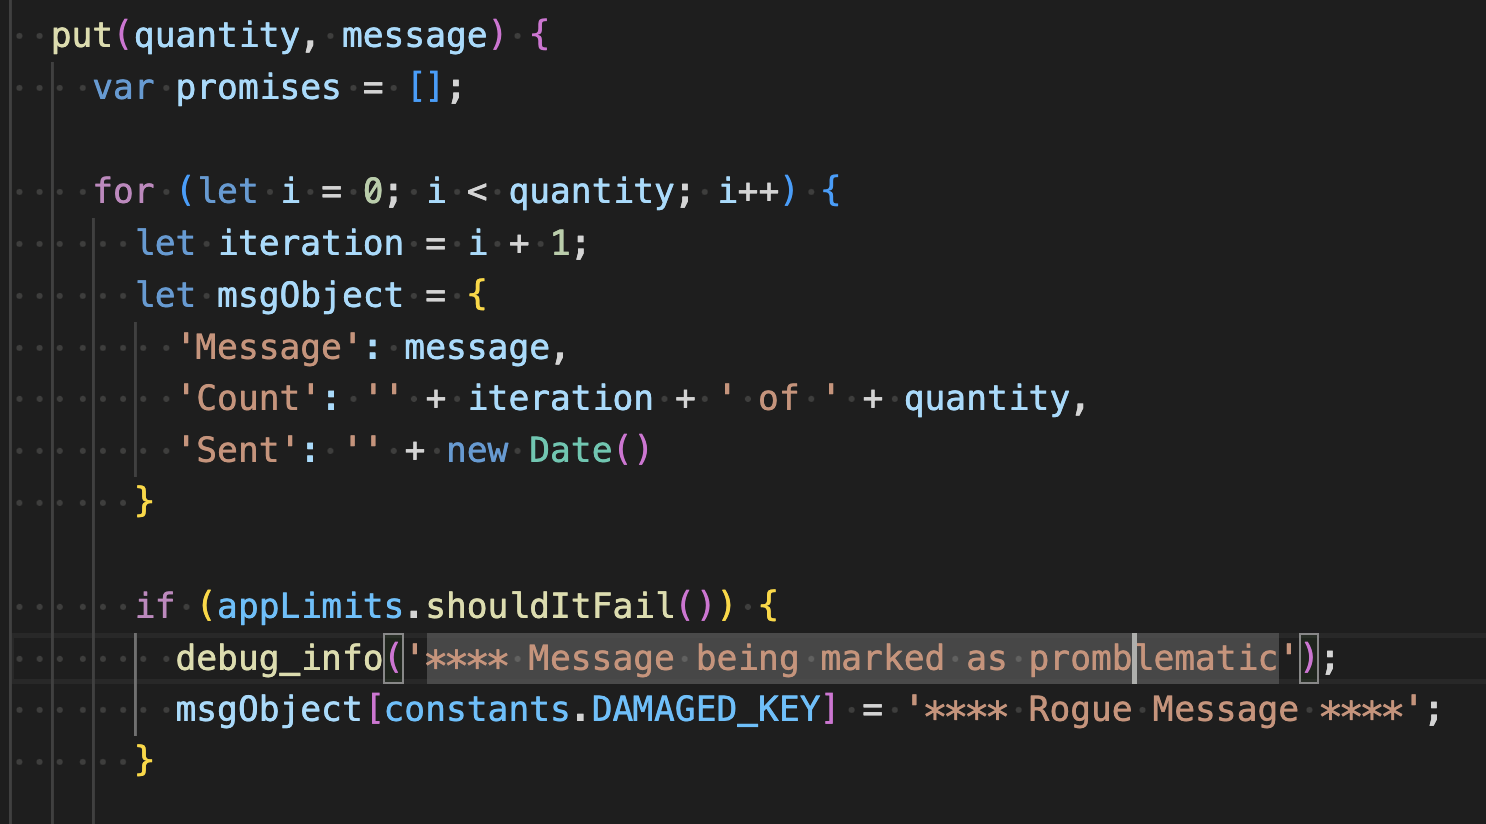
Step 6. Tracing the provenance of messages
Open a command window or terminal and run the following command several times.
curl "http://localhost:8080/put?QMGR=QM2&QUEUE=DEV.QUEUE.1"
Each time several messages should have been put onto queue “DEV.QUEUE.1”.
"Request to process 5 messages on QM2 accepted"
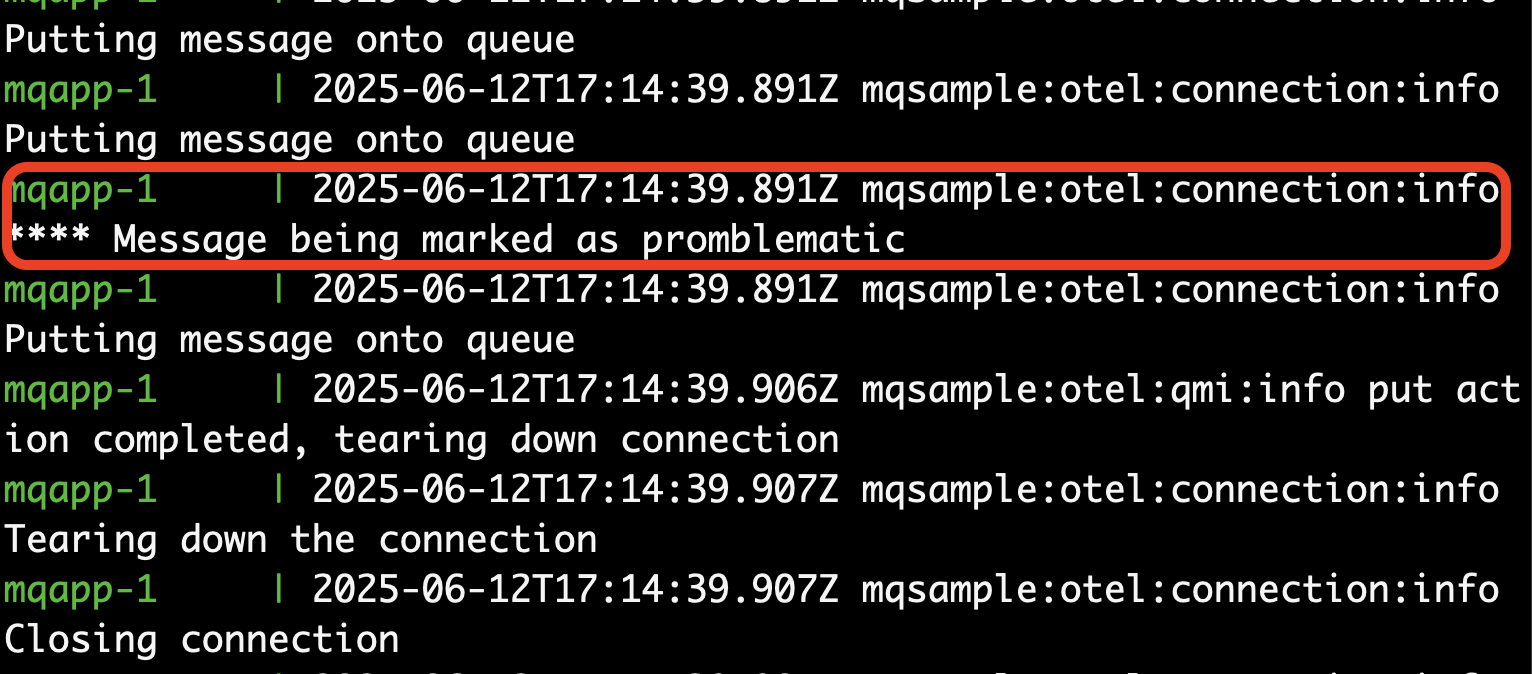
You should see several instances of problematic messages.
Repeatedly run the following command until the queue is empty.
curl "http://localhost:8080/get?QMGR=QM2&QUEUE=DEV.QUEUE.1"
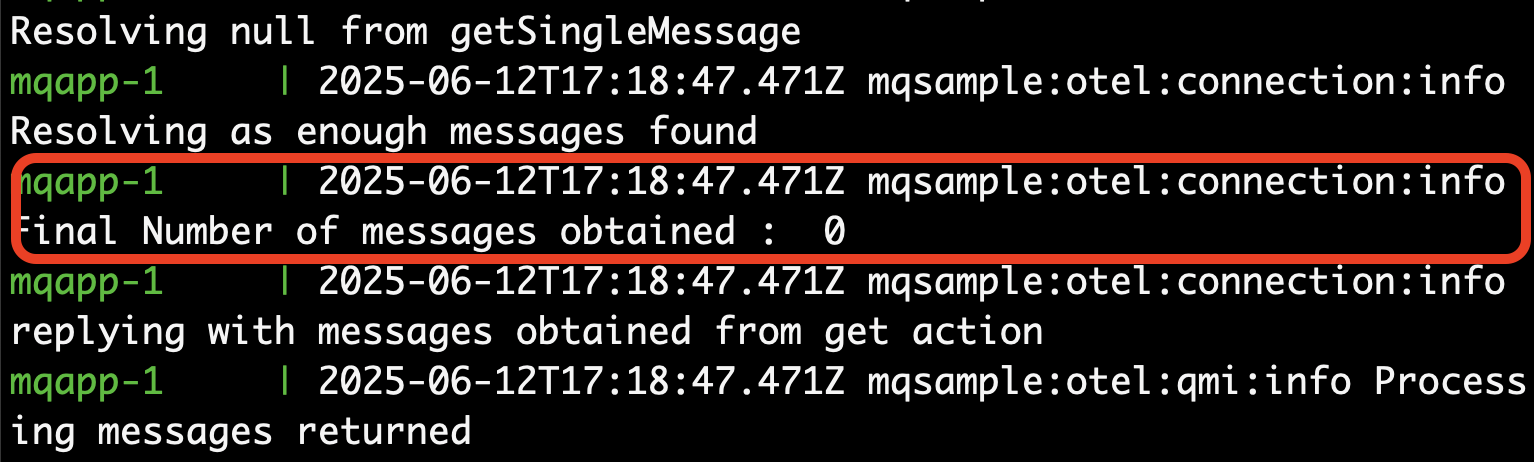
Each instance will fetch a random number of messages and process them as a group. Eventually the queue will be drained.
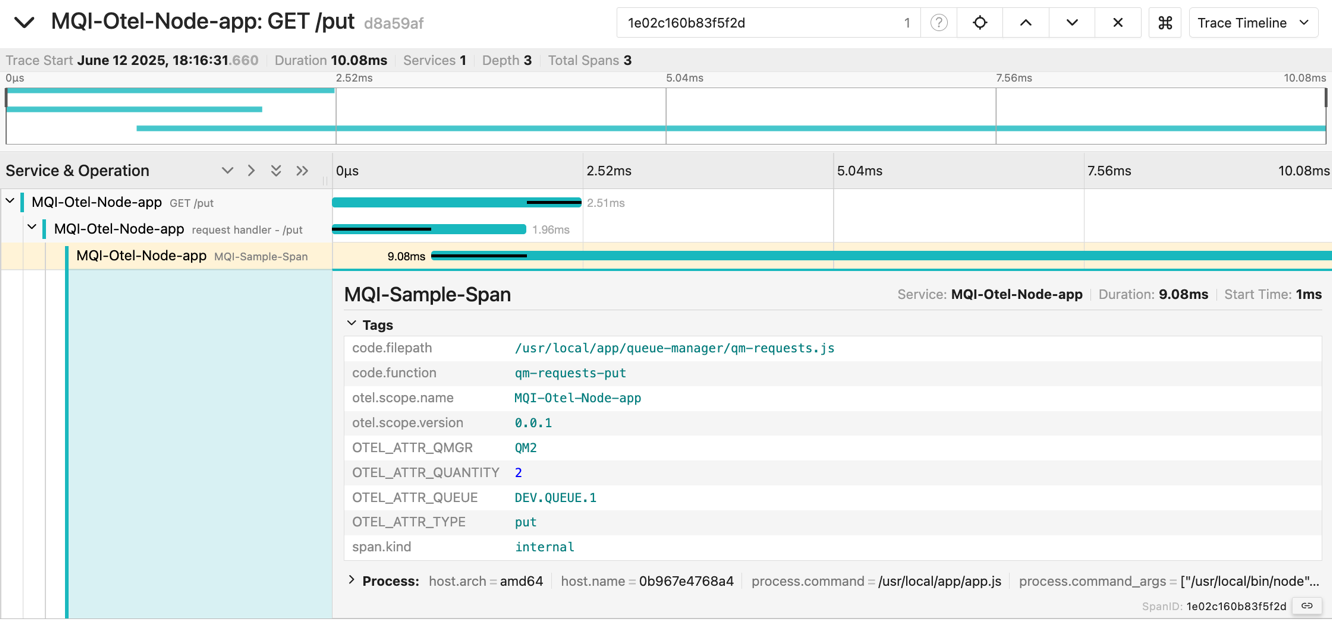
In the Jaeger UI, search for the MQI-Otel-Node-app GET /put traces.
Notice that that these traces consist of three nested spans, the third of which was created by our application.
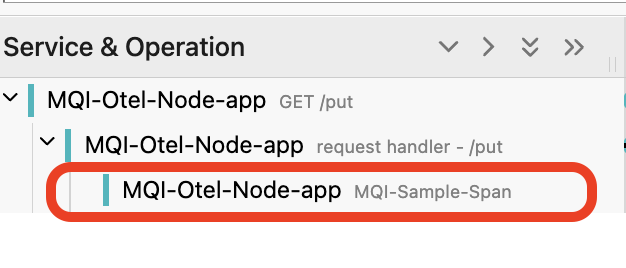
The parent spans were created by the node.js http module. The application span has the attributes that the application added.
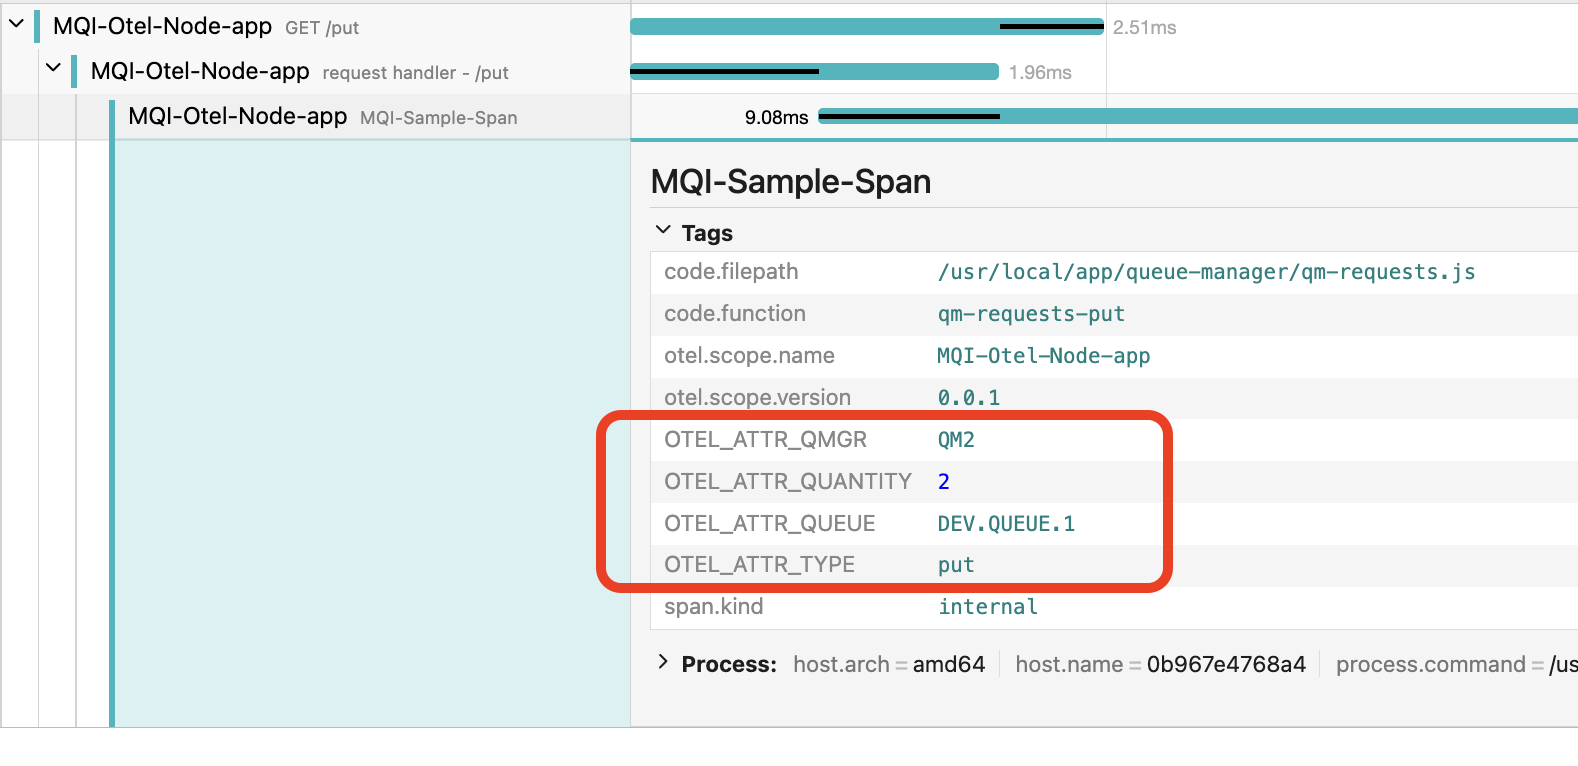
In the case of the image above the request delivered 2 messages to the queue DEV.QUEUE.1 on queue manager QM2.
Take a look at the relative duration of the spans.
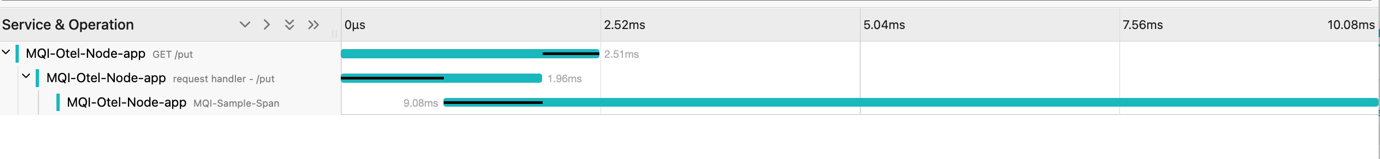
The top span covers the lifetime of the GET HTTP request. The second span covers the duration of the synchronous process that checks the request and returns to indicate if the request is acceptable. The final span covers the asynchronous process that connects to the queue manage delivers messages and closes the connection. There is an overlap between the second and final span when both are running in parallel, but the asynchronous span continues for long after the http synchronous request has returned. This is a normal model for HTTP frontend applications that need to return a fast response.
Now search for the MQI-Otel-Node-app GET /get traces.
Notice that some of them contain exceptions.
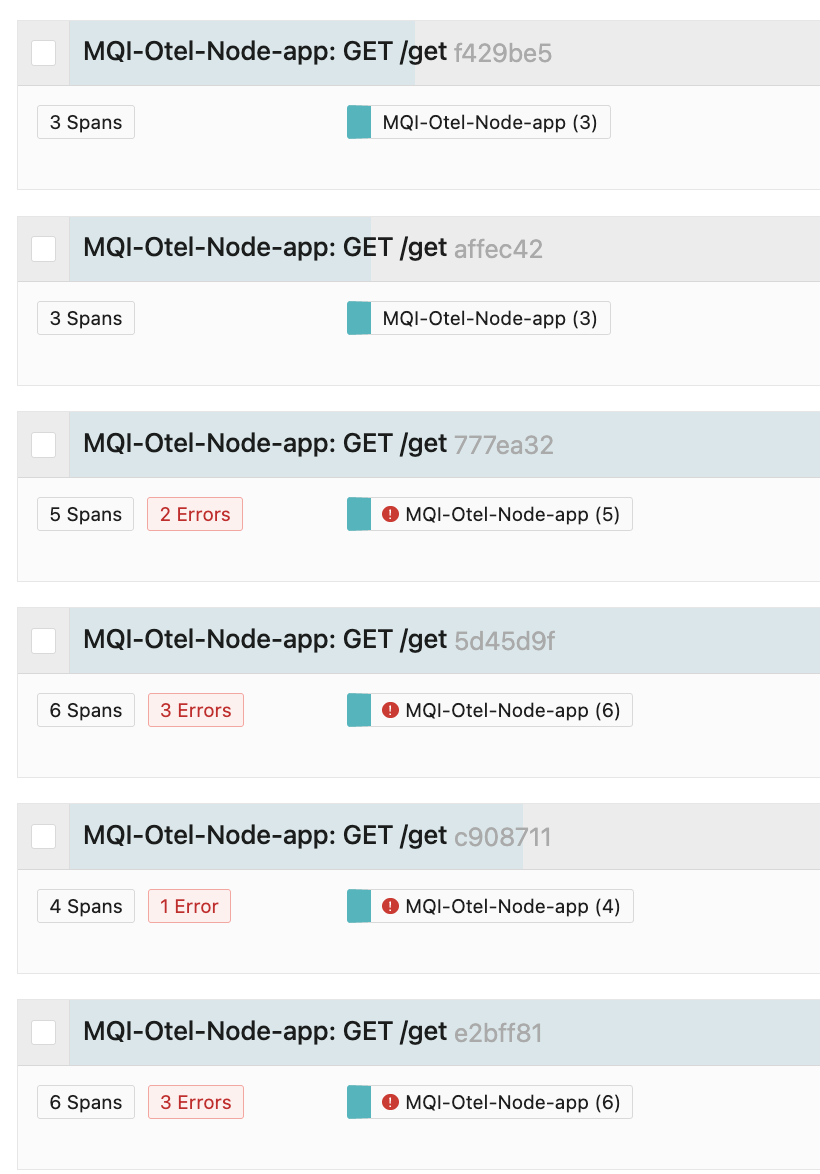
If you have one, pick a trace with several “Errors”.
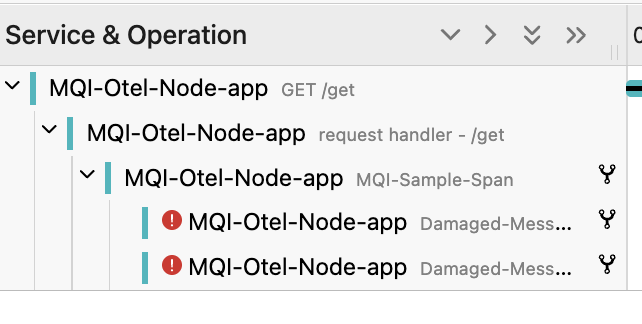
There is an exception span for every damaged message detected. These spans also show up on the trace timeline.
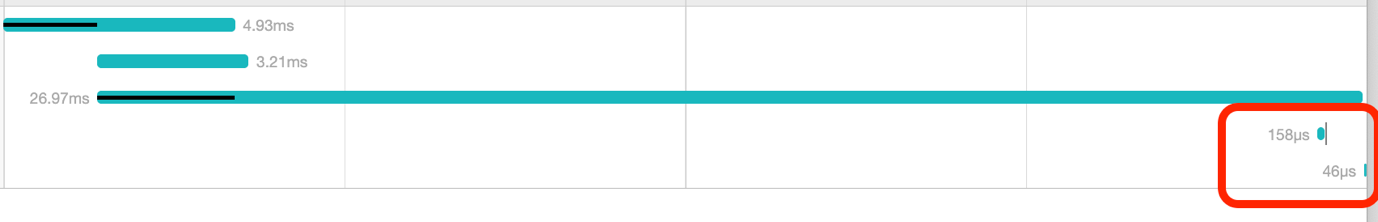
The time spent before the damaged messages are detected is when the application connects to a queue manager connection, opens the queue, and then gets the first message. The overlap covers the multiple gets, and the queue closes and the queue manager disconnects.
Open one of the Exception spans.
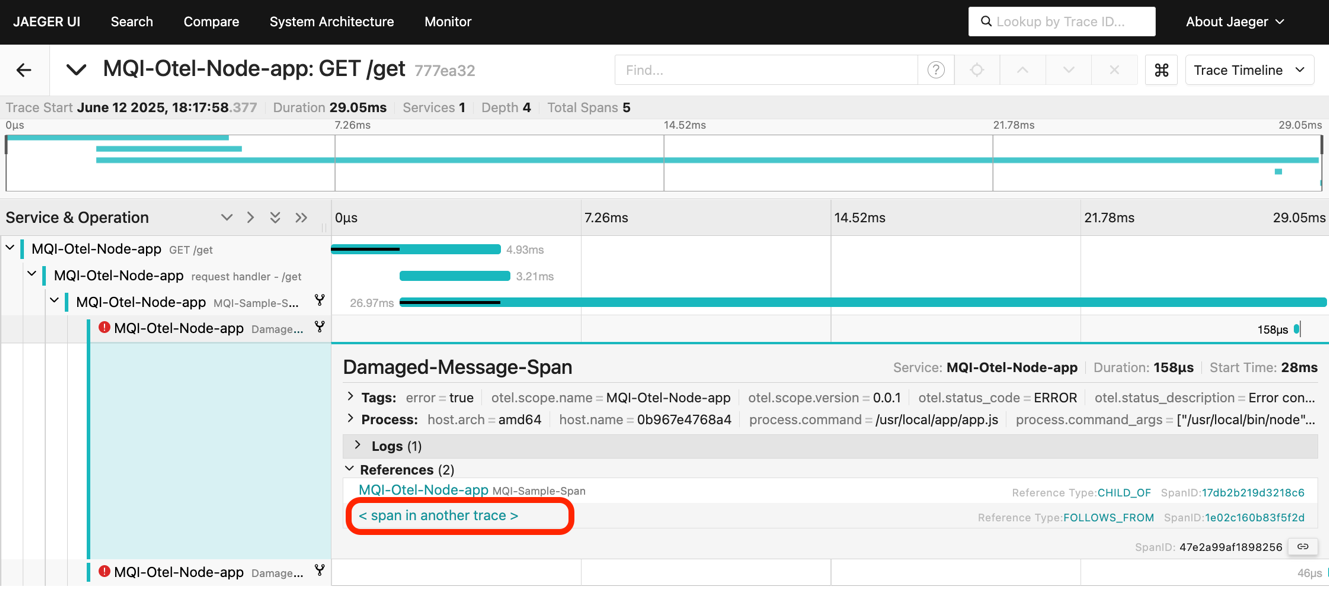
In the span references, there is a link to a “span in another trace”. Click this link. This will open the trace where this message was put onto the queue.
You can now examine the attributes associated with this origin trace and spans to understand how the damaged message was created.
Step 7. Gathering metrics
In the Prometheus UI, run a query for the metric MQI_sample_app_damaged_message_count_total.
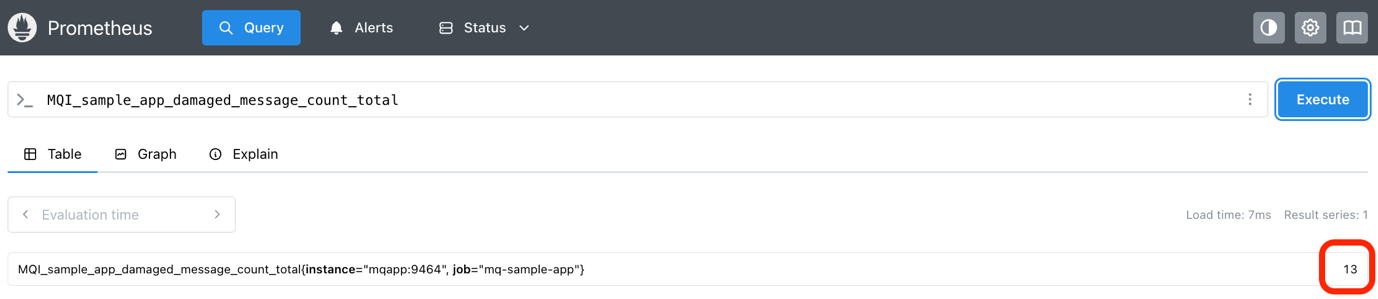
In our run, above, the value was 13, which means the get message logic detected 13 problematic messages.
Now run a query for the metric MQI_sample_app_damaged_get_request_count_total.
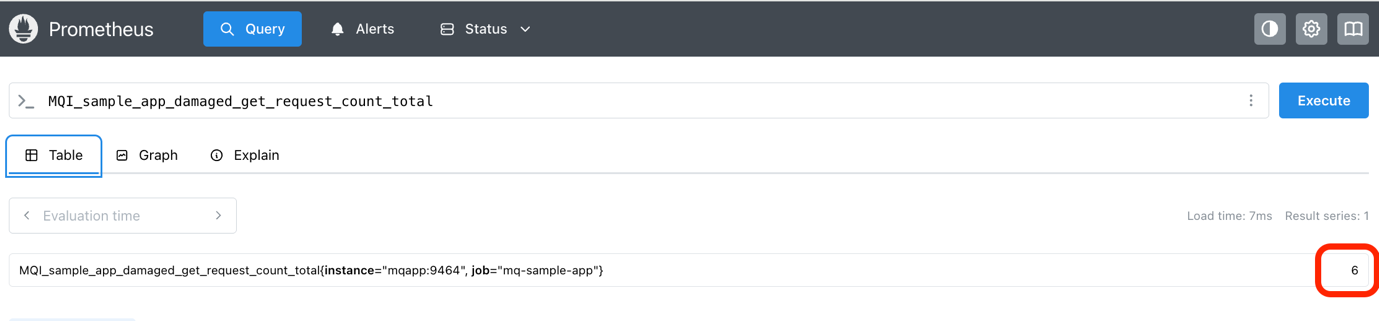
In our run, the value was 6, which means 6 of the get traces detected at least one damaged message.
These metrics could be added to a dashboard as a measure of how the application is operating.
Step 8. Adding extra provenance data to the trace
The trace data that the sample application added is just a taster. There may be other information that you want to preserve in the trace.
To gain hands-on practice in adding data to a trace, modify the code to accept an “OriginID” as part of the http request, reject the request if one is not provided, then add the”OriginID” as an attribute to the trace.
Hints for adding provenance data
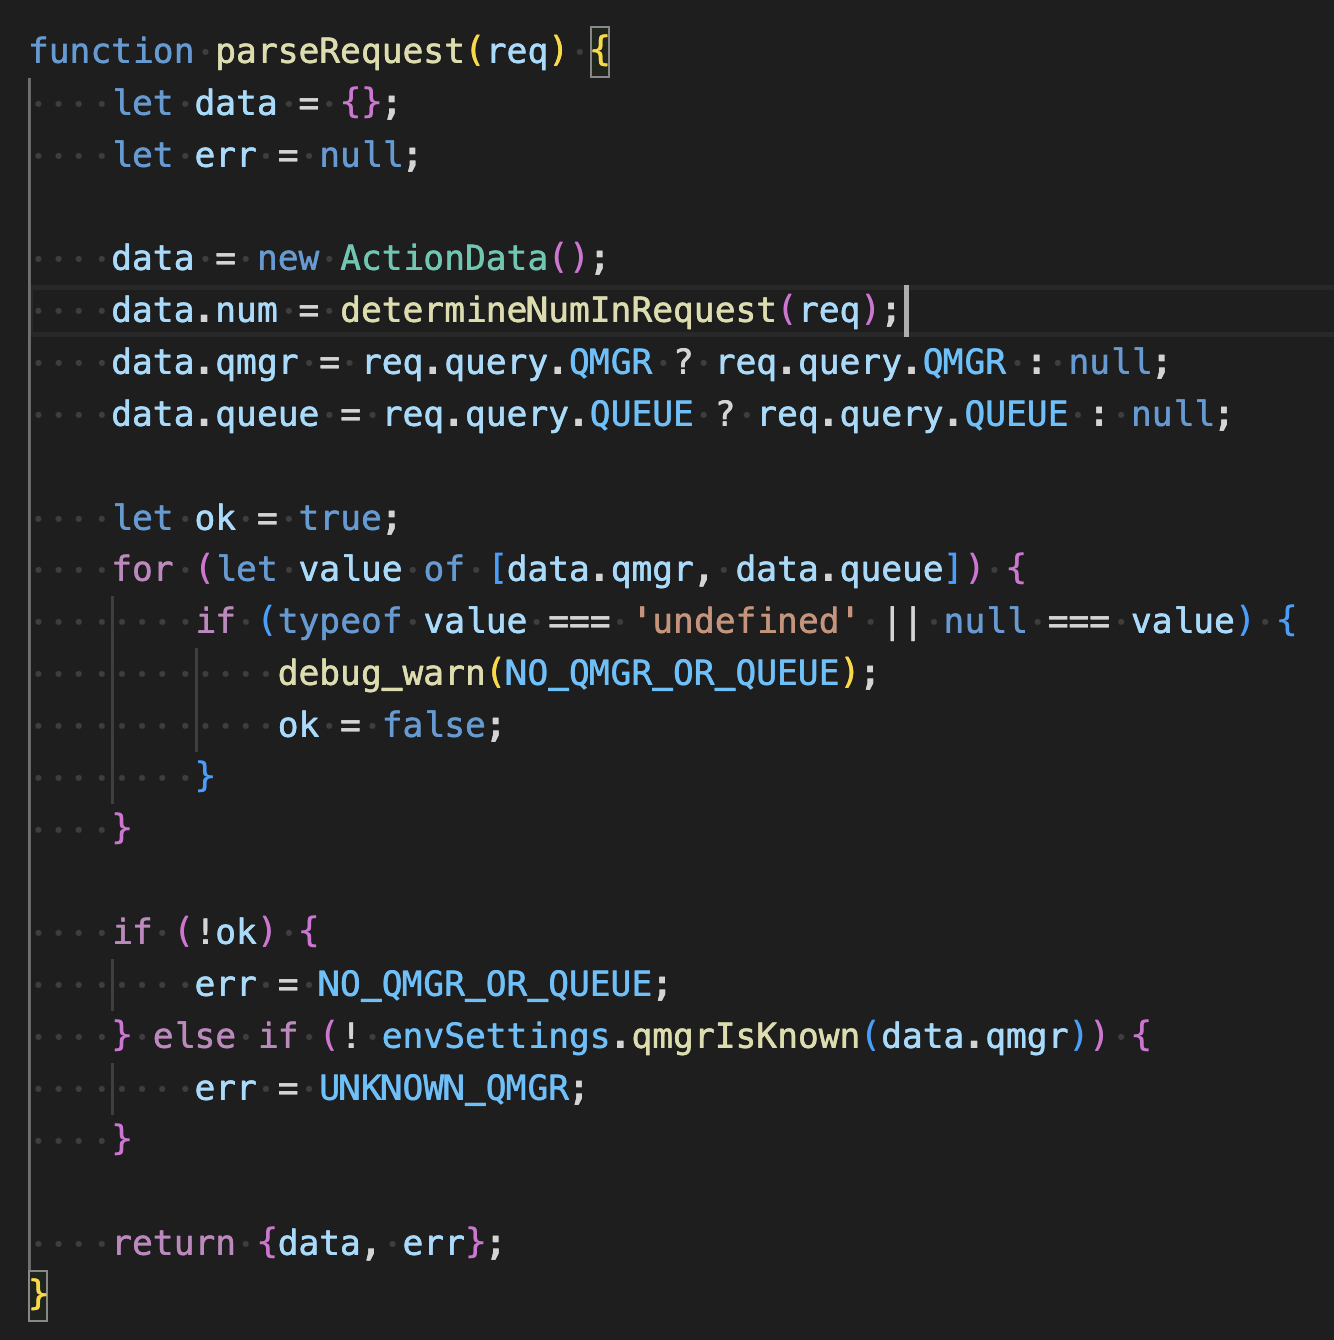
Request parsing is performed in the app.js function parseRequest.
Attributes are added to the span in the private function #performAction in ‘./queue-manager/qm-requests.js`.
Step 9. Metric: Creating metrics
The sample application has created two simple counters metrics, but Otel API allows you to create histograms or gauges. A common metric is to record the time taken for tasks as a histogram.
To gain hands-on practice in creating metrics, modify the code to create a new metric to count the total number of messages processed.
Hints for creating metrics
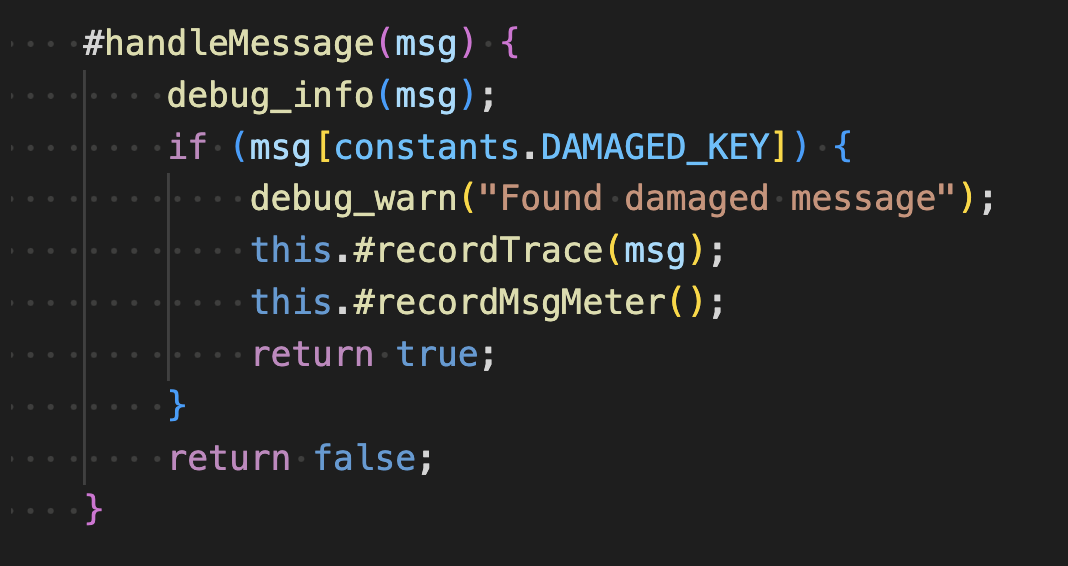
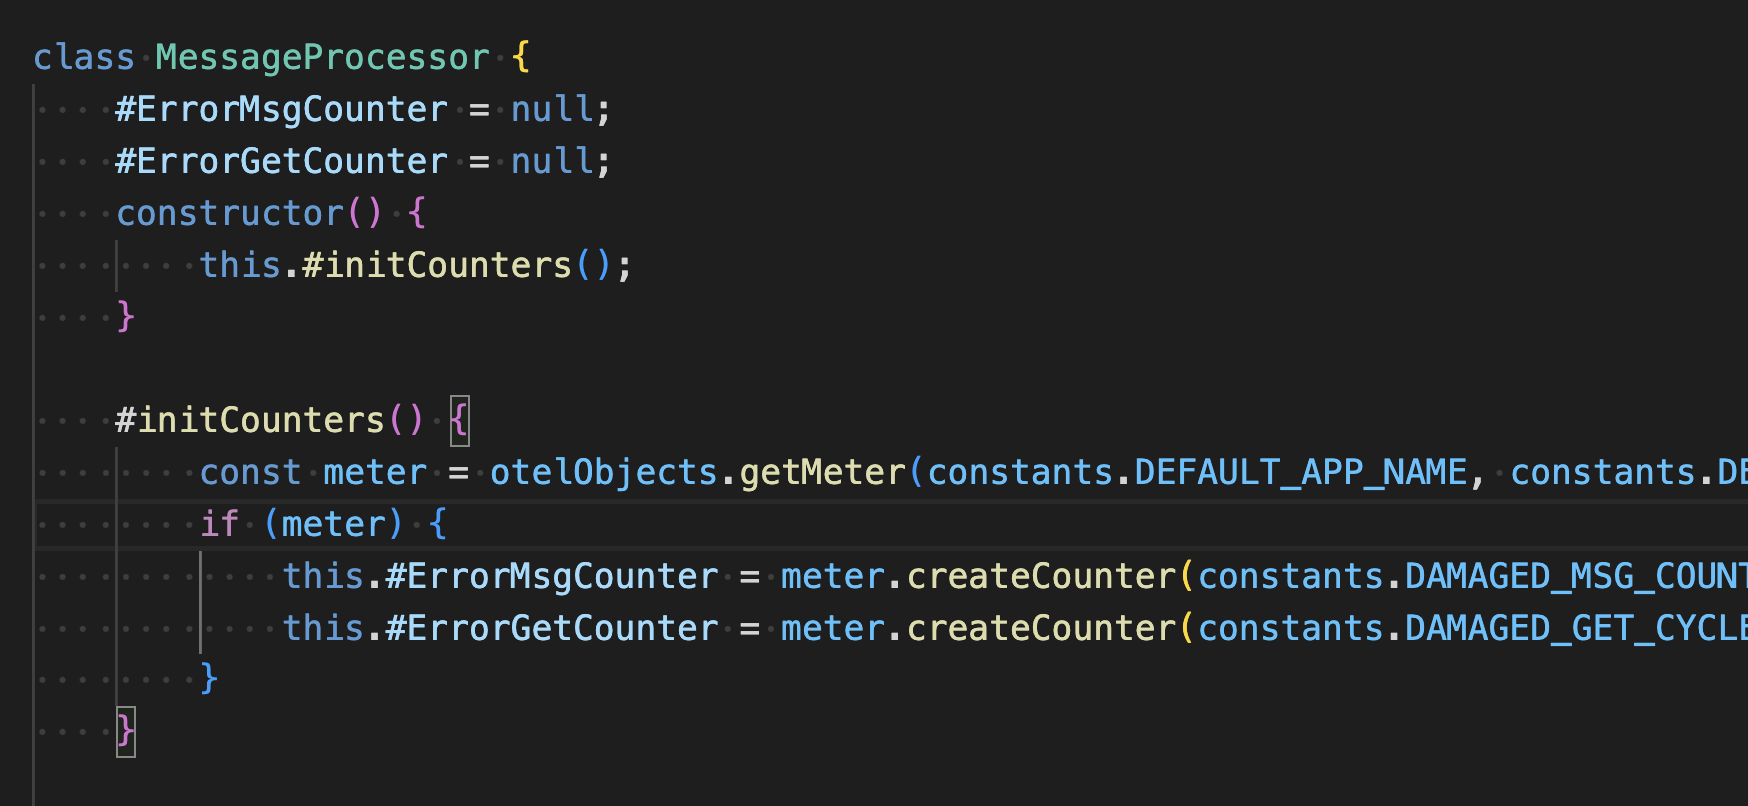
The get logic in the application creates two metrics. The metrics are created as private fields in the constructor of the MessageProcessor class in the file processors/messages.js.
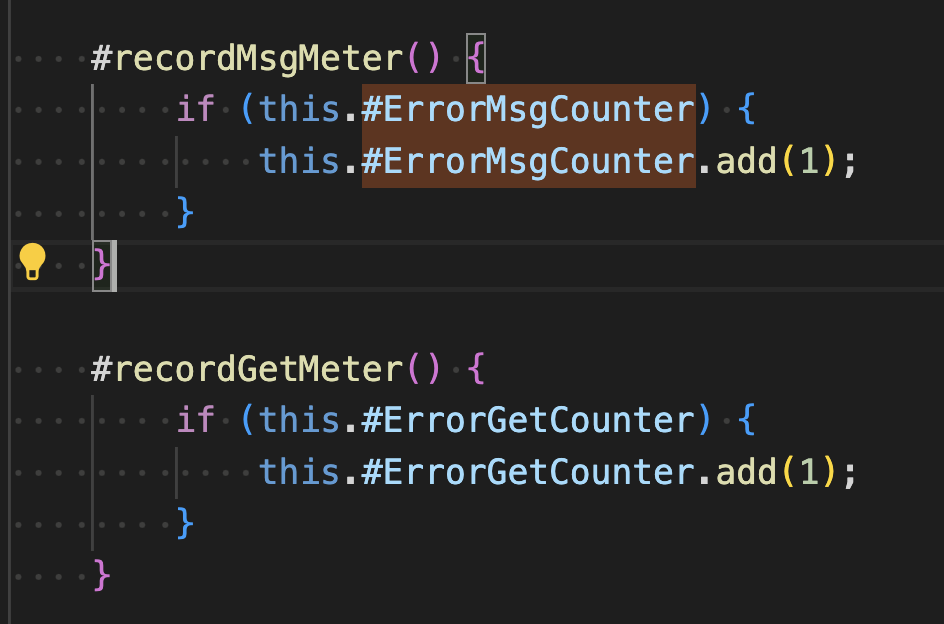
They are incremented in the private functions #recordMsgMeterand #recordGetMeter.
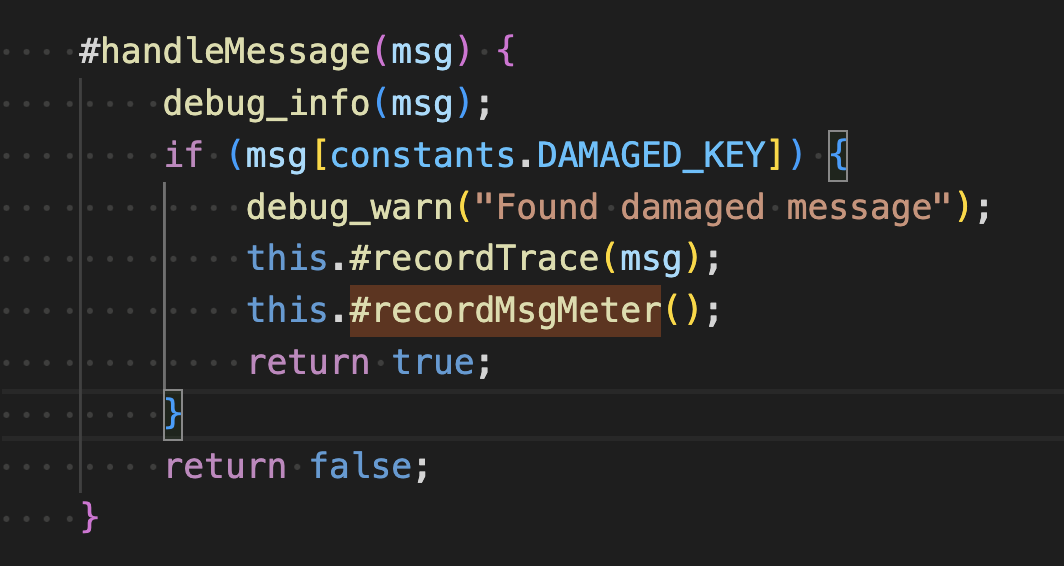
These are in turn invoked in #handleMessage.
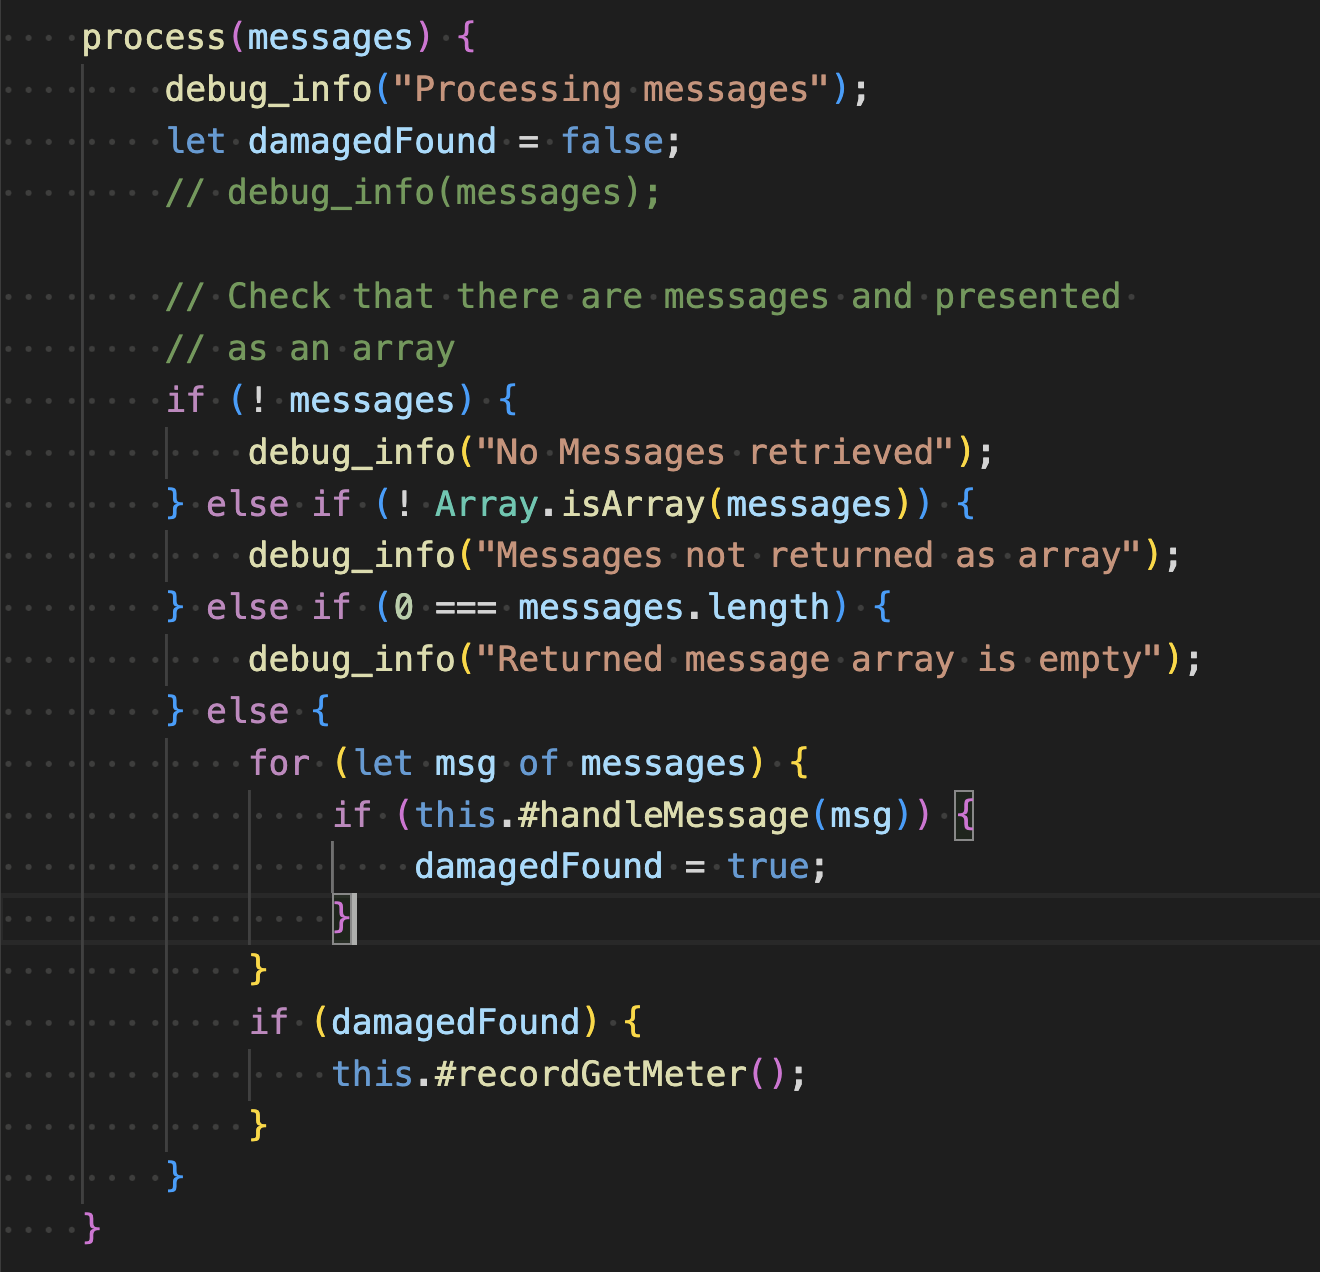
And the method public method process.
Summary
In this tutorial, you learned how to leverage OpenTelemetry and the built in Otel capability in IBM MQ’s messaging client libraries as a problem resolution tool to identify the provenance of problematic messages.
Many frameworks and libraries are Otel-ready. Initializing the Otel SDK wakes up this dormant code so that you can add instrumentation to existing code without modifying that code.
By adding application-specific instrumentation, you can frame events that occur in your application into the overall context that the framework and libraries that you are using provide.
Find out what other trace and metrics you can add on the OpenTelemetry home page.